Исследование реакции ионосферы на продукты горения топлива при работе двигателей транспортных грузовых кораблей серии «Прогресс» по данным иркутского радара некогерентного рассеяния

Автор: Шпынев Б.Г., Алсаткин С.С., Хахинов В.В., Лебедев В.П.
Журнал: Солнечно-земная физика @solnechno-zemnaya-fizika
Статья в выпуске: 1 т.3, 2017 года.
Бесплатный доступ
В рамках совместной работы ФГУП ЦНИИмаш, РКК «Энергия» и ИСЗФ СО РАН в 2007-2015 гг. проводился активный космический эксперимент «Радар-Прогресс» (до 2010 г. «Плазма-Прогресс»). На Иркутском радаре некогерентного рассеяния проводились исследования пространственно-временных характеристик ионосферных возмущений, возникающих вследствие инжекции в ионосферную плазму выхлопных газов бортовых двигателей транспортных грузовых космических кораблей серии «Прогресс». В качестве основного эффекта при инжекции продуктов горения в ионосферную плазму рассматривается возникновение новых очагов рекомбинации ионов атомарного кислорода О+ на молекулах воды и углекислого газа, что приводит к образованию области пониженной концентрации плазмы («дыры» ионизации). В условиях ночной ионосферы данная область заполняется ионами водорода из плазмосферы, что меняет ионный состав плазмы и характеристики сигналов некогерентного рассеяния. При наблюдении процессов формирования и релаксации области пониженной концентрации плазмы критическими факторами являются степень заполнения диаграммы направленности радара продуктами горения и скорость термосферного нейтрального ветра, который выносит молекулярные фракции выброса из диаграммы направленности радара. Влияние этих факторов приводит к низкой повторяемости успешных наблюдений эффекта. В успешных экспериментах зарегистрированы уменьшение электронной концентрации до 35 % и длительность существования «дыры» ионизации до 30 мин. Время существования на месте «дыры» области с высоким содержанием ионов H+ может составлять до одного часа.
Ионосфера, электронная концентрация, активные космические эксперименты, выброс продуктов горения в ионосферную плазму
Короткий адрес: https://sciup.org/142103635
IDR: 142103635 | УДК: 550.388.2 | DOI: 10.12737/22812
Текст научной статьи Исследование реакции ионосферы на продукты горения топлива при работе двигателей транспортных грузовых кораблей серии «Прогресс» по данным иркутского радара некогерентного рассеяния
Since 2007, in the framework of active space experiments (SE) “Radar-Progress” (until 2010 “Plasma-Progress”) [Potekhin et al., 2009; Khakhinov et al., 2012; Khakhina et al., 2012, 2013] at the Irkutsk Incoherent Scatter Radar (IISR) [Stallions et al., 2002] ionospheric irregularities generated by exhaust gases of Progress cargo spacecraft engines have been studied. In 2007–2015, 91 SE sessions were carried out. The IISR was used to examine radar signals both from irregularities produced by exhaust jets and from ionospheric irregularities arising from the chemical reaction of these exhausts with plasma particles.
The active experiments were conducted in the CS autonomous flight mode upon completing the work program and undocking CS from the International Space Station (ISS), and had the following characteristics:
-
• relatively small amount of exhaust products injected into the ionosphere (fuel burn-up rate varies from 376 g/s to 1 kg/s, the running time of the liquid-fuel rocket engine is from 5 to 11 s);
-
• different external conditions of the experiments, such as background electron density, helio-geophysical conditions, height and orbit attitude of CS, type of liquid-fuel rocket engine, and direction of the exhaust jet.
To examine spatial and temporal characteristics of ionospheric disturbances caused by injection of exhaust products of the liquid-fuel rocket engine, the IISR was activated several hours before an SE session to determine background parameters of ionospheric plasma in the zone of CS passage and continued to make measurements for several hours after the SE session.
Ionospheric effects were studied by applying techniques described in [Shpynev, 2004; Medvedev et al., 2004; Lebedev et al., 2008; Khakhina et al., 2010] in two frequency channels for simultaneous measurement of power profile and spectral characteristics of incoherent scatter (IS) signals. The spectral measurement channel employed a 750 µs rectangular pulse. In the channel for recording the power profile during low solar activity in 2007–2008, the ionosphere was probing by using a 150–200 µs rectangular pulse; since 2009, a 200 µs phase-shift pulse (with the 5- or 11-bit elementary Barker code) with subsequent consistent reception. In addition, since 2009, the experiments exploited two beams spaced in the meridional plane to determine the dynamics of disturbed region.
MECHANISMS OF THE IONOSPHERIC EFFECT OF EXHAUST PRODUCTS ANDGEOMETRIC FACTORS OF THE ACTIVE EXPERIMENT “RADAR-PROGRESS”
In different years, the experiments were carried out under different solar activity conditions and parameters of the CS orbit at which its engines worked. The most successful experiments were performed during low solar activity in 2007–2009 when the ISS–CS orbit was at ~340–360 km and exhaust products of the liquid-fuel rocket engine appeared near the maximum electron density. In this case, the background electron density was low (about 105cm–3), thus providing a greater percentage of exhaust particles entering into reaction with background ionospheric plasma.
To describe the geometry of the experiment, we use the standard term “antenna pattern” (AP), which refers to the form of the main half-power lobe. In the experiments carried out in 2007–2009, the low orbital height ensured better filling of the IISR AP with exhaust products. This factor is a very important condition for the SE because an IS signal is formed by the total volume of the AP beam, and, if exhaust products fall only within a small portion of the main lobe, their impact on the full IS signal is insignificant. To illustrate the effect of AP filling, Figure 1 shows the geometry of two experiments performed on September 2 and 3, 2009, which clearly demonstrate the crux of the problem of filling AP with exhaust products of the liquid-fuel rocket engine. The projection of the IISR AP at 300 km has the shape of an ellipse with angular sizes of 0.5° in a direction roughly north–south and 10° in the east–west direction. The rectangle at the origin schematically indicates the position of the waveguide-slot antenna relative to geographic coordinates. The scale spacing along axes is 2°. The operating principle of the IISR’s antenna system allows beam-ellipse scanning in a roughly north–south direction by changing the carrier frequency of transmitters (154–162 MHz). The scanning sector is marked with respective ellipses in Figure 1. Given the orbital parameters, the Progress cargo spacecraft falls within the scanning sector of the IISR once or at most twice a day.
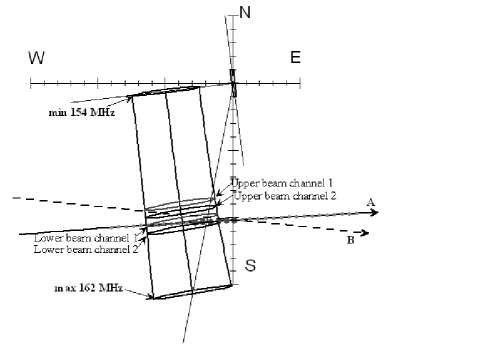
Figure 1 . Geometry of the Progress CS’s passage through the IISR AP: A is September 02, 2008; B is September 03, 2008
The comparison of the paths A and B in Figure 1 (solid and dashed lines with arrows) suggests that in two consecutive experiments the angle between beam ellipse and orbital trajectory differs considerably. The optimal flight path would be its coincidence with the long axis of the beam ellipse, but this was not practically realized in either of the SE sessions.
To measure CS radar characteristics directly during the passage (for a few tens of seconds), the AP scanning in the experiment was performed in several directions. In turn, to measure incoherent scatter signals before and after the CS passage, AP was usually set at the center of the CS passage zone and remained constant during all IS measurements. Obviously, if the exhaust region is localized sufficiently, for the path A in Figure 1 the degree of AP filling with exhaust products is much higher, and the effect in measuring IS signals is more pronounced. In experiments after 2009, each measurement channel used two AP beams (upper and lower beams in Figure 1), which were set up near the left and right boundaries of the CS flight path. Due to the above peculiarities of the geometry of the experiments, in most CS passages we could not attain the optimal flight path, the AP filling factor was insignificant, and there were no considerable ionospheric density variations.
The second factor affecting results of the experiments is the thermospheric neutral wind that blows the exhaust jet off the IISR’s scanning sector. Simple estimates indicate that with a 5 km transverse AP width at a height of 300 km and with the 50 m/s horizontal velocity of the neutral wind, exhaust products leave AP within two minutes, so the real effect can occur only under low wind conditions in the nighttime ionosphere. If the jet has time to react with plasma, the effect can be detected because charged particles are frozen into the geomagnetic field and only partially are carried away by the neutral wind along magnetic field lines. Since experimental measurements of the neutral wind in the thermosphere are practically impossible, this factor gives rise to considerable uncertainty in performance of the experiment in determining the place and time of CS engine start.
Another factor that affects the degree of AP filling with exhaust products of the liquid-fuel rocket engine is a quadratic geometric AP divergence. This factor played a negative role in 2012–2013 when the ISS orbit was raised from 350 to 410 km. In this case, the AP cross-section increased 1.4 times and, in view of the quadratic reduction in IS signal power with height, the signal/noise ratio for ionospheric effects worsened twofold.
Real parameters of exhaust jet and its related molecular cloud are also unknown; therefore it is rather difficult to estimate the true filling factor for AP at large heights. Our estimates show that in principle the number of particles in the CS exhaust jet is sufficiently large to fill a wide space with sizes of a few tens of cubic kilometers, but such estimates ignore the effect of condensation of water vapor and its transformation into ice crystals. When the liquidfuel rocket engine is running, disperse particles can be formed mainly through condensation of water vapor and carbon dioxide in the exhaust jet due to a sharp drop in temperature of exhaust products as they expand.
Condensation of water vapor in exhaust products when spacecraft (SC) engines run has been discussed by various authors (most thoroughly in [Wu, 1975]). In all these works, authors assume that condensation products are in thermal equilibrium with the gas phase of exhaust products. Under real-life conditions, this is the exception rather than the rule. The latent heat of condensation per molecule is more than an order of magnitude greater than the average kinetic energy of molecules of exhaust products. Condensation of water vapor occurs with the heat of particles, and maintaining them in thermal equilibrium with surrounding gas requires intense heat removal.
Platov et al. in [Platov et al., 2004, 2005] describe conditions for the formation of water and dry ice in the lower thermosphere, which provide fairly realistic insight into processes of condensation of exhaust particles in the ionosphere. In cases when density of a medium in which condensation occurs is sufficiently high and the partial pressure of water vapor is low as compared to the pressure of exhaust products in the exhaust jet, the thermal equilibrium is effectively maintained through collisional heat exchange with the environment. When the last stage launchers and spacecraft onboard engines are running, the pressure of exhaust products in the exhaust jet is by an order of magnitude lower than that in booster engines operating in the lower atmosphere, therefore the rate of heat exchange in these conditions can also decrease by an order of magnitude. In this case, the assumption about thermal equilibrium proves to be unacceptable, and it is not clear enough to what extent this mechanism is valid for ionospheric heights.
From the features of the experiment it follows that the analysis of data from certain Radar-Progress SE must make allowance for many factors, some of which cannot be controlled. Perhaps, this very fact is responsible for the rare occurrence of the observed effects.
As already mentioned, the nature of the ionospheric effect of CS engines is governed by two mechanisms. The former involves forming a local disturbed region with a nonstandard chemical composition in the ionosphere. The latter entails a change in the chemical composition and plasma ion density due to reaction with exhaust products. The main reason for the change in ionospheric plasma conditions during CS engine operation is the generation of recombination centers, which in a large volume of space produce a zone of reduced atomic oxygen density. The molecules H2O, CO2, and H2 have a 100–1000-fold higher rate of reaction with oxygen ions O+ [Krinberg, Tashchil-in, 1984] than the natural ionospheric heavy molecules N2 and O2 do. Since the main exhaust products are vapors of H 2 O and the main ionospheric plasma component at these heights is atomic oxygen, the most significant chemical reactions are:
-
• the exchange reaction H 2 O+O+→H 2 O++O; (1)
-
• the dissociative recombination reaction
Н 2 О++ е –→ОН+Н; (2)
-
• similar reactions for CO2 and H2 .
Reactions (1)–(2) and respective reactions for CO2 and H2 accomplish conditions for the formation of a region with low oxygen ion density in a certain volume of ionospheric plasma. This region is filled with atomic hydrogen ions coming from the plasmasphere along geomagnetic field lines. The source of atomic hydrogen is represented by solar wind protons trapped by Earth’s magnetosphere [Krinberg, Tashchilin 1984]. Under low solar activity conditions, atomic hydrogen abundance at heights above 400 km can be considerable (40–70 %), therefore the ionosphere dynamics above the ionization maximum is largely determined by the relative content of atomic oxygen and atomic hydrogen. The main reaction responsible for the plasmasphere composition is the exchange reaction:
O ++ H ^ O + H + . (3)
Rates of forward and reverse reaction (3) are low, therefore a change of the ion composition in the outer ionosphere is an inertial process and a sharp reduction in the atomic oxygen density due to reactions (1)– (2) cannot be quickly restored by influx of H+ from the plasmasphere. Particle transport in the nighttime ionosphere is driven by the influx of protons from the plasmasphere reservoir, but the transport rate is limited by the sound velocity, and the filling of the resulting "hole" of plasma density up to the initial state takes 15–20 minutes. Restoring the original ion composition by reaction (3) takes even more time. Hence, reactions (1)–(3) can significantly change the percentage of these ions, thus affecting the shape of IS spectra observed in the experiment. In a steady state, the hydrogen ion influx produces atomic oxygen ionization according to reverse reaction (3), and downward moving O+ ions recombine in the lower ionosphere. This stationary process determines the equilibrium height of the plasma ion composition transition, which should decrease in SE. Similar estimates of the recovery time for the ionization “hole” were made during active experiments in the equatorial ionosphere, where the magnetic field is oriented horizontally and ions come from neighboring horizontal areas along the meridian [Bernhardt et al., 2001]. It is evident that under such conditions the ion composition remains constant.
EXPERIMENTAL RESULTS
As mentioned above, most successful experiments, which observed electron density variations, were conducted during low solar activity when the CS orbit was near 350 km. For then existing background electron density values this height roughly coincided with the ionization maximum. The most successful was the experiment performed in September 2007 when the effect of ionization "hole" formation was observed in three of six measurement sessions.
Figures 2–4 present the results of several experiments in which the main effect of Progress CS liquid-fuel rocket engine exhaust gases can be attributed to the short-term decrease in N e ( h ) lasting from a few minutes to an hour. Figure 2 shows the measurement data on N e( h ) acquired in the experiment performed on September 21, 2007. The central vertex of the triangle in the figure indicates the height and time of CS engine start (hereinafter the triangle color is selected to contrast with the background of the figure). In this case, a region with low electron density was formed at 260–330 km. A decrease in N e in this region was ~35 % of the background value. The recovery process lasted ~10 min.
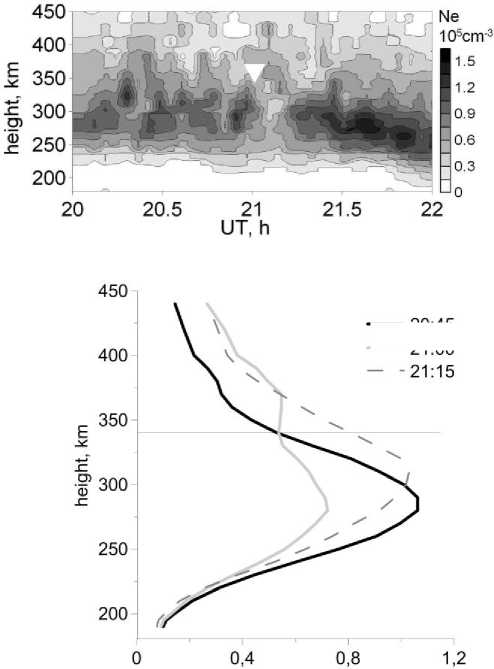
electron density, Ne105/cm3
Figure 2 . Results of ionospheric measurements made on September 21, 2007. The period the liquid-fuel rocket en-
----20:45
21:00
gine runs for braking is 21:00:13–21:00:18, the flight height is 341.56 km
8 8.5 9 9.5 10
UT, h
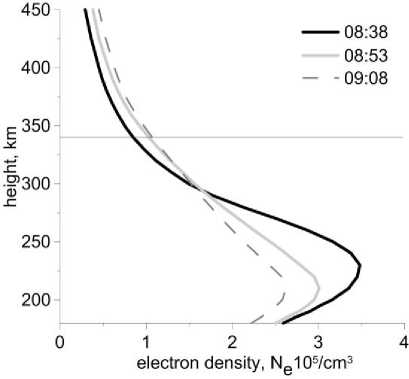
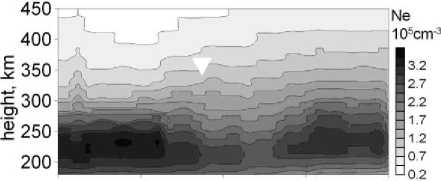
Figure 3 . Results of ionospheric measurements made on September 25, 2009. The exhaust jet is northward.
The liquid-fuel rocket engine’s running time is 08:53:39–08:53:49; the flight height is 345.06 km
а
b
c
d
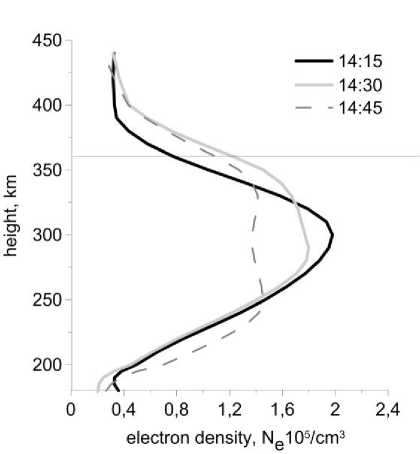
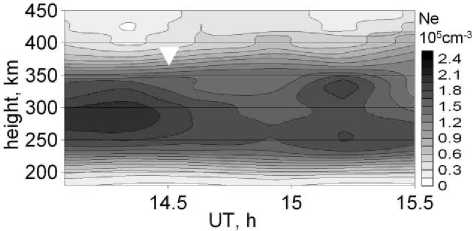
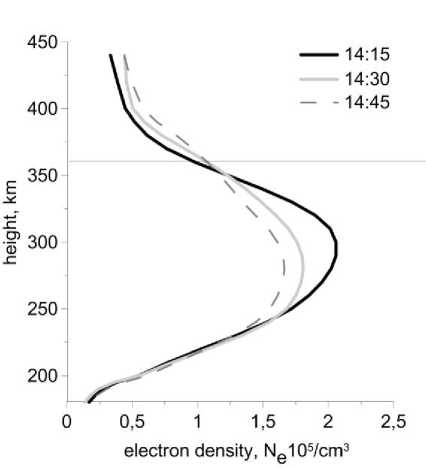
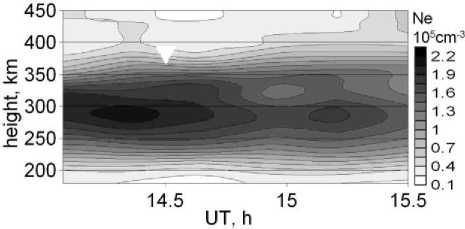
Figure 4 . Results of August 31, 2010 ionospheric measurements: a , b — 159.3 MHz; c , d — 160.2 MHz. The period the liquid-fuel rocket engine runs for braking is 14:30:05–14:30:11, the flight height is 365 km
In Figure 3, in the September 25, 2009 experiment, the region of low electron density was formed below 200– 270 km. A decrease in N e in this region was ~30 % of the background value. The recovery process lasted up to half an hour. Note that this experiment was one of the few in which N e in the evening was as high as 3·105cm–3.
Since 2009, for SE we have adopted the mode of measurements with two spaced beams. With the IISR’s constant clock frequency of 24.4 Hz, the statistical accumulation of IS signal in each data channel decreased by half, thus leading to an increase in the dispersion of experimental IS data. The choice of this mode of operation was governed by plasma velocity vector measurements, but this worsened temporal resolution during IS signal measurements in the course of the space experiment. A significant decrease in the total probing signal power was also due to the use of a phase-shift signal in the channel of electron density measurement. Since the IISR works on a principle of frequency scanning, during the transition between subpulses in the Barker code the signal is emitted in a direction different from that of the main lobe. Depending on the phase code, power losses can be as great as ten percent or more.
Figure 4 illustrates N e variations for the upper beam at 159.3 MHz ( a , b ) and for the lower beam at 160.2 MHz ( c , d ) in the August 31, 2010 experiment. The effect was first detected by the upper beam at 280–330 km, where the N e decrease accounted for ~25 % of the background value. Along the lower beam whose probe area is ~50 km southward, the effect was less pronounced and was observed with a ~10 min delay. The recovery process along the first beam lasted about half an hour.
As solar activity increased in 2010–2013, the mission control center (MCC) constantly raised the ISS orbit to prevent its braking in the expanding neutral atmosphere. In 2012, the height of the CS orbit was already 410 km, and, as already mentioned, the ensuing effect of AP expansion reduced effectiveness of the experiments. For most experiments performed over this period, we cannot (using statistical significance criteria) state that there was the effect of negative N e variations when CS engines were running.
In the above electron density variations, the maximum ionospheric response to exhaust products of the liquidfuel rocket engine always occurs below the CS orbit, even with the exhaust jet directed horizontally. This effect can be caused by two mechanisms. The former is natural downward diffusion of heavier water and carbon dioxide molecules during which diffusion separation of these impurities should also take place. The latter, most likely the major, mechanism is a downward flux of plasmaspheric ions, which is responsible for the formation of the nighttime ionosphere. In fact, the injection region cuts off the steady-state plasmaspheric ion flux, the underlying ions go down and recombine in the lower ionosphere, being replaced by a region of lower density. The lower boundary of the ionospheric “hole” depends on the height at which the ion-neutral collisions break the ion “freezing-in” into the geomagnetic field, and the “hole” is filled from neighboring horizontal regions.
Up to now, we have considered the power profile measurement mode used to determine the electron density from the Faraday effect. In experiments carried out under the Radar-Progress program, the second spectral measurement channel was often employed for studies relying on new methods, but the first experiments employed the mode of standard spectral measurements by the IS method. In these measurements, the scattering power was significantly higher due to the use of a long rectangular pulse of ~750 µs providing the necessary frequency resolution. However, it is more difficult to resolve the SE effects in height in this mode because the probe pulse occupies ~ 110
km in the radar range. In this case, exhaust products should fill not only the horizontal AP cross-section, but the entire height range of ~110 km, which forms the IS signal.
To demonstrate the ionospheric variations which can be recorded in the spectral measurement channel, let us consider the September 19 and 21, 2007 experiments in which the effect of ionization “hole” formation was definitely observed in the Faraday rotation measurement channel. It should be noted that IS signals are recorded in the power profile and spectral measurement channels at different frequencies and on the principle of frequency scanning, used by the IISR; AP beams in the two modes are spatially separated by several degrees (see Figure 1). For this reason, the effect can be observed in one channel and cannot be observed in the other.
Figure 5 shows the dynamics of ionospheric variations in the September 19, 2007 experiment. From top to bottom are variations of the electron density, electron temperature, ion temperature, and the percentage ratio of ions in plasma.
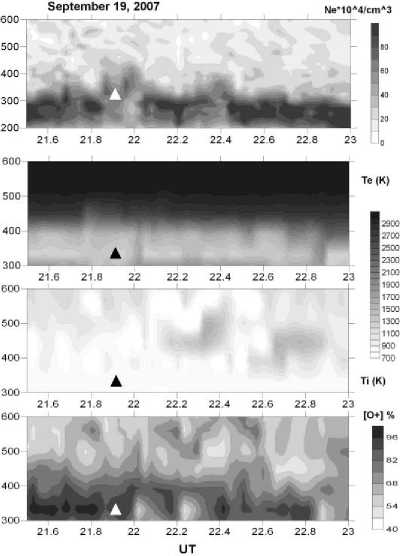
Figure 5 . From top to bottom: variations in the electron density, electron temperature, ion temperature, and ion composition in the September 19, 2007 experiment
At the heights considered, plasma consists only of atomic oxygen and atomic hydrogen ions; shades of gray in Figure 5 indicate the percentage ratio of ions [O + ] to the total ion density. The ionization trough at 300–350 km is well-defined in N e variations, but it is questionable whether there are variations in variations of other parameters. In temperature variations of electrons ( T e) and ions ( T i), the effect might have included a slight, nearly simultaneous increase at 300–400 km after 22 UT. In [O + ] density variations, a small decrease at 500–550 km can be attributed to the time interval under study. This corresponds to the mechanism of H+ ion inflow from the plasmasphere, i.e. even if there are effects in the data on T e and T i , they are insignificant compared to the effect of N e variation.
The ionospheric response of another type is depicted in Figure 6 for the September 21, 2007 experiment. In this experiment, during formation of the ionization trough, variations also occurred in incoherent scatter spectra. In this experiment, a few minutes after the liquid-fuel rocket engine start, first a small decrease in T i showed up at 450–550 km, and then positive variations arose in T i and T e at 400–500 km, which might have been caused by the inflow of warmer hydrogen plasma from the plasmasphere. The most interesting reaction in this experiment was observed in variations of the partial [O+] composition, when for half an hour the region of higher H+ content had been lowering to ~350 km.
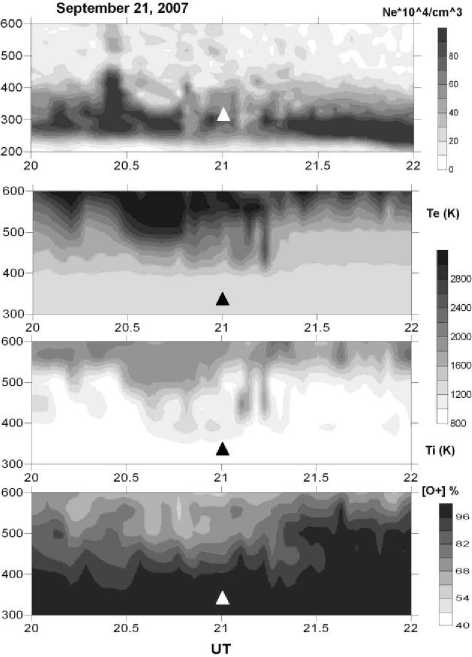
Figure 6. From top to bottom: variations in the electron density, electron temperature, ion temperature, and ion composition in the September 21, 2007 experiment
This effect well exhibits the above-described mechanism for filling ionization “holes” with hydrogen ions from the plasmasphere followed by charge transfer due to the resonant charge exchange reaction O+H+→O++H. Since the rate of the reaction is low, the proton flux from the outer ionosphere, which fills the ionospheric “hole”, creates a region with a high percentage of H+ ions at heights of maximum ionization. This region exists much longer than the ionization “hole”.
A similar effect was also observed in the September 2008 experiment, when two spaced AP beams were used for detecting signals. Figure 7 shows variations of the electron density and ion composition during the September 09, 2008 experiment. Triangles on the plots mark the height and time of CS engine start. In the experiments, two slightly spaced AP beams were formed, higher frequency corresponding to larger southward tilt of AP to the south (the lower beam). Relative variations of ionospheric parameters along the two beams provide insight into the spatial distribution of the irregularity region. The electron density variations in the figures are sporadic due to the low sig-123
nal/noise ratio; therefore it is rather difficult to draw an unambiguous conclusion about the degree of N e reduction in this experiment. However, due to the much greater power emitted by the long pulse in the spectral measurement channel, ion composition variations allow us to observe the pronounced region of H+ density increased by 20–25 %, which is located above the zone of injection of exhaust products, and then goes down, i.e. this is the same effect as in Figure 5, but ion composition variations are more evident here, and the effect can be seen for over half an hour.
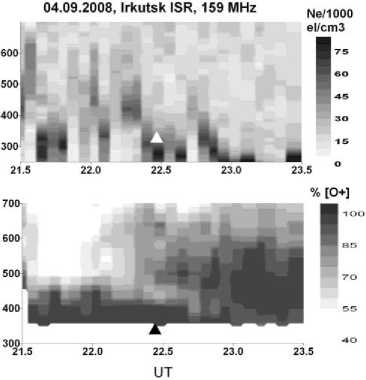
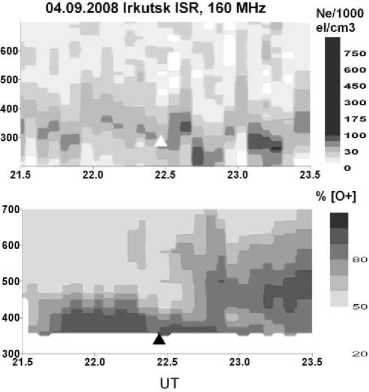
Figure 7 . Ion composition variations after CS passage: a is the upper beam; b is the lower beam. The region of high H+ content has been lowering for half an hour
In this experiment, the exhaust jet from CS engines is northward, but a more pronounced response is observed along the south beam. This effect occurs probably due to the prevailing meridional wind, which normally blows south at middle latitudes at night. The speed of the prevailing meridional wind at middle latitudes at night can be 30–50 m/s [Kazimirovsky et al., 1988; Vergasova, Kazimirovsky, 1994]. Thus, in spite of the northward exhaust jet, the injection-driven region of irregularities drifts south and the largest decrease in O+ density is observed along the south beam, accounting for ~40 % at some moments of time. The ion composition variations in Figure 7 allow us to estimate that the region of higher H+ density shifts downward at a velocity of ~35 m/sec (~100 km for ~45 min). What is surprising compared to the results obtained in previous experiments and in [Bernhardt et al., 1998, 2001] is the long lifetime of ion composition irregularities. This is most likely due to the hydrogen ion freezing-in into the geomagnetic field, which makes them remain within the IISR AP for a long time. In the series of experiments in 2008, a similar effect was observed on September 06, 2008, when the liquid-fuel rocket engine also worked northward, but in the degree of the ionosphere response to this injection, this effect appeared to be much weaker. It should be noted that the effect of existence of a region with high hydrogen ion content can be realized only in conditions of low solar activity when the boundary of [O+]/[H+] transition at nighttime goes down to 500–600 km. In the daytime ionosphere and during high solar activity, the ionization “hole” is filled with oxygen ions, which make up the ionosphere up to the height of 1000 km and more, so it is impossible to distinguish basic ions from inflowing ones.
CONCLUSION
This work was aimed at systematizing the results of ionospheric research obtained in experiments carried out under the Radar-Progress program. It was important to determine typical ionospheric effects caused by exhaust jets from the liquid-fuel rocket engine and reasons for the low percentage of successful experiments. To sum up the studies of artificial ionospheric disturbances, we can point out the following basic features of the experiments.
-
1. With the current antenna pattern of the IISR, quite a serious problem in conducting active experiments is the compliance of parameters of the CS orbit and trajectory of exhaust products from rocket engines with the geometry of AP-defined sounding region. This problem has several undetermined parameters:
-
a) shape of CS exhaust jet and velocity of its propagation;
-
b) percentage of exhaust particles which turn into water and dry ice and are not involved in the reaction with atomic oxygen ions of the ionosphere;
-
c) degree of overlap of the IISR’s antenna pattern cross-section with exhaust products, which largely determines the presence of the response in IS measurements;
-
d) value of the neutral thermospheric wind in the exhaust region, which blows the exhaust jet off the IISR AP.
-
2. Insufficient potential capacity of the IISR (power, pulse repetition frequency) for measuring IS signals by two beams with 1–3 min temporal resolution, which is required to carry out research of this type.
-
3. The large height of the CS orbit in the experiments after 2009, which greatly reduced the degree of AP filling and the signal/noise ratio in the experiment.
Despite these problems in implementing the active SE, the experiments confirmed that the local ionization “hole” can be formed, its characteristics are consistent with the results of previous studies [Bernhardt et al., 1998, 2001]. The size of the ionization trough is ~100 km in vertical along geomagnetic field lines, and the lifetime of the ionization “hole” is 10–20 min.
By contrast to the previous results of ionospheric research under the Radar-Progress program, which have been reported in [Khakhinov et al., 2012, 2013], in this paper we have first examined observations of plasma temperature variations, as well as an interesting and little-studied effect of formation of the region with high H+ content in place of the ionization “hole”. The resulting irregularity of ion composition has a much longer lifetime than the ionization
“hole” (over half an hour). This can be used for modeling to estimate rates of chemical reactions occurring at different ionospheric heights.
Although the main purpose of the Radar-Progress experiment was to study characteristics of radar signals from CS, its part that involves investigating ionosphere responses also has a certain scientific value and is practically important for understanding the physical phenomena and for planning future active experiments.
The study was carried out at the unique scientific facility Irkutsk incoherent scatter radar (reg. No. 01-28) under the project II.16.1.2 of the Fundamental Research Program of the Russian Academy of Sciences, and supported by the RFBR grant No. 15-05-05387 and RF President Grant of Public Support for RF Leading Scientific Schools No. NSh-6894.2016.5.
Список литературы Исследование реакции ионосферы на продукты горения топлива при работе двигателей транспортных грузовых кораблей серии «Прогресс» по данным иркутского радара некогерентного рассеяния
- Вергасова Г.В., Казимировский Э.С. Крупномасштабные вариации преобладающего ветра в нижней термосфере//Изв. АН. Сер. ФАО. 1994. Т. 30, № 1. С. 31-38.
- Жеребцов Г.А., Заворин А.В., Медведев А.В. и др. Иркутский радар некогерентного рассеяния//Радиотехника и электроника. 2002. Т. 47, № 11. С. 1339-1345.
- Кринберг И.А., Тащилин А.В. Ионосфера и плазмосфера. М.: Наука, 1984. 187 c.
- Лебедев В.П., Хахинов В.В., Габдуллин Ф.Ф. и др. Исследование методами радиозондирования характеристик плазменного окружения низкоорбитальных космических аппаратов//Космонавтика и ракетостроение. 2008. № 1 (50). С. 51-60.
- Медведев А.В., Заворин А.В., Кушнарев Д.С., Шпынев Б.Г. Модернизация аппаратно-программного комплекса Иркутского радара НР. Основные элементы новой многоканальной системы регистрации//Солнечно-земная физика. 2004. Вып. 5. С. 107-110.
- Платов Ю.В., Семенов А.И., Филиппов Б.П. Сублимация ледяных частиц в условиях верхней атмосферы//Геомагнетизм и аэрономия. 2004. Т. 44, № 3. С. 419-423.
- Платов Ю.В., Семенов А.И., Филиппов Б.П. Сублимация твердой углекислоты в условиях верхней атмосферы//Геомагнетизм и аэрономия. 2005. T. 45, № 3. C. 416-420.
- Хахинов В.В., Потехин А.П., Лебедев В.П. и др. Радиофизические методы диагностики ионосферных возмущений, генерируемых бортовыми двигателями ТГК «Прогресс»: алгоритмы, инструменты и результаты//Росс. науч. конф. «Зондирование земных покровов радарами с синтезированной апертурой». 06-10.09.2010, Улан-Удэ: сб. докладов. 2010. С. 553-569. URL: http://jre.cplire.ru/jre/library/Ulan-Ude-2010/pdffiles/s2_35.pdf (дата обращения 17 ноября 2016 г.).
- Хахинов В.В., Потехин А.П., Лебедев В.П. и др. Результаты дистанционного зондирования ионосферных возмущений в активных космических экспериментах «Радар-Прогресс»//Современные проблемы дистанционного зондирования Земли из космоса. 2012. Т. 9, № 3. С. 199-208.
- Хахинов В.В., Потехин А.П., Лебедев В.П. и др. Некоторые результаты активных космических экспериментов «Плазма-Прогресс» и «Радар-Прогресс»//Вестник Сибирского государственного аэрокосмического университета им. М.Ф. Решетнева. 2013. Спец. вып. 5 (51). С. 160-163.
- Bernhardt P.T., Huba J.D., Swartz W.E., Kelly M.C. Incoherent scatter from space shuttle and rocket engine plumps in the ionosphere//J. Geophys. Res. 1998. V. 103, N A2. P. 2239-2251.
- Bernhardt P.T., Huba J.D., Kudeki E., et al. Lifetime of a depression in the plasma density over Jicamarca produced by space shuttle exhaust in the ionosphere//Radio Sci. 2001. V. 36, N 5. P. 1209-1220.
- Kazimirovsky E.S., Manson A.H., Meek C.E. Winds and waves in the middle atmosphere//J. Atmos. Terr. Phys. 1988. V. 50, N 3. P. 243-250.
- Khakhinov V.V., Shpynev B.G., Lebedev V.P., et al. Radio-sounding of ionospheric disturbances generated by exhaust streams of the transport spacecraft "Progress" engines//The 32nd Progress in Electromagnetics Research Symposium. The Electromagnetics Academy, 2012. P. 1168-1171.
- Potekhin A.P., Khakhinov V.V., Medvedev A.V., et al. Active space experiments with the use of the transport spacecraft "Progress" and Irkutsk IS Radar//The 26nd Progress in Electromagnetics Research Symposium. 2009. P. 223-227.
- Shpynev B.G. Incoherent scatter Faraday rotation measurements on a radar with single linear polarization//Radio Sci. 2004. V. 39, N 3. RS3001 DOI: 10.1029/2001RS002523
- Wu B.J.C. Possible water vapor condensation in rocket exhaust plume//American Institute of Aeronautics and Astronautics J. 1975. V. 13, N 6. P. 797-802.
