
Извлечение характеристик симметрии мозга для автоматического выявления опухолей головного мозга на МРТ-изображениях
Журнал: Программные системы: теория и приложения @programmnye-sistemy
Рубрика: Медицинская информатика
Статья в выпуске: 2 (71) т.17, 2026 года.
Бесплатный доступ
В данном исследовании представлена автоматизированная и объясняемая система поддержки принятия решений для анализа медицинских изображений. Предлагаемый метод выявляет главную ось симметрии на изображениях МРТ головного мозга в оттенках серого, полученных с помощью метода FLAIR, путем выбора возможных осей вблизи центра масс мозга и оптимизации коэффициентов сходства Жаккара и косинуса. Затем изображения бинаризуются с помощью кластеризации FCM. Двусторонняя асимметрия количественно оценивается с помощью пяти взаимодополняющих метрик: метрики асимметрии Дайса и дисбаланса массы на бинарных изображениях, градиентной асимметрии, асимметрии интенсивности и структурной асимметрии (инвертированный SSIM) на изображениях в оттенках серого. Эти признаки классифицируются моделью CatBoost на онкологические и нормальные случаи, достигая площади под характеристической кривой (ROC-AUC) 89%, точности 80%, чувствительности 88% и F1-показателя 80%.
Короткий адрес: https://sciup.org/143186017
IDS: 143186017 | УДК: 004.932.72+004.832+616-073.75 | DOI: 10.25209/2079-3316-2026-17-2-295-326
Extraction of symmetrical brain characteristics for the automated detection of brain tumors in MRI images
This study presents an automated and explainable decision-support framework for medical image analysis. The proposed method detects the principal symmetry axis in grayscale FLAIR brain MRI images, using candidate axes near the brain's center of mass and optimizing Jaccard and cosine similarity. Images are then binarized via FCM clustering. Bilateral asymmetry is quantified through five complementary metrics: Dice asymmetry metric and mass imbalance on binary images, and gradient asymmetry, intensity asymmetry, and structural asymmetry (inverted SSIM) on grayscale images. These features are classified by a CatBoost model into cancerous and non-cancerous cases, achieving 89% ROC-AUC, 80% accuracy, 88% sensitivity, and an F1-score of 80%.
Текст научной статьи Извлечение характеристик симметрии мозга для автоматического выявления опухолей головного мозга на МРТ-изображениях
Contemporary healthcare relies heavily on medical imaging to successfully diagnose, track, and manage disease progression. Techniques such as computed tomography (CT), magnetic resonance imaging (MRI), ultrasound, and X-ray radiography constitute the core of this diagnostic toolkit. Fundamentally, these technologies allow practitioners to peer into the human body without resorting to invasive surgical procedures, thereby accelerating accurate diagnoses and therapeutic interventions. Functioning as a computational diagnostic framework, medical imaging facilitates the identification and quantification of subclinical abnormalities, supporting timely intervention and refined prognostic stratificatio n 1 .
Despite immense leaps in both diagnostics and oncology, cancer persistently ranks among the highest causes of death worldwide [1 , 2] . To combat this, computational decision-support architectures have been deployed across domains such as medical statistics analysis, genomics [3] , medical image analysis [4] . Nevertheless, an ongoing demand exists for analytical models that are not only accurate but also interpretable.
Within neuroimaging, anatomical symmetry operates as a highly informative biomarker; an absence or disruption of this balance frequently points toward an underlying pathological condition [5 -7] . This principle governs paired anatomical features like breasts or kidneys, as well as inherently symmetrical singular structures like the human face and brain. A substantial body of historical research confirms that symmetry-oriented metrics hold immense diagnostic value [6 -9] . Nevertheless, this field requires methodological innovation to improve early detection capabilities and ensure the transparency of the resulting models.
Expanding upon our earlier investigations [10] , the present study adapts the angled-line technique to neuroimaging, facilitating the extraction of cerebral symmetry markers to identify malignant growths. We introduce a completely autonomous framework for brain tumor identification driven by multimodal MRI symmetry evaluation. Because the pipeline is fully automated, it eliminates the need for manual parameter tuning by the end user. The angled-line method is centrally deployed to calculate the pivotal axis of symmetry, a prerequisite for assessing bilateral morphological traits.
A primary contribution of this research lies in highlighting the predictive strength of mass imbalance alongside intensity asymmetry coefficients drawn from MRI data, effectively proving that cerebral asymmetry is a potent hallmark of brain tumors. Ultimately, this methodology is positioned as a viable computer-aided diagnostic tool to assist medical professionals. The core innovation rests in delivering a sequential, end-to-end medical decision support pipeline specifically engineered to isolate tumor-bearing MRI scans.
2. Methods and Materials
The dataset was obtained from Kaggle [11] and comprises brain MRI images from 110 patients (cases) along with manually created fluid-attenuated inversion recovery (FLAIR) abnormality masks. A total of 1300 FLAIR sequences were utilized in this research, with 845 (65%) categorized as non-cancerous and 455 (35%) identified as containing tumors. Each image measures 256 x 256 x 3.
Similar to the automated path line extraction used in aortic modeling [12] , our method utilizes the angled line equation to establish a symmetry axis and extract image-based morphometry. The symmetry axis is estimated on the grayscale version of the FLAIR images using the angled-line formulation [10] . Converting the image to gray usually reduce the processing time.
Each line represents a possible candidate for the line of symmetry. Typically, the line of symmetry of the brain is situated near its center of mass. Consequently, the search for this line was confined to the area adjacent to the center [13] . The optimal symmetry line is determined by selecting the line that exhibits the highest Jaccard and Cosine index values. The gray image undergoes binarization using the Fuzzy C-Means (FCM) Clustering Method [14] .
FCM is an unsupervised clustering technique commonly employed in medical image segmentation. It groups similar pixels into clusters based on their fuzzy memberships through the Fuzzy C-Means clustering approach [14] . This iterative algorithm aims to minimize a cost function, as defined in Equation (1) . The cost function is contingent upon the distance of the pixels from the cluster centers.
Nc
J = EE u m I ' . - v - i ! , j=1i=1
where N , denotes the number of pixels, c, denotes the number of clusters, and x j denotes the intensity of the jth pixel.
In this research, the number of clusters, c, is set to 3, where u ij indicates the membership of x j in the ith cluster, v i signifies the center of the ith cluster, and m regulates the fuzziness, maintaining a constant value. The membership function and cluster centers are updated at each iteration using the formulas presented in equations (2) and (3) :
u ij =
£ ( k=1 v
∥ x j - v i ∥ ∥ x j - v k ∥
\ m — 1
N
£ u m x j j=1
.
v = ------- vi N
£ u ”
j=1
The Dice metric in this study quantifies the spatial concordance between one cerebral hemisphere and its mirrored counterpart. Prior work [15 -17] indicates that tumor growth not only alters local intensity patterns but also induces anatomical displacement of adjacent structures, making reduced interhemispheric overlap a salient marker of a space-occupying lesion. Accordingly, a low Dice value reflects poor bilateral correspondence and suggests increased asymmetry, whereas higher values indicate stronger structural symmetry in the analyzed MRI volume.
Importantly, the Dice metric is shape-based rather than intensitybased: it evaluates the binary foreground support of each hemisphere without considering pixel brightness. As a result, it is less sensitive to scanner-dependent bias fields, illumination inhomogeneity, and other acquisition artifacts that can confound intensity-driven measures and generate false positives [16 , 17] . This makes the Dice index particularly suitable for symmetry analysis in brain MRI, where geometric alignment is often more informative than raw signal magnitude. The Dice index is computed according to the following equation
Dice =
2 | A П B | ЖЖ,
where A and B denote the binary masks corresponding to the left hemisphere and the vertically reflected right hemisphere, respectively. The numerator measures the number of overlapping foreground pixels, while the denominator normalizes this overlap by the total foreground support in both masks.
We reverse this metric, which aligns with our Dice asymmetry (DS) metric
DS =1 - Dice.
Normal brain hemispheres exhibit nearly identical mass. In this context, this mass is represented by the foreground pixels present in the binary image. The aforementioned mass asymmetry formula serves to differentiate between space-occupying mass in both hemispheres [18] . The mass imbalance (MI) index is calculated using
MI =
| A ′ - B ′ | A ’ + B' ,
where A ′ and B ′ represent the total intensity mass in the left image half and the flipped right image half, respectively. If the overall «mass» (sum of pixels) of the foreground pixels in one hemisphere significantly exceeds the corresponding sum in the opposite hemisphere, it is identified as a potential lesion rather than merely a natural variation. This measures global level asymmetry.
Gradient asymmetry (GA) focuses on identifying the edges and assessing their sharpness in various sections of the hemisphere, as well as examining how the detected edges and their sharpness vary between the two hemispheres. Structural sharpness is characterized by elevated Sobel gradient values. Tumors frequently exhibit heterogeneous textures instead of consistent brightness. Variations in gradients reflect the «edge contrast» of hyperintense areas, serving as a predictive marker for tumor invasion and patient survival rates [19] . The quantification of GA in grayscale images is performed using the equation:
N
-
(7) GA = N ^| G l (p) - G R ( p ) ,
p=i where Gl(p) and gR(p) denote the magnitude of the Sobel gradient at pixel p in the left half of the image and the mirrored right half, respectively. N represents the total number of pixels within the area of interest, while p indicates the pixel index.
The distribution of intensity levels in brain MRI can provide essential information regarding potential tumor areas. The variation in intensity across different brain regions is typically highlighted due to the edema induced by tumors surrounding the affected area. This edema appears as a high intensity level in the FLAIR modality, allowing for the clear identification of abnormal regions in FLAIR images [20] . In this research, this intensity asymmetry (IA) is quantified using:
N ⃓ ⃓
IA = N E| i l (p) - i R (p)|, p =1
where, Il ( p ) and i R ( p ) denote the intensity of the pixel located at position p in the left half of the image and the corresponding flipped right half, respectively. This method enables the examination of the intensity patterns between the hemispheres, in addition to identifying misaligned features at the pixel level.
The Structural Similarity Index (SSIM) is a perceptually motivated image-quality measure that is used to quantify structural degradation between two images [21] . In this study, SSIM is computed between the left hemisphere and its mirrored counterpart by decomposing similarity into three complementary components: luminance, which evaluates differences in mean intensity; contrast, which assesses the dispersion of signal values; and structure, which captures local spatial organization and texture consistency. This decomposition makes SSIM particularly suitable for symmetry-based analysis in brain MRI, where pathology may manifest not only as intensity variation but also as subtle alterations in tissue arrangement [22] .
Recent studies [23, 24] have highlighted SSIM as a robust descriptor for evaluating the fidelity and diagnostic relevance of automated medical-image analysis frameworks. In particular, SSIM is well suited to distinguishing between mass-effect lesions, which primarily induce anatomical displacement, and infiltrative lesions, which may produce more localized radiometric and textural abnormalities. For infiltrative tumors in FLAIR images, SSIM can detect fine-grained structural perturbations that may not be captured by intensity-based metrics alone. This makes it a valuable complement to geometric and photometric asymmetry measures in tumor characterization. In the present work, SSIM is defined as
(2 P x P y + C1)(2g xy + C2)
SSIM(X, y ) / 2 i 2 i W 2 i 2i/^V
( м Х + м У + С1ЖХ + ^ y + C2)
where x and y denote the left and right-flipped image halves, respectively. The terms µ x and µ y represent the mean intensities of x and y , while σ x 2 and σ y 2 denote their variances. The covariance between the two regions is given by σ xy . The constants C 1 and C 2 are included to ensure numerical stability and prevent singularities when local statistics approach zero. Together, these terms provide a normalized estimate of structural correspondence that is highly informative for bilateral symmetry assessment in medical imaging.
A higher value of SSIM index indicate a greater similarity between the compared hemispheres. However, to ensure consistency with direct asymmetry-based metrics (GA, IA, MI) we invert this metric which corresponds to our structural asymmetry (SA) metric:
-
(10) SA = 1 - SSIM.
For each image, the gray and binarized versions are divided into two halves along the symmetry line. The resulting images are designated as Left and Right, corresponding to the left and right halves, respectively. The right half is mirrored along the vertical axis and labeled as Right-flipped. This process allows for the alignment of similar structural regions of the brain in the same orientation.
Subsequently, various metrics are computed between the Left and Right-flipped halves. The asymmetry of the brain image is quantified using five complementary metrics:
Dice asymmetry (DS), mass imbalance (MI) for the binary mage, gradient asymmetry (GA), intensity asymmetry (IA), and structural asymmetry (SA) for the gray image.
These metrics collectively capture geometric, textural, and intensity-based deviations from bilateral symmetry. Using the CatBoost algorithm [25] , MRI images were classified as either cancerous or non-cancerous based on the extracted metric values. The dataset, comprising 1,300 MRI images, was partitioned into training and validation subsets using stratified sampling: 80% of the data (1,040) was allocated for training, while the remaining 20% (260) was reserved for validation.
To enhance model robustness and mitigate overfitting, K-fold crossvalidation was employed during the training phase. Since the raw
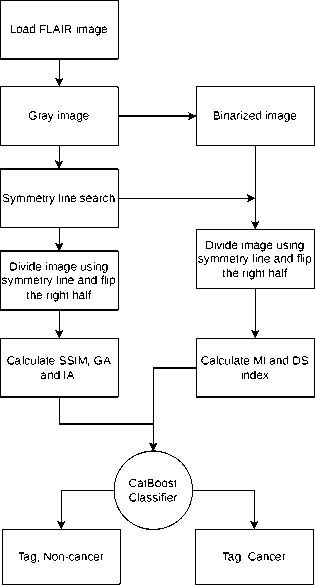
Figure 1. Algorithm chart probability outputs generated by CatBoost may not accurately reflect true posterior confidence, a calibration step was incorporated to improve probabilistic reliability. Sigmoid (Platt scaling) calibration was applied to map the predicted scores to calibrated probability estimates. Additionally, a fixed random seed was specified to ensure reproducibility and stability of the results.
The chart of the algorithm utilized in this research is illustrated in Figure 1
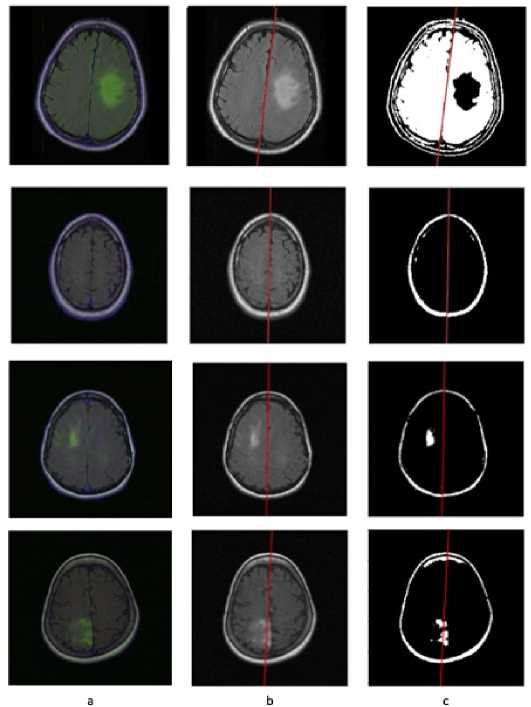
Figure 2. Symmetry line search:(a) FLAIR MRI, (b) Gray image with symmetry line, (c) Binary image with symmetry line
3. Results
The suggested methodology was implemented on the brain FLAIR images obtained from the dataset. The ground truth for every image is located within the dataset tasks, corresponding to the manually generated mask for each image created by an expert. Figure 2 illustrates an example of the original image, its grayscale version, and the binarized version.
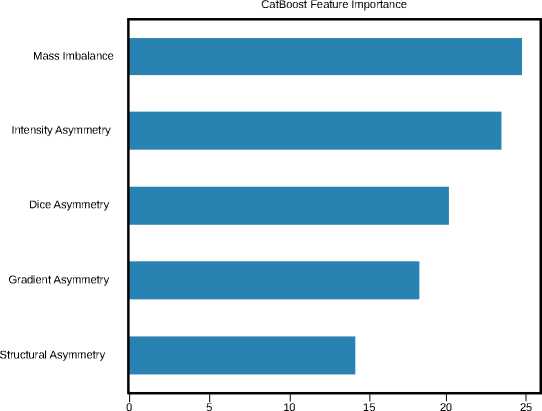
Figure 3. Feature importance graph
Performance evaluation examined sensitivity, accuracy, and specificity.
It was noted that the mass imbalance (MI) metric had a more significant influence on the classification algorithm. Figure 2 shows the original FLAIR image, which was converted to gray and used to find the best symmetry line. The binary image was obtained via the FCM method and the previously determined symmetry line applied.
Using the CatBoost algorithm [25] , the classification was performed on the basis of the extracted features. As illustrated in Figure 3 , the feature-importance analysis identified mass imbalance (MI) as the most influential variable, followed by intensity asymmetry (IA), whereas structural asymmetry (SA) exhibited the lowest contribution.
This pattern indicates that features derived from binary representations captured interhemispheric differences more effectively than the grayscale-derived feature. In particular, the mass imbalance, computed from binary images, demonstrated greater discriminative utility than structural asymmetry, which was derived from grayscale images.
4. Discussions
The proposed symmetry-axis detection pipeline demonstrated high anatomical fidelity across the FLAIR MRI dataset. By restricting candidate lines to the vicinity of the brain’s center of mass and jointly optimizing Jaccard and cosine similarity indexes, the algorithm consistently identified midline structures with sub-pixel precision.
This geometric consistency underscores the robustness of the angled-line formulation in handling inter-subject variability in head orientation and mild pathological midline shifts. The stability of the computed symmetry axis serves as a reliable foundation for subsequent bilateral feature extraction, effectively mitigating alignment-induced noise that often compromises conventional registration-based approaches.
Feature-importance analysis revealed that mass imbalance (MI) was the most discriminative predictor, achieving 70% classification accuracy when used in isolation. This aligns with the clinical observation that space-occupying lesions predominantly manifest as volumetric mass effects, which are efficiently captured after FCM-based binarization isolates foreground tissue from background and non-brain structures.
Intensity asymmetry (IA) emerged as the secondary contributor, reflecting FLAIR-specific hyperintensities associated with peritumoral edema and infiltrative tumor margins. Conversely, gradient asymmetry (GA) and structural asymmetry (SA) exhibited lower predictive weight, likely because FLAIR sequences prioritize fluid-suppressed intensity contrast over fine textural or edge-based differentiation.
The reduced utility of grayscale-derived metrics in this context suggests that binary morphometric features may be more robust for symmetry-based tumor screening in FLAIR modalities, though multimodal fusion (e.g., T1, T2, or contrast-enhanced sequences) could restore the diagnostic value of structural and gradient descriptors.
When integrated into the CatBoost ensemble, the five asymmetry metrics produced an ROC-AUC of 89%, along with 80% accuracy, 88% sensitivity, and an F1-score of 80%. CatBoost was deliberately chosen for its resilience to heterogeneous tabular data, its automatic management of feature interactions, and its ability to prevent overfitting in moderately sized datasets.
In addition to its predictive capabilities, the framework emphasizes clinical interpretability: each asymmetry metric is linked to a specific biophysical property (volumetric displacement, intensity deviation, edge contrast, and structural coherence), allowing clinicians to connect classification outcomes to measurable imaging biomarkers. This level of transparency mitigates a significant challenge in AI-assisted diagnostics, where opaque models frequently lack actionable clinical justification and endorsement by medical experts.
Several limitations merit attention.
1. The research is based solely on a publicly accessible FLAIR dataset, which might not encompass the complete variability of clinical MRI protocols, different scanner manufacturers, or varying magnetic field strengths.
2. Although the FCM binarization process is computationally efficient, it is susceptible to intensity inhomogeneities and may necessitate adaptive bias-field correction or atlas-guided initialization for more extensive application.
3. Non-neoplastic conditions (such as ischemic stroke, traumatic injury, or congenital asymmetries) may also interfere with bilateral symmetry, potentially leading to false positives in actual clinical screenings.
5. Conclusions
Future iterations will integrate multi-modal MRI inputs, and validate the pipeline using multi-center cohorts. From a systems perspective, the lightweight computational footprint of the proposed pipeline makes it ideally suited for edge deployment in resource-limited clinical settings or as a triage component within larger medical decision-making workflows.
Ultimately, by combining mathematically grounded symmetry metrics with an interpretable gradient-boosting classifier, this research propels the advancement of transparent, theory-driven decision-support systems for neuro-oncological imaging and enhances data processing speed.
This study presents a fully automated, theory-driven framework for detecting brain tumors in FLAIR MRI by quantifying bilateral asymmetry.
By leveraging an optimized angled-line formulation constrained to the brain’s center of mass and validated through Jaccard and Cosine similarity metrics, the pipeline reliably localizes the anatomical midline without iterative registration or manual initialization.
This geometric foundation enables the systematic extraction of five complementary asymmetry descriptors, capturing volumetric, intensity, gradient, and structural deviations between hemispheres. Integration of these metrics into a CatBoost classifier yields robust diagnostic performance (ROC-AUC 89%, accuracy 80%, sensitivity 88%, F1-score 80%), confirming that symmetry degradation is a highly discriminative biomarker for space-occupying lesions.
In addition, the primary clinical significance of the framework is its built-in interpretability. Unlike the opaque nature of deep learning models, each input feature is directly linked to a measurable biophysical characteristic (such as mass displacement, intensity heterogeneity, edge contrast, and structural coherence). This level of transparency empowers radiologists and neuro-oncologists to connect classification results to specific morphometric variations, thereby enhancing clinical trust and promoting regulatory acceptance.
From a methodological perspective, the streamlined design of the pipeline avoids the need for computationally demanding voxel-wise segmentation or complex convolutional architectures, which greatly decreases data processing time and inference latency. Furthermore, the lack of necessity for manual parameter adjustments, along with the lightweight tabular format of CatBoost, allows for swift, slice-level screening that can function effectively on standard clinical equipment.
Ultimately, this system is designed to enhance clinical workflows rather than replace expert judgment. By delivering fast, explainable, and mathematically grounded assessments, it empowers medical teams to prioritize high-risk cases, reduce diagnostic fatigue, and make more informed, evidence-based decisions—particularly in high-volume or resource-constrained settings.
Future work will focus on extending the evaluation using larger and more diverse datasets to further validate the robustness and generalizability of the approach. Moreover, performance improvements are anticipated through the extraction of features not only at the global image level but also at finer sub-regional scales, enabling more localized characterization of tumor patterns. Through its balance of computational efficiency, algorithmic transparency, and clinical utility, the proposed framework advances the development of practical decision-support systems for neuro-oncological imaging.
