Kinetic photometric determination of oxalate by its activation effect on catalytic oxidation of iodide and formation of iodine-starch complex

Author: Danilina E.I., Khaybullina O.A.
Journal: Вестник Южно-Уральского государственного университета. Серия: Химия @vestnik-susu-chemistry
Section: Физическая химия
Article in issue: 3 т.13, 2021.
Free access
A method for the kinetic photometric determination of oxalate ion in aqueous solutions, including extracts from foodstuffs, has been suggested. The initial rate method has been used: the straight parts of kinetic curves (approximately 5 min) are processed by the least square method to get the slope coefficients used as analytical signals. The procedure is based upon the oxalate ion action as an activator in the iron(II)-catalyzed reaction of iodide oxidation by potassium bromate. Unlike the previously used light absorbance in the UV region, the suggested procedure controls the rate of the iodine-starch complex formation at 590 nm. The greatest initial rate for the reaction is at pH 5.05 of the acetate buffer solution and the optimal concentration of soluble starch 0.30 mg/mL. The calibration graph is linear in the oxalate concentration range (0.1-10) mg/mL. In this interval precision error varies between 0.67 % and 4.71 %, accuracy error is within (0.22-9.30) %. The procedure has been applied to food analysis by the standard addition method. Aqueous extract has been obtained from 2.5 g of finely chopped sample of raw beet, stirred with 100 mL of water for 1 h, centrifuged, filtered, and quantitatively transferred to 250-mL volumetric flask. Determination of oxalate in 1-mL aliquot has required the same volume of colored beet extract for a reference solution, but otherwise the procedure stands valid. The oxalate content has been found to equal (379 ± 2) mg/g of the raw beet (P = 0,95; n = 4), with 0.6 % precision error and 3.0 % accuracy error.
Oxalate ion, kinetic analysis, initial rate method, bromate ion, iron(ii), iodine, soluble starch, food analysis
Short address: https://sciup.org/147235337
IDR: 147235337 | UDC: 544.473 | DOI: 10.14529/chem210307
Кинетическое фотометрическое определение оксалата по его активации каталитического окисления иодида и образованию иод-крахмального комплекса
Предложен метод кинетико-фотометрического определения оксалат-иона в водных растворах, включая вытяжки из пищевых продуктов. Использовали метод тангенсов: прямолинейные участки кинетических кривых (приблизительно 5 мин) обрабатываются методом наименьших квадратов для получения угловых коэффициентов в качестве аналитического сигнала. Методика основана на действии оксалат-иона как активатора на катализ железом(II) реакции окисления иодид-иона броматом калия. В отличие от ранее использованного светопоглощения в УФ области, в предлагаемой методике контролируется скорость образования комплекса иода с растворимым крахмалом при 590 нм. Наибольшая начальная скорость реакции наблюдается при рН 5,05 ацетатного буферного раствора и оптимальной концентрации растворимого крахмала 0,30 мг/мл. Градуировочный график линеен в интервале концентраций оксалата (0,1-10) мг/мл. В этом интервале погрешность воспроизводимости колеблется между 0,67 % и 4,71 %, погрешность правильности определения в пределах (0,22-9,30) %. Методика была применена к пищевому анализу методом добавок. Водную вытяжку для анализа получали из мелко порезанного образца сырой свеклы массой 2,5 г, после встряхивания со 100 мл воды в течение 1 часа, центрифугирования, фильтрования и количественного переведения в мерную колбу вместимостью 250 мл. Для определения оксалата в аликвоте раствора объемом 1 мл потребовалась вытяжка из свеклы того же объема в качестве раствора сравнения, но в остальном методика сохранялась. Содержание оксалата в образце было найдено равным (379 ± 2) мг/г сырой свеклы (P = 0,95; n = 4), с погрешностями сходимости 0,6 % и правильности 3,0 %.
Text of the scientific article Kinetic photometric determination of oxalate by its activation effect on catalytic oxidation of iodide and formation of iodine-starch complex
Oxalic acid is the most common low-molecular-weight organic acid produced by living organisms. It is mainly found in the form of a crystal hydrate with two water molecules. In nature, it can occur in the free state, though more often it is in the form of its soluble salts, oxalates.
Oxalic acid is widely used in the production of dyes, inks, plastics, in chemical metallurgy (as a special component for cleaning metals from rust and oxides), in the textile industry (in the dyeing of silk and wool). In cosmetology it is used as a whitening component of creams. It is used to reduce the hardness of water and to remove impurities [1].
Oxalate ions are usually synthesized as a result of incomplete oxidation of carbohydrates, as well as during some biological and industrial processes. Oxalates are found in many plants, such as spinach, mushrooms, celery, rhubarb, beet, and others. Knowledge of the concentration of oxalate in biological fluids, such as blood and urine, can be useful in research, diagnosis, and medical care in the treatment of various diseases, including chronic renal failure, primary hyperoxaluria, intestinal malabsorption, nephrolithiasis, steatorrhea, and others [2–5]. On the other hand, the low solubility of some oxalates (for example, calcium oxalate) and their subsequent deposition on the surface of evaporation plants, reactors, pipelines, pumps can lead to serious operational problems [6]. In this regard, the precise determination of oxalate in various foodstuffs, biological and environmental matrices is of great interest.
The determination of oxalates in biological materials is usually performed by indirect colorimetry and by precipitation of calcium oxalate followed by weighing or titration. A huge number of articles related to the determination of calcium oxalate are freely available, for example, its determination in urine [7] and blood plasma [8]. In addition, oxalic acid was quantified by capillary gas chromatography in plant tissues. Oxalate has been detected and quantified in cucumber, rhubarb, and other plant objects [9]. In their turn, a group of researchers from the Siberian Federal University managed to develop a selective method for the quantitative determination of oxalic acid by ion chromatography with conductometric detection using surface-grafted ionite [10].
In 2011, the first ion-based low-pressure multistring ion chromatography method was introduced. It is based on the use of short surfactants coated with octadecyl-silica monolithic columns [11]. In addition, ion chromatography was used by researchers to determine oxalates in alcohol-containing beverages: tequila [12], beer [11]. Though in clinical analysis the most commonly used method is the high-performance liquid chromatography. A method for determining oxalate ions in urine is known, based on a combination of HPLC and mass spectrometry methods [13]. Besides, methods for the determination of oxalate ions include titrimetry [14], luminescent analysis [15–17], and spectrophotometry [18, 19], as well as capillary electrophoresis.
Among the methods used for analytical determination of the oxalate ion, kinetic methods stand out, in which a wide variety of chemical reactions, including slow ones, can be used [20–22]. These methods are characterized by a relatively small influence of the matrix compared to the measurement of the absorbance itself, as well as a generally negligible influence of concurrent processes. Another advantage is their high sensitivity, which allows determination of the trace amounts of the analyte. However, their disadvantage is the necessity to accurately reproduce the experimental conditions each time the analysis is performed, and sometimes the analytical signal is based on absorption in the UV region, which requires more expensive equipment and more careful compliance with the determination conditions.
There is a need in developing a simple, economical, reproducible, and accurate analytical method for the photometric, perhaps colorimetric, determination of oxalate ion, which would be applicable to food analysis. The present study deals with the kinetic photometric determination of oxalate, dependent on relative changes of absorbance, therefore not subjected to the influence of intensive coloration of some foodstuffs.
Experimental
Absorption measurements at fixed wavelength were performed using a KFK-2 photocolorimeter, the spectrum characteristics were obtained with an ECOVIEW B-1100 spectrophotometer. A pH-meter millivoltmeter «EXPERT-pH» and an ELMI CM-6M centrifuge were used in several experiments.
Reagents included the following:
A standard solution of oxalate ion 1000 µg/mL was prepared by dissolving 0.1422 g of ammonium oxalate monohydrate (NH 4 ) 2 C 2 O 4 ·H 2 O in distilled water and diluting it to the mark in a 100-mL volumetric flask. Working solutions were prepared by precise diluting in distilled water.
A solution of iodide ion 0.120 M was prepared by dissolving 2.0021 g of analytical grade reagent potassium iodide KI in distilled water and diluting it to the mark in a 100-mL volumetric flask.
A solution of iron(II) ion 1000 µg/mL was prepared by dissolving 0.7021 g of analytical grade reagent ammonium iron(II) sulfate hexahydrate in 0.10 M sulfuric acid and diluting it to the mark in a 100mL volumetric flask. Working solution of iron(II) ion 7 µg/mL was prepared by precise diluting in distilled water.
A standard solution of bromate ion 0.1000 M was prepared by dissolving 1.6700 g of analytical grade reagent potassium bromate KBrO 3 in 100 mL of distilled water.
A solution of starch 10.0 mg/mL was prepared by suspending 0.500 g of soluble starch in 10 mL of cold distilled water to get the starch paste. Then 40 mL of distilled water was brought to a slow boil and the starch paste was added to the boiling water and quickly stirred for 2 minutes. The solution should be colorless, it was checked visually and by measuring the absorbance of the prepared starch solution against water on a KFK-2 photocolorimeter.
Solutions of 1.0 and 0.50 M sulfuric acid were prepared by diluting concentrated sulfuric acid with distilled water.
A solution of 0.500 M sodium acetate was prepared by dissolving 6.8047 g of sodium acetate trihydrate in 100 mL of distilled water.
A 0.500 M acetic acid solution was prepared by diluting 2.86 mL of glacial acetic acid with distilled water in a 100 mL volumetric flask to the mark.
An acetate buffer solution (pH = 5.0) was prepared by mixing 70.5 mL of 0.500 M sodium acetate with 29.5 mL of 0.500 M acetic acid solution.
Buffer solutions were prepared by mixing various volumes of 0.500 M sodium acetate and 0.500 M acetic acid.
The procedure of oxalate determination was as following: 1.0 mL aliquot of a working oxalate solution with the suitable concentration (1–100 μg/mL) was transferred into a 10-mL graduated test tube. Then 2.0 mL of the acetate buffer solution (pH = 5.05) was added followed by 1.0 mL of a 7 µg/mL working solution of iron (II). Then 1.0 mL of 0.120 M iodide solution was added. The solution was diluted to 8.0 mL with distilled water. Then 1.0 mL of 3.0 mg/mL starch solution was added and mixed. The last stage consisted of adding 1.0 mL of 0.100 M potassium bromate solution. The stop clock was started just after the addition of the last drop of bromate solution and a portion of it was transferred into a 1-cm glass cuvette. The change of absorbance with time was measured against distilled water at wavelength 590 nm. The initial rate was calculated as follows: the linear part of a kinetic curve was identified (approximately 5 min), and the least square method was applied to experimental values in that range to get the slope coefficient (the tangent of the slope angle). For measurements of the blank experiments (in the absence of oxalate ion), the addition of a working solution of oxalate was excluded, otherwise the method adhered to the one described above.
To determine the content of oxalate ion in foodstuffs, namely, beetroot, a selected root crop of sufficient ripeness, medium size, and without mechanical damage was washed, peeled and finely chopped. After that, approximately 100 mL of distilled water was added to 2.5 g of the obtained sample and intensively stirred for 1 hour. Next, the solution was filtered into a 250-mL volumetric flask, washing the remaining sample on the filter with distilled water, and the filtrate was diluted to the mark. In some experiments a centrifuge was used to facilitate the separation of solid particles from the solution. The resulting solution should have a deep red color and contain as little suspended matter as possible. Due to the solution color the reference solution was changed for further measurement. To prepare it, 1.0 mL of the resulting extract was diluted by a factor of ten with distilled water. No other reagents were added. For analysis, 1.0 mL of the resulting extract was added to a graduated 10-mL test tube, and then the procedure adhered to the method described above.
Results and Discussion
A method of sensitive oxalate determination in foodstuffs is based upon studying its activation effect on the catalytic action of iron(II) in the reaction of iodide oxidation by bromate ion [22]. For all advantages of this procedure it is not without demerits, as the chosen analytical signal is the absorbance of triiodide ion [I 3 ]–, which is measured at λ = 352 nm. Obviously, the visible region ought to be more suited for mass analysis. At the same time, a well-known complex of iodine with starch, long used in analytical chemistry, has intensive dark-blue coloring.
In order to adapt the method to visible region of light absorbance, we confirmed the spectrum of the iodine-starch complex, necessary in separation of the oxalate analytical effects and the blank experiment. The solution for spectrophotometric measurement contained all reactants according to the procedure described above, except oxalate. The spectrum in the range 400–750 nm is shown in Fig. 1.
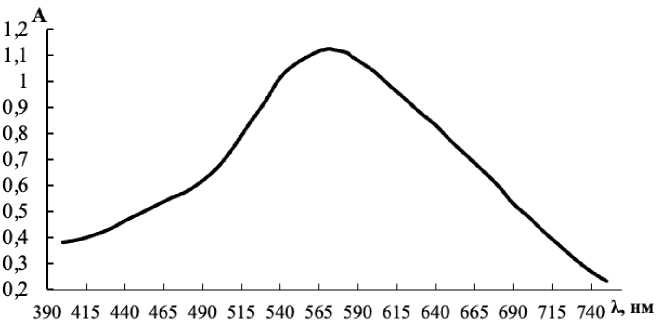
Fig. 1. Light absorption spectrum of the iodine-starch complex (C S = 3.0 mg/mL, C Fe = 0.7 µg/mL, C br = 0.010 M, pH buf = 5.0)
The curve contains a single flattened maximum within the range 565–595 nm, further investigations were carried out on a KFK-2 photocolorimeter with a light filter 590 nm.
The analytical signal for oxalate determination is the rate of the iodine-starch complex formation after oxidation of iodide by potassium bromate, therefore, the rate of color appearance. Iron(II) catalyses the process, while oxalate appears to activate the catalyst. It means that the reaction of iodine formation also proceeds without oxalate. The absorbance-time dependence is shown in Fig. 2.
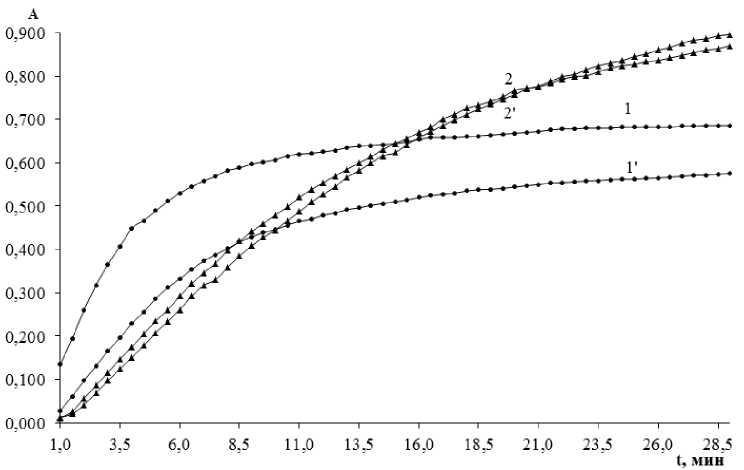
Fig. 2. Absorbance-time plots for the iodine-starch complex formation (C Fe = 0.7 µg/mL, C br = 0.010 M, pH buf = 5.0;
1, 1' : C S = 0.10 mg/mL, 2, 2': C S = 1.0 mg/mL; 1, 2: C OX = 1.0 µ g/mL, 1', 2': C OX = 0)
In a short time the absorbance measurements develop into quite intensive values both for the oxa-late-containing solution and the blank experiment. Actually, it is not of great importance, as the analytical signal in kinetic methods is not the absorbance itself, but the rate at which it changes during a reaction. The comparison allows us to conclude that the difference between dependences in the presence of oxalate and its absence does exist. Unlike many oxidation reactions, this one does not include any induction period, during the determination procedure the absorbance can be measured at once. The rate also depends on the starch concentration, which has an ability to increase the initial rate (for the first 5 min especially), the other stage of color development shows much slower rate that tends to zero. Clearly, it is not simply an indicator for the produced iodine, but a reactant influencing the process.
Investigation of the starch concentration influence has been carried out in the range (0.01–1.0) ⋅ 10–3 g/mL in the cuvette solution. Starch has been added before potassium bromate, the addition of which starts the reaction and the absorbance measurement process. After identifying the straight-line part of the kinetic curve in the beginning of it, we have calculated the initial rates values. Each rate measurement has been accompanied by the corresponding blank experiment with the same concentration of starch, but without oxalate ion. Figure 3 represents the results of the measurement series.
The starch concentration influences the initial rate of both check and blank experiments. Increasing starch concentration leads to the regular trend in rising the color intensity. That is why much too high starch concentration values makes the oxalate determination difficult. However, when starch concentration is too low, we come up against difficulties of another nature: bad reproducibility because of concurrent reactions of iodine production, the formation of its starch complex, and oxidation by oxygen dissolved in water. The maximal differences of initial rates in the presence of oxalate and its absence is observed at 3.0 ⋅ 10–4 g/mL of starch, which has been chosen for further study.
Acidity of the reaction medium influences the formation of the triiodide ion [22], therefore the study of the rate-pH dependence is important for our procedure. To maintain weakly acidic medium, we have used acetate buffer solutions with the pH values in the range 2.6–6.0, adding them to all other components as usual. The pH influence proved a complicated one. The greatest differences between the reaction rates of oxalate-containing solution and the blank experiments have been observed on the edges of the interval. However, at pH 2.69 the solution has turned into dark brown instead of the typical dark blue color.
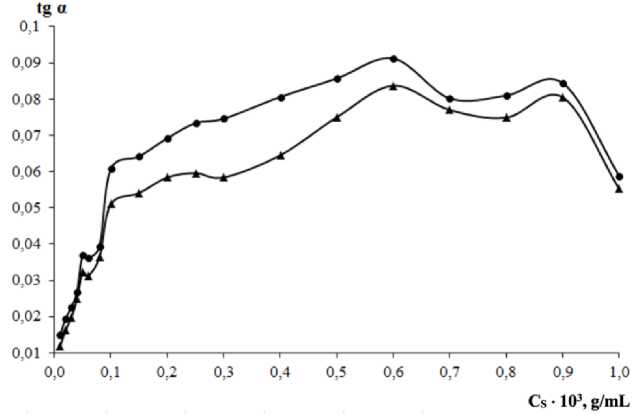
Fig. 3. Effect of starch concentration on the initial rate
(C Fe = 0.7 µg/mL, C br = 0.010 M, pH buf = 5.0; 1: C OX = 1.0 µ g/mL, 1': C OX = 0)
It can be explained by the soluble starch decomposition into dextrin and the brown coloration of iodine produced by the oxidation. In this case starch cannot play the role of a visible indicator anymore. The end of the interval, though providing notable differences in the analytical signal, especially at pH = 5.83 and pH = 6.00, has shown a tendency to irreproducibility. Under these conditions iron(II), which is necessary as a catalyst to the reaction, is oxidized by oxygen with greater ease and changes the initial rate of the iodine formation.
A part of the rate-pH plot is shown in Fig. 4.
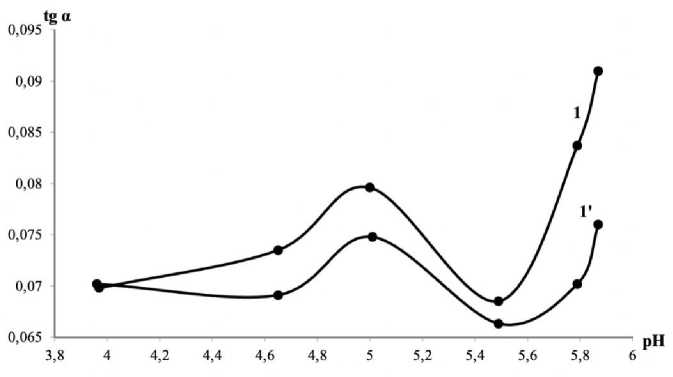
Fig. 4. Effect of the buffer solution pH value on the initial rate (C Fe = 0.7 µg/mL, C br = 0.010 M, C S = 0.3 mg/mL; 1: C OX = 1.0 µ g/mL, 1': C OX = 0)
The pH values 4.69 and 5.05 have been of our main interest here. The rate differences are high enough, at the same time all components keep their properties intact. Choosing between these two values mean remembering the distribution of ions in the aqueous solution of oxalic acid.
H 2 C 2 O 4 ^ HC 2 O 4 - + H+; pK ai = 1.25. (1)
HC2O4- ^ C2O42- + H+; pKa2 = 4.22. (2)
At pH 4.22 the hydrogen oxalate form is equimolar with oxalate, according to (2), while at pH 5 the completely ionized C2O42– form dominates among other forms of the analyte in an aqueous solution. Taking this into account, we have chosen the second stable maximum of the rate difference, namely, pH equaling 5.05 to use for the developed procedure.
At optimal conditions the calibration curve for oxalate determination has been plotted. The initial rates of the indicator reaction adhere to linear law from 0.10 to 10.0 µg/mL of the analyte. The least square method has been used to get the characteristics of the linear plot, and the equation of linear regression looks like:
Y = (0.050 ± 0.002) + (0.0115 ± 0.0004) X.
The linear approximation is good enough, with R2 = 0.9982. As expected, the line graph does not pass through the origin of the coordinates. The indicator redox reaction can proceed with noticeable rate in the presence of the Fe2+ catalyst alone, without participation of the oxalate activator.
In order to evaluate the metrological characteristics of oxalate determination by the suggested method we have analyzed the mixtures of the known amounts of diluted standard solutions in the complete range of the linear calibration graph. For each of the studied oxalate concentrations the number of replicate analyses equals 5, each series has been tested for outliers. After calculating initial rates we have found the concentrations in the analyzed solutions using the linear regression equation. Evaluation of metrological characteristics has been carried out on the basis of conventional statistical criteria at confidence level P = 0.95. The obtained samples of the initial rate values and the corresponding concentrations with their confidence intervals are tabulated in Table 1.
Table 1
Evaluation of oxalate determination errors
|
C(C 2 O 4 2–), µ g/mL |
tg α |
C i , µ g/mL |
the mean, µ g/mL |
S, µ g/mL |
Δ C, µ g/mL |
^- 100% |
δ , % |
|
0.1 |
0.0564 0.0566 0.0529 0.0556 0.0536 |
0.101 0.102 0.095 0.100 0.096 |
0.099 |
0.0031 |
0.0039 |
3.90 |
1.00 |
|
1.0 |
0.0607 0.0568 0.0563 0.0611 0.0577 |
0.941 0.881 0.873 0.947 0.895 |
0.907 |
0.034 |
0.043 |
4.71 |
9.30 |
|
2.0 |
0.0840 0.0841 0.0843 0.0825 0.0845 |
2.127 2.129 2.134 2.088 2.139 |
2.123 |
0.020 |
0.025 |
1.19 |
6.15 |
|
2.5 |
0.0865 0.0872 0.0899 0.0894 0.0904 |
2.556 2.577 2.657 2.642 2.671 |
2.621 |
0.051 |
0.063 |
2.42 |
4.84 |
|
5.0 |
0.1106 0.1118 0.1132 0.1128 0.1123 |
4.920 4.973 5.036 5.018 4.996 |
4.989 |
0.045 |
0.056 |
1.14 |
0.22 |
|
7.5 |
0.1361 0.1378 0.1384 0.1379 0.1372 |
7.344 7.435 7.468 7.441 7.403 |
7.418 |
0.047 |
0.059 |
0.80 |
1.09 |
|
10.0 |
0.1700 0.1714 0.1696 0.1715 0.1715 |
9.977 10.059 9.953 10.065 10.065 |
10.024 |
0.054 |
0.067 |
0.67 |
0.24 |
It is not surprising that precision is expressed in smaller numbers with increasing oxalate concentration; all the values are within the range (0.67–4.71) %. As for accuracy, we have evaluated it by comparison with the added concentration of the standard solution, the errors are contained within the interval (0.22 – 9.30) %, but mostly to the smaller side.
Thus, the kinetic photometric oxalate determination, based upon its activation of the iron(II)-catalyzed reaction of iodide oxidation by bromate ion, controlled by the absorbance of iodine-starch complex in the visible light, has proved to be metrologically sound. The studied method has been applied for food analysis, as oxalate is one of the controlled components in foodstuffs.
The obvious choice for analysis of foodstuffs is the method of standard additions, routinely used for objects with multicomponent matrices. Besides, this is one of the methods for accuracy corroboration.
To determine the content of oxalate ion in foodstuffs, raw beetroot was selected as an example, high enough in oxalate content and strongly colored. The mass of the prepared (washed, peeled, and chopped) beet sample equaled 2.5 g. In order to obtain the aqueous extract of water-soluble oxalate from the plant tissue it was stirred for an hour with 100 mL of distilled water. The extract after centrifugation and filtration was quantitatively transferred to a 250-mL volumetric flask.
Together with oxalate much of the plant dyes that impart dark red color to beet went into the solution prepared for absorbance measurement. Therefore the procedure was slightly modified. The most noteworthy feature is that the absorbance was measured not against distilled water as during the work with standard solutions, but against the solution of the colored extract itself, of course, without the catalyst, indicator, and oxidizer. To get the reference solution, 1.0 mL aliquot of the aqueous beet extract was taken, to be diluted in 10-mL graduated test tube. The aliquot for oxalate determination also equaled 1.0 mL. This way we got solutions with easily measurable absorbance and could study its development in time (kinetic curves).
The method of standard additions has been used for analysis of a sample, that is, aliquots of the standard oxalate solutions were mixed with the sample. The added aliquots of the standard solution have been chosen so that not to exceed the range of linear dependence of the initial rate from the oxalate concentration, namely, to give 1.0 µ g/mL and 2.0 µ g/mL in the cuvette solution. The concentrations of oxalate in the replicate samples without standard additions have been found by the linear regression equations for the tg α = f(COX) function, equaling the function value to zero (the point of the line graph crossing the x axis). These concentrations were multiplied by the aliquot factor 10, to get the concentrations in the obtained extract before its dilution, and converted from µ g/mL to µ g/g, taking into account that the extract from 2.5 g of the beetroot sample was quantitatively transferred to a 250-mL volumetric flask. According to statistical analysis, the content of oxalate ion in beetroot equaled (379 ± 2) µ g/g. Comparing the differences in analytical signal corresponding to the concentration of standard additions alone, we were able to evaluate the accuracy of determination; the error amounted to 3.0%. The results of calculation with their metrological characteristics are presented in Table 2.
Table 2
Determination of oxalate ion in beetroot extract samples by the standard addition method
|
C add , µ g/mL |
tg α |
C i , µ g/g |
the mean, µ g/g |
S, µ g/g |
Δ C, µ g/g |
^- 100% |
δ , % |
|
0 |
0.0570; 0.0567; 0.0569; 0.0571 |
379 376 379 380 |
378.5 |
1.73 |
2.46 |
0.6 |
3.0 |
|
1.0 |
0.0716; 0.0718; 0.0716; 0.0717 |
||||||
|
2.0 |
0.087; 0.0873; 0.0869; 0.0871 |
The oxalate ion content in beetroot can vary from 76 to 675 µ g/g [23–25] depending on the growth conditions and other factors, with average values 350–400 µ g/g. The resulting mean fits snugly within this interval, which attests that the suggested kinetic photometric method can be used for analysis of oxalate-containing foodstuffs.
Compared to the UV-absorbing method based on the same reaction [22], the procedure using visible absorbance is somewhat less sensible, but of comparable reproducibility. Thus, our study made it possible to adapt the oxalate determination for simpler and less costly photometers relying upon visible light and to widen the applicability of the method for mass analysis. The calculation of initial rates is not so rapid as direct photometric determination, but the kinetic photometric method has an obvious merit in being able to determine analytes in colored or turbid solutions, as are often got from foodstuffs.
Conclusions
-
1. Kinetic photometric determination of oxalate reacting as an activator for the iron(II)-catalyzed oxidation of iodide by potassium bromate is possible to control by absorbance of visible light instead of UV, because of introduction of soluble starch into the system and formation of iodine-starch complex.
-
2. The optimal conditions for oxalate determination by the initial rate method: starch concentration is 0.30 mg/mL; pH = 5.05. The calibration curve is linear in the (0.1–10) µ g/mL range. Precision error is within the range (0.67–4.71) %, while the accuracy error is within (0.22–9.30) %.
-
3. The method was applied to food analysis for the content of oxalate by the standard addition method. The analyzed beetroot sample contained (379 ± 2) µ g per 1 g of the raw product. Determination was carried out with 0.6 % precision error and 3.0 % accuracy error.
References Kinetic photometric determination of oxalate by its activation effect on catalytic oxidation of iodide and formation of iodine-starch complex
- Sadritdinova R.R. Preparation of Oxalic Acid. Modern Problems of Science and Education, 2016, vol. 25, no. 67, pp. 23–25.
- Abratt V.R., Reid S.J. Oxalate-Degrading Bacteria of the Human Gut as Probiotics in the Man-agement of Kidney Stone Disease. Adv. Appl. Microbiol., 2010, vol. 72, pp. 63–87. DOI: 10.1016/S0065-2164(10)72003-7.
- Massey L.K., Whiting S.J. Dietary Salt, Urinary Calcium, and Kidney Stone Risk. Nutr. Rev, 1995, vol. 53, no. 5, pp. 131–139. DOI: 10.1111/j.1753-4887.1995.tb01536.x.
- Robertson W.G., Peacock M., Heyburn P.J., Marshall D.H., Clark P.B. Risk Factors in Calcium Stone Disease of the Urinary Tract. Br. J. Urol., 1978. vol. 50, pp. 449–454. DOI: 10.1111/j.1464-410x.1978.tb06189.x.
- Barlow I.M. Obviating Interferences in the Assay of Urinary Oxalate. Clin. Chem, 1987, vol. 33, pp. 855–858. DOI: 10.1007/978-1-4471-1626-4_2
- Hu H.C., Jin H.J., Chai X.S. A Practical Headspace Gas Chromatographic Method for the Deter-mination of Oxalate in Bleaching Effluents. J. Ind. Eng. Chem, 2014, vol. 20, no. 1, pp. 13–16. DOI:10.1016/j.jiec.2013.02.041.
- Baadenhuijsen H., Jansen A.P. Colorimetric Determination of Urinary Oxalate Recovered as Cal-cium Oxalate. Clin. Chem. Acta, 1975, vol. 62, no. 2, pp. 315–324. DOI: 10.1016/0009-8981(75)90243-0.
- Petrarulo M., Cerelli E., Marangella M., Cosseddu D., Vitale C., Linari F. Assay of Plasma Oxa-late with Soluble Oxalate Oxidase. Clin. Chem, 1994, vol. 40, no. 11, pp. 2030–2034. DOI:10.1093/clinchem/40.11.2030.
- Gottstein H.D., Zook M.N., Kuc J.A. Detection and Quantitation of Oxalic Acid by Capillary Gas Chromatography. J. Chromatogr. A, 1989, vol. 481, pp. 55–61.
- Yusenko E., Polyntseva E., Lyzhova A., Kalyakina O. Determination of Oxalate and Some In-organic Anions in Green and Black Tea. Proc. Latv. Acad. Sci., Sect. B, 2013, vol. 67, no. 4–5, pp. 429–432. DOI:10.2478/prolas-2013-0076.
- Maya F., Estela J.M.L., Cerda V. Multisyringe Ion Chromatography with Chemiluminescence Detection for the Determination of Oxalate in Beer and Urine Samples. Microchim. Acta, 2011, vol. 173, no. 1, pp. 33–41. DOI: 10.1007/s00604-010-0511-1.
- Lachenmeier D.W., Richling E., Lopez M.G., Frank W., Schreier P. Multivariate Analysis of FTIR and Ion Chromatographic Data for the Quality Control of Tequila. J. Agric. Food Chem., 2005, vol. 53, no. 6, pp. 2151–2157. DOI: 10.1021/jf048637f.
- Keevil B.G., Thornton S. Quantification of Urinary Oxalate by Liquid Chromatography –Tandem Mass Spectrometry with Online Weak Anion Exchange Chromatography. Clin Chem., 2006, vol. 52, no. 12, pp. 2296–2299. DOI: 10.1373/clinchem.2006.075275.
- Adeniyi S.A., Orjiekwe C.L., Ehiagbonare J.E. Determination of Alkaloids and Oxalates in some Selected Food Samples in Nigeria. Afr. J. Biotechnol., 2009, vol. 8, no. 1, pp. 110–112.
- Rhaman M.M., Fronczek F.R., Powell D.R., Hossain M.A. Colourimetric and Fluorescent De-tection of Oxalate in Water by a New Macrocycle-Based Dinuclear Nickel Complex: A Remarkable Red Shift of the Fluorescence Band. Dalton Trans., 2014, vol. 43, no. 12, pp. 4618–4621. DOI: 10.1039/c3dt53467g.
- Hu M., Feng G. Highly Selective and Sensitive Fluorescent Sensing of Oxalate in Water. Chem. Commun., 2012, vol. 48, no. 55, pp. 6951–6953. DOI: 10.1039/c2cc33191h.
- He C., Qian X., Xu Y., Yang C., Yin L., Zhu W. A Ratiometric Fluorescent Probe for Oxalate Based on Alkyne-Conjugated Carboxamidoquinolines in Aqueous Solution and Imaging in Living Cells. Dalton Trans., 2011, vol. 40, no. 5, pp. 1034–1037. DOI: 10.1039/c0dt01364a.
- Bernstein L., Khan A. Rapid Spectrophotometric Determination of Oxalate in Beer and Wort. Proc. Am. Soc. Brew. Chem., 1973, vol. 31, no. 1, pp. 20–23.
- Allan A.L., Band B.S.F., Rubio E. Spectrophotometric Determination of Oxalate in Aqueous Solution. Microchem. J., 1986, vol. 34, no. 1, pp. 51–55. DOI: 10.1016/0026-265X(86)90101-3.
- Zhai Q.-Z., Zhang X.-X., Liu Q.-Z. Catalytic Kinetic Spectrophotometry for the Determination of Trace Amount of Oxalic Acid in Biological Samples with Oxalic Acid – Rhodamine B –Potassium Dichromate System. Spectrochim. Acta, Part A, 2006, vol. 65, no. 1, pp. 1–4. DOI: 10.1016/j.saa.2005.07.080.
- Chamjangali A.M., Sharif-Razavian L., Yousefi M., Amin A.H. Determination of Trace Amounts of Oxalate in Vegetable and Water Samples Using a New Kinetic–Catalytic Reaction System. Spectrochim. Acta, Part A, 2009, vol. 73, no. 1, pp. 112–116. DOI: 10.1016/j.saa.2009.01.027.
- Chamjangali M.A., Keley V., Bagherian G. Kinetic Spectrophotometric Method for the Deter-mination of Trace Amounts of Oxalate by an Activation Effect. Anal. Sci, 2006, vol. 22, no. 2, pp. 333–336. DOI: 10.2116/analsci.22.333.
- Hanson C.F., Frankos V.H., Thompson W.O. Bioavailability of Oxalic Acid from Spinach, Sug-ar Beet Fibre and a Solution of Sodium Oxalate Consumed by Female Volunteers. Food Chem. Toxicol., 1989, vol. 27, no. 3, pp. 181–184. DOI: 10.1016/0278-6915(89)90067-7.
- Massey L.K., Food Oxalate: Factors Affecting Measurement, Biological Variation, and Bioavai-lability. J. Am. Diet. Assoc., 2007, vol. 107, no. 7, pp. 1191–1194. DOI: 10.1016/j.jada.2007.04.007.
- Akhtar M.S., Israr B., Bhatty N., Ali A. Effect of Cooking on Soluble and Insoluble Oxalate Contents in Selected Pakistani Vegetables and Beans. Int. J. Food Prop., 2011, vol. 14, no. 1, pp. 241–249. DOI: 10.1080/10942910903326056.
