Labor Markets of the Northern Territories of Russia in 2019–2023

Author: Giltman M.A., Merzlyakova A.Yu., Larionova N.I.
Journal: Arctic and North @arctic-and-north
Section: Northern and arctic societies
Article in issue: 62, 2026.
Free access
The paper analyses the processes taking place in the local labor markets of Russia’s northern territories in 2019–2023. A review of the results of empirical studies showed that the northern territories of the Russian Federation differ in terms of economic development, sectoral structure and labor market characteristics. This work aims to identify and show changes in the main characteristics of employment and labor markets of the northern territories over the five-year period 2019–2023, characterized by a high frequency of exposure to external macro-shocks. The analysis was conducted using Rosstat data aggregated by regions and territories of the Far North and equivalent areas and/or the Arctic zone of the Russian Federation. The work analyzed the dynamics of migration growth of the population, the number and structure of employment, wages and indicators of tension in the regional labor markets of the northern territories. The study showed that, despite the continuing heterogeneity of the labor markets of the northern territories in many indicators, positive dynamics were observed in some of them, even in depressed regions. In terms of the aggregate positive changes in indicators, the Khanty-Mansi Autonomous Okrug — Yugra was in the lead, while the Komi Republic showed negative changes. The results of the analysis can be used in implementing demographic, migration and social policies, as well as in developing programs aimed at regulating regional labor markets in northern and Arctic territories.
Employment, labor market, Far North, Russian Arctic, labor demand
Short address: https://sciup.org/148333289
IDR: 148333289 | UDC: 331.522(985)(045) | DOI: 10.37482/issn2221-2698.2026.62.170
Text of the scientific article Labor Markets of the Northern Territories of Russia in 2019–2023
DOI:
The northern territories of Russia 1 occupy approximately 70% of the country’s territory, about 7% of the Russian Federation’s population lives there. In scientific and business literature, living in the North is associated with extreme natural and climatic conditions, infrastructure problems, remoteness from the centre of the country, and population outflow [1, Pilyasov A.N.; 2, Kryukov V.A.; 3, Trofimov S.E.; 4, Giltman M.A., Obukhovich N.V., Larionova N.I.]. At the same time, issues of differentiation in the development of the northern territories are rarely given prior-
-
∗ © Giltman M.A., Merzlyakova A.Yu., Larionova N.I., 2026
This work is licensed under a CC BY-SA License ity, although the problems of uneven economic and social development in settlements in the Far North are very acute. Even without referring specifically to statistical data, any reader interested in the problems of the North and the Arctic can say that the standards of living, for example, in Vorkuta and Salekhard, the Republic of Tyva and the Khanty-Mansi Autonomous Okrug — Yugra differ significantly. The Russian North is very diverse: it includes old industrial northern regions such as the Murmansk and Arkhangelsk oblasts; the ethnic republics of Sakha (Yakutia), Komi, Tyva, and Karelia; the rich extractive autonomous okrugs of Yamalo-Nenets, Khanty-Mansi — Yugra, and Nenets; other groups of regions [4]. The Russian Arctic occupies a special place among all the northern regions of the Russian Federation, where less than 2% of the country’s population lives and about 6–7% of GDP is produced. The development of the Arctic territory is identified as one of the major challenges and priorities of the Strategy for Scientific and Technological Development of the Russian Federation until 2035. The importance of the Arctic’s geopolitical position and its rich reserves of natural resources explain the active position of the state in regulating the development of this territory. Recent state support initiatives worth noting include the “Arctic Hectare” and “Arctic Challenge” programs, aimed at attracting people to the Arctic and creating favorable living conditions there, including for highly qualified personnel. Russia’s largest investors and employers, including Gazprom, Rosneft, Lukoil, Norilsk Nickel, Severstal, and Alrosa, operate in the Arctic mining regions, attracting skilled workers and providing them with decent wages. At the same time, even in the less populous regions of the Arctic zone of the Russian Federation, compared to the Far North, the difference in regional average monthly wages is quite significant — up to 2.5 times.
One of the characteristics of living in the Far North is the high importance of employment, except for indigenous ethnic groups. Therefore, in order to retain and attract people to the northern territories, it is necessary to understand the employment opportunities available in each region and how their labor markets function. Modern investment projects are highly technological, and the demand for different numbers and qualifications of workers is extremely variable at different stages of their implementation. This variability of labor demand reduces the economic necessity for the population to reside permanently in the Far North and Arctic regions, with temporary forms of employment becoming increasingly widespread [5, Zamyatina N.Yu., Pilyasov A.N.; 6, Pilyasov A.N.; 2, Kryukov V.A.]. As a result, there has been a decline in labor demand and a reduction in the population of northern cities and regions [7, Khoreva O., Konchakov R., Leonard C. et al.]. In recent years, labor markets in all regions have been impacted by various external factors: both global shocks (e.g., the COVID-19 pandemic) and changes affecting their (labor markets) functioning, such as a reduction in the labor force. In these rapidly changing conditions, the functioning of labor markets in northern territories had to become even more flexible and adaptive. The aim of this work is to identify changes in the main characteristics of employment and labor markets in the northern territories over the five-year period of 2019–2023. At the time of writing, 2023 is the year with the most recent available data, and the functioning of labor markets in the
NORTHERN AND ARCTIC SOCIETIES
Marina A. Giltman, Anastasia Yu. Merzlyakova, Natalia I. Larionova. Labor Markets … period prior to 2019 has already been studied in sufficient detail, as will be discussed in the next section.
Labor markets in the northern territories: a review of research
There are different approaches and levels of analysis of northern territories. A number of researchers consider the North and the Arctic as a single macro-region, highlighting common features for the countries, regions, and cities within it. According to this approach, Russian territory is viewed as an integral part of the Arctic, and its similarities and differences with Arctic regions and cities in other countries are compared. Common trends include population aging (despite the fact that, on average, the population of the northern territories of most countries is younger than in other regions), gender ratio balancing (previously, the male population predominated), population concentration in large cities with depopulation of small settlements, high migration activity, largely determined by labor demand [8, Carson D., Carson D., Nordin G. et al.; 9, Emelyanova A.; 10, Hamilton L., Wirsing J., Saito K.; 11, Kadenic M.; 12, Rolfe J., Miles B., Lockie S. et al.; 13, Suopajärvi L., Poelzer G., Ejdemo T. et al.; 14, Tano S., Pettersson O., Stjernström O.; 15, Wilson E., Stammler F.; 6, Pilyasov A.N.; 16, Heleniak T.].
The main specific feature of the northern and Arctic territories of all countries that affects the labor market is the high migration activity of the population [17, Sokolova F.H.; 18, Howe E.]. This can be explained by the fact that a large proportion of Arctic settlements are small in terms of population and size, so migration has a significant impact on overall population and human capital changes in the North and the Arctic [16]. Internal mobility in the northern and Arctic regions is characterized by an outflow of young people from peripheral areas to urban centers [16; 19, Lundgren A., Randall L., Norlén G. et al.]. The main reasons for this trend are more developed labor markets and educational opportunities [19; 4]. Moreover, a higher level of education increases the likelihood of settling in large cities, which occupy a central place in the labor market [20, Glae-ser E.]. Since young workers and women tend to achieve higher levels of education, they mainly move from small northern towns to large cities [7; 21, Huskey L., Howe E.]. In addition to migration, the labor markets of the northern and Arctic regions are influenced by the high level of urbanization, which is often explained by concentration of labor demand in cities [22, Larsen J.N., Fondahl G.; 21]. Zamyatina and Goncharov [23] emphasize that the Arctic is the most urbanized part of Russia: as of early 2016, 89% of the population in the Arctic zone of the Russian Federation lived in cities. Other Russian scientists have also noted the high proportion of urban population in northern and Arctic labor markets [24, Smirnov A.V.]. Zamyatina and Goncharov [23] identified the following types of Russian Arctic cities: a few key multifunctional centers; peripheral administrative centers; port centers; and industrial inland centers.
Different types of settlements, uneven distribution of natural resources, varying distances from the country’s central cities and other features give rise to regional differences between northern territories, which are often the subject of independent research. For example, studies on the Russian Arctic note that some regions are only partially included in the Arctic Zone of the Russian Federation (AZRF), which causes certain difficulties for analyzing the economic processes taking place there. The Vorkuta and Usinsk districts, for instance, are located very close to each other and have very similar socio-economic processes, but the latter is not formally part of the AZRF [25, Fauzer V.V., Smirnov A.V., Lytkina T.S., et al.]. There are only four regions that are fully included in the AZRF (Murmansk Oblast, Nenets, Chukotka and Yamalo-Nenets Autonomous Okrugs). All other regions may experience trends that are not unique to the Arctic.
From the perspective of labor market analysis, it is interesting to note that, despite Russia being the leader in terms of GRP produced in the Arctic, there is a significant differentiation in household incomes between the poles of poverty and wealth in the Arctic region of Russia [1]. As a rule, this refers to the “rich” Nenets and Yamalo-Nenets Autonomous Okrugs and other AZRF entities. The share of the primary sector exceeds 50% in only two leading regions (Nenets and Yamalo-Nenets Autonomous Okrugs). The GRP of the Nenets Autonomous Okrug is one of the highest in the Arctic and exceeds the GRP of, for example, Karelia by 15.6 times. Such a high level of differentiation in economic development is not typical for other Arctic countries [26, Giltman M.A.]. Segregation into progressive and regressive poles is more characteristic of Russian Arctic territories than of any other northern territories in the world [27, Tsykalov A., Goncharov R., Koptseva N. et al.]. The uneven economic and social development of the northern and Arctic regions leads to the emergence of many geographically isolated local labor markets in the Russian North, which are formed in separate municipalities. The largest number of workers in the Arctic is concentrated in Yamalo-Nenets Autonomous Okrug (33.2%), Murmansk Oblast (24.6%) and Arkhangelsk Oblast (20.4%). The smallest number is in the Republic of Sakha (Yakutia) (0.9%) [28, p. 172]. The Arctic labor markets are evenly distributed between the European and Asian parts [16]. Mixed labor markets predominate (32.8%), followed by extractive markets (22.4%), with manufacturing markets being the least common (8.6%). The European part of the Russian Arctic has more manufacturing and closed labor markets. Extractive and infrastructure labor markets are mainly located in the Asian part [25]. The highest employment rate is characteristic of the Chukotka Autonomous Okrug (75.4%), the lowest — in the Arkhangelsk Oblast (56.1%). At the same time, there has been a change in the structure of employment. In 2000, workers with secondary (general and vocational) education were most in demand, whereas in 2018, the largest share of the labor market was occupied by workers with secondary vocational education (45%) and higher education (34.2%). Among the unemployed, workers with secondary general education (29.4%) and secondary vocational education (39.4%) predominate [29, Romashkina G., Skipin D., Yukhtanova Y. et al.].
The decrease in labor potential and the deformation of the age structure in the northern regions are largely due to the decline in the population of the Russian North (from 1989 to 2020, it decreased by 22.6%) [24]. The largest share of the working-age population was in those regions of the Russian Arctic and Far North, where a high proportion of employment is linked to the extraction of natural resources, such as oil, gas and minerals [30, Jungsberg L., Wang S.]. Thus, the pro- portion of the working-age population exceeded 75% in the municipalities of Chukotka, the urban settlements of the Yamalo-Nenets Autonomous Okrug, and the city of Norilsk in the Krasnoyarsk Krai. The socio-demographic characteristics of the northern and Arctic regions are also influenced by the ethnic composition of the population. Representatives of the indigenous peoples of the North are less inclined to interregional and international migration; they have higher birth rates and lower life expectancy [10]. The highest birth rates are observed in the national republics of Sakha (Yakutia) and Komi, as well as the Nenets, Yamalo-Nenets, and Chukotka Autonomous Okrugs [31, Fauzer V.V., Smirnov A.V.]. However, previous studies have documented lower educational and employment outcomes for indigenous peoples compared to the rest of the population [32, Anderson I., Robson B., Connolly M. et al.]. For example, only 4.9% of the Chukchi have completed higher education, compared to 15.7% of the total population. In northern and Arctic ethnic territories, the lack of education among indigenous peoples is partly explained by the lack of local infrastructure, particularly, higher education institutions [16], which ultimately leads to decreased competitiveness in the labor market and a reduction in employment opportunities.
The spatial distribution of migrants across the Arctic Zone of the Russian Federation is determined by the structure of the regional economy and employment patterns, as well as the standard of living and quality of life of the population. One of the recent studies at the settlement level was conducted in 2019. It covered 177 settlements in the Russian Arctic. More than 75% of them experienced population decline, primarily due to migration outflow [16]. The Nenets and Yamalo-Nenets Autonomous Okrugs showed strong positive growth. The sharpest demographic decline occurred in Komi, where Vorkuta lost almost 40% of its population. The eastern part of the Russian Arctic also declined. The Magadan Oblast and Kamchatka experienced significant population losses due to negative natural growth and migration outflow [33, Skrupskaya Y.]. The Krasnoyarsk Krai and the Republic of Sakha (Yakutia) are large territorial entities of the Russian Federation, so internal migration is quite intense there. In the Arkhangelsk Oblast and the Komi Republic, population flows mainly move from villages and small towns to large cities with a higher standard of living. The rapidly developing and economically prosperous autonomous okrugs (Yamalo-Nenets, Nenets, Chukotka) attract large flows of commuter migrants — “shift workers” [17]. In the modern Russian Arctic, population outflow and population decline are more significant in the eastern regions, especially in regions that are traditional for the indigenous population of the Arctic [16]. The population left the republics of Sakha (Yakutia) and Komi most actively. The migration growth rate was negative: from -15.7 to -24.4 people per 1,000 inhabitants, respectively [31]. The highest population outflow was demonstrated by regions with monopsony, i.e., non-diversified labor markets [25]. Many researchers agree that solving the problems of uneven development in the northern and Arctic regions and ensuring their sustainable development depends on expanding and developing the functions of large cities as bases for comprehensive interregional development [27]. At the same time, there is a noticeable differentiation among Arctic cities and a need
NORTHERN AND ARCTIC SOCIETIES
Marina A. Giltman, Anastasia Yu. Merzlyakova, Natalia I. Larionova. Labor Markets … for a transition to a more locally-oriented policy that is more adequate in the context of existing differences [23].
Thus, the state of labor markets, the size and structure of the workforce in northern and Arctic regions are determined by the dynamics of the population’s demographic characteristics and migration processes. Northern local labor markets are highly differentiated in terms of structure and employment opportunities, depending on the region’s economic specialization and resource cycles. In addition to general factors at the supranational, national, regional and local levels, a number of researchers emphasize that, for example, the decision to migrate is influenced by individual and household characteristics [34, Hamilton L., Mitiguy A.], as well as employment conditions in other regions of the country [4].
Migration growth and employment
In previous studies, we have already noted that the labor markets in Russia’s northern territories, compared to those in the rest of the country, are characterized by a higher concentration of younger workers, as well as a predominance of workers with secondary vocational education [26]. An important conclusion of another study was that the migration decline in the Far North is linked to higher wages in the European part of Russia [4]. The period 2019–2023 was characterized by several exogenous macro-shocks (COVID-19, external sanctions, geopolitical instability), which inevitably affected the functioning of labor markets, including those in the northern territories. For our analysis, we focus on this period, using Rosstat data from three compilations: “Regions of Russia. Socio-Economic Indicators”, “Economic and Social Indicators of the Far North Regions and Equivalent Areas”, and “Statistical Information on the Socio-Economic Development of the Arctic Zone of the Russian Federation”. Unfortunately, the statistical information contained in the latter two collections is incomplete, so we have to refer to regional collections as well. The difficulty arises from the fact that some constituent entities of the Russian Federation are only partially included in both the Arctic zone of the Russian Federation [4] and the list of areas of the Far North and equivalent areas. Therefore, using general regional statistics, it is impossible to isolate indicators relating only to northern territories. For the reasons mentioned above, we refer to Rosstat information on indicators of socio-economic development in northern territories where possible. In other cases, we use data for the constituent entities of the Russian Federation whose territories are fully or largely included in the list of Far North regions and equivalent areas, as their number is higher than the number of territories included in the Arctic zone of the Russian Federation, and the territory of the Arctic zone of the Russian Federation is largely part of the territory of the Far North and equivalent areas.
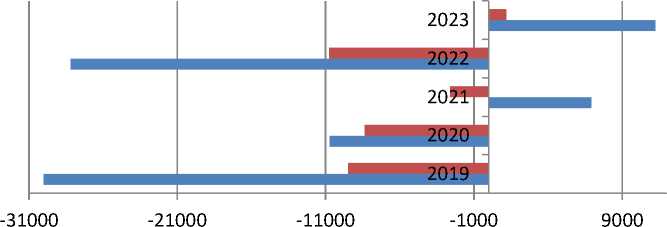
Let us begin with an analysis of the migration growth of the population in the northern territories in 2019–2023, as migration in the North and the Arctic is closely linked to employment opportunities. As can be seen in Fig. 1, in 2021 and 2023, there was positive growth in the territories of the Far North and equivalent areas, and in 2023, even in the Arctic zone of the Russian Federation.
■ Arctic ■ Far North
Fig. 1. Migration growth (+), (-), people 2.
It is important to note that, despite the positive migration growth in the northern territories as a whole, it was primarily driven by a few regions where a positive net migration had been observed previously. However, in 2021 and 2023, the absolute net migration growth in the recipient territories became so high that it outweighed the net migration loss from other regions. The Khanty-Mansi Autonomous Okrug — Yugra is the absolute leader in terms of positive net migration growth — it is the only region among those considered to have recorded a positive net migration throughout the entire period 2019–2023 (Fig. 2).
-
2 Source: compiled by the authors based on Rosstat data. Here and below, the term “Arctic” refers to the Arctic zone of the Russian Federation, and the “Far North” refers to the regions of the Far North and equivalent areas.
Chukotka Autonomous Okrug
Tyumen Oblast
Yamalo-Nenets Autonomous Okrug Khanty-Mansi Autonomous Okrug Tomsk Oblast
—
—
Sakhalin Oblast
Murmansk Oblast
Magadan Oblast
Irkutsk Oblast
Arkhangelsk Oblast
Nenets Autonomous Okrug
Amur Oblast
Khabarovsk Krai
Primorskiy Krai
1
Perm Krai
Krasnoyarsk Krai
Kamchatka Krai
Zabaykalsky Krai
Tyva Republic
Republic of Sakha (Yakutia)
Komi Republic
Republic of Karelia
Republic of Buryatia
Altai Republic
-8000
-3000
_
2000
7000 12000
17000
22000
■ 2023 ■ 2022 ■ 2021
■ 2020
■ 2019
1060.0
1040.0
1020.0
1000.0
980.0
960.0
940.0
920.0
900.0
880.0
860.0
Fig. 2. Migration growth (+), (-) in the Far North regions and equivalent areas of the corresponding constituent entity of the Russian Federation, people 3.
Positive net migration is an atypical situation for the northern territories of the Russian Federation, as shown in the literature review. It was also noted above that the main reason for moving to the North and the Arctic is better employment opportunities, so an overview of the main changes in the labor markets of Russia’s northern territories is an interesting and important task. It should be noted that the number of people employed in the northern territories of the Russian Federation in 2019–2023 also increased, with this growth beginning even earlier in the Arctic zone of the Russian Federation than in the Far North and equivalent areas, which also seems rather unusual (Fig. 3).
^^^n Far North ^^^nArctic
Fig. 3. Average number of employees of organizations operating in the Far North and equivalent areas (left axis) and in the Arctic Zone of the Russian Federation (right axis), thousands people.
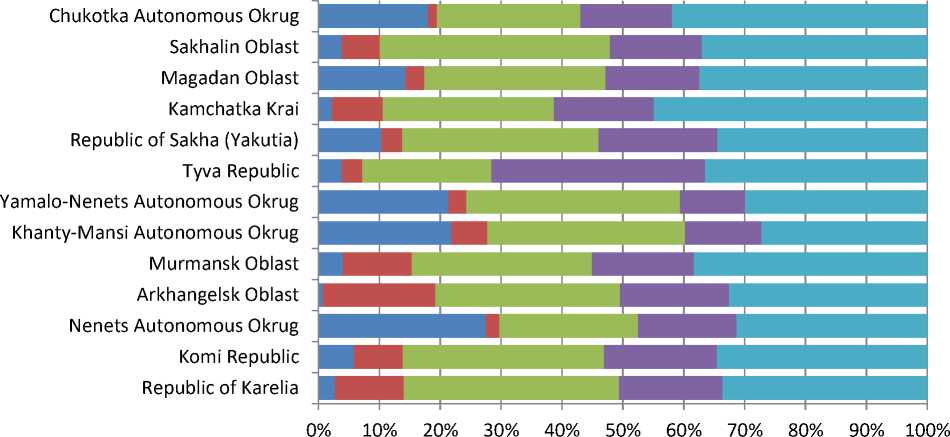
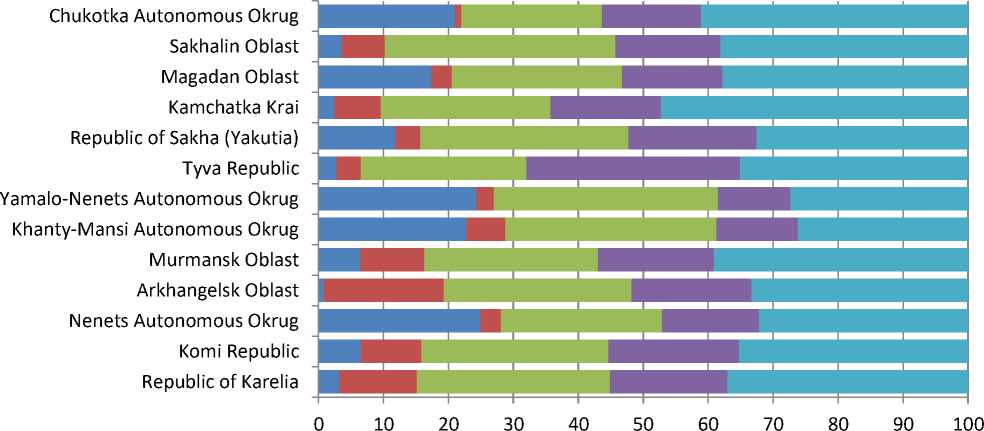
However, the employment structure remained practically unchanged over the period under review (Figs. 4 and 5). It is important to note that more than 40% of all those employed in the Far North and equivalent areas in 2019–2023 were engaged in extractive industries, including almost 30% in the autonomous okrugs of the Tyumen Oblast (Khanty-Mansi AO - Yugra and Yamalo-Nenets AO).
-
■ Mining ■ Manufacturing industries ■ Construction, trade and transport
-
■ Education and Healthcare ■ Others
Fig. 4. Distribution of employed people by type of economic activity in 2019, % of total number of employees 4.
-
■ Mining ■ Manufacturing industries ■ Construction, trade and transport
-
■ Education and Healthcare ■ Others
Fig. 5. Distribution of employed people by type of economic activity in 2023, % of total number of employees 5.
As noted above, the age and educational composition of the labor force in the northern territories has its own characteristics, in particular, a younger age compared to other territories of the Russian Federation. In 2019–2023, changes in the age composition of the labor force shifted from younger to older age groups (Table 1). In all constituent entities of the Russian Federation presented in Table 1 (except for the Chukotka Autonomous Okrug), the share of employees aged 15–29 decreased, while the shares of employees in other age groups, including the oldest (60+), increased.
Table 1
Age composition of the employed in the corresponding constituent entity of the Russian Federation in 2019 and 2023, % of total number of employees
|
15–29 years old |
30–59 years old |
60 and older |
|||||||
|
cn О гч |
co CM О fN |
Q_ Q. 0? 00 c ro _C |
cn О fN |
co CM О fN |
Q_ Q. CD 00 c ro -g |
cn О fN |
CO CM о CM |
Q. Q_ cd" 00 c co -g |
|
|
Republic of Karelia |
18.4 |
14.4 |
-4 |
75.3 |
77.6 |
2.3 |
6.4 |
8 |
1.6 |
|
Komi Republic |
17.5 |
13.1 |
-4.4 |
76.2 |
80.4 |
4.2 |
6.3 |
6.4 |
0.1 |
|
Nenets AO |
16.3 |
15 |
-1.3 |
77.6 |
77.9 |
0.3 |
6 |
7.1 |
1.1 |
|
Arkhangelsk Oblast (excluding NAO) |
18.5 |
14.5 |
-4 |
75.5 |
79.5 |
4 |
6 |
6.1 |
0.1 |
|
Murmansk Oblast |
18.7 |
14.3 |
-4.4 |
74.1 |
79.3 |
5.2 |
7.2 |
6.4 |
-0.8 |
|
Khanty-Mansi AO - Yugra |
16.7 |
15.2 |
-1.5 |
80.7 |
81.9 |
1.2 |
2.5 |
2.9 |
0.4 |
|
Yamalo-Nenets AO |
14.8 |
14.6 |
-0.2 |
83.2 |
80.8 |
-2.4 |
1.9 |
4.6 |
2.7 |
|
Tyva Republic |
21.1 |
18.3 |
-2.8 |
74.3 |
77.9 |
3.6 |
4.6 |
3.8 |
-0.8 |
|
Sakha Republic (Yakutia) |
21.2 |
19.6 |
-1.6 |
71.1 |
72 |
0.9 |
7.7 |
8.4 |
0.7 |
|
Kamchatka Krai |
17.5 |
14.5 |
-3 |
73.9 |
76.2 |
2.3 |
8.6 |
9.3 |
0.7 |
|
Magadan Oblast |
14.8 |
13.1 |
-1.7 |
75 |
76.3 |
1.3 |
10.2 |
10.6 |
0.4 |
|
Sakhalin Oblast |
16 |
14 |
-2 |
73.1 |
74.9 |
1.8 |
10.8 |
11.1 |
0.3 |
|
Chukotka AO |
12.8 |
16.9 |
4.1 |
78.5 |
77.7 |
-0.8 |
8.7 |
5.4 |
-3.3 |
The educational composition of employed people in 2019–2023 showed a trend toward an increase in the share of those with lower levels of education (Table 2). As previously [26], in 2019– 2023, the largest share of employed people (with the exception of the Yamalo-Nenets Autonomous Okrug) consisted of workers with secondary vocational education. However, there was also a noticeable trend toward a decrease in the share of employees with higher education and an increase in the share of workers with education below secondary vocational level. Only three of the regions under consideration demonstrated positive dynamics in the employment structure toward higher levels of education: Murmansk Oblast, Kamchatka Krai, and Sakhalin Oblast (Table 2).
Table 2 Educational composition of the employed in the corresponding constituent entity of the Russian Federation in 2019 and 2023, % of total number of employees
|
higher |
secondary vocational |
secondary general and below |
|||||||
|
cn О CM |
ГП гч о гч |
Q. О_ 0J сю с го -С |
СП о гч |
го гч о гч |
Q. О_ а? сю с го -С |
СП о гч |
го гч о гч |
Q. о. а? сю с го -С |
|
|
Republic of Karelia |
27.5 |
26.8 |
-0.7 |
53.7 |
52.5 |
-1.2 |
18.8 |
20.7 |
1.9 |
|
Komi Republic |
28.5 |
31.6 |
3.1 |
54.1 |
50.3 |
-3.8 |
17.4 |
18.1 |
0.7 |
|
Nenets AO |
36.9 |
31.5 |
-5.4 |
48.5 |
54.6 |
6.1 |
14.6 |
13.9 |
-0.7 |
|
Arkhangelsk Oblast (excluding NAO) |
28.3 |
27.9 |
-0.4 |
54.3 |
54.2 |
-0.1 |
17.4 |
17.9 |
0.5 |
|
Murmansk Oblast |
36.3 |
37.4 |
1.1 |
45.8 |
46 |
0.2 |
17.9 |
16.6 |
-1.3 |
|
Khanty-Mansi AO -Yugra |
37.9 |
32.2 |
-5.7 |
45.3 |
48.7 |
3.4 |
16.8 |
19.1 |
2.3 |
|
Yamalo-Nenets AO |
46.4 |
45.5 |
-0.9 |
38.4 |
38.4 |
0 |
15.2 |
16.1 |
0.9 |
|
Tyva Republic |
35.4 |
34.6 |
-0.8 |
44.3 |
42.5 |
-1.8 |
20.3 |
22.9 |
2.6 |
|
Sakha Republic (Yakutia) |
36.2 |
35.8 |
-0.4 |
41.9 |
41.8 |
-0.1 |
21.9 |
22.4 |
0.5 |
|
Kamchatka Krai |
37.3 |
39.2 |
1.9 |
41.2 |
46 |
4.8 |
21.5 |
14.8 |
-6.7 |
|
Magadan Oblast |
41.3 |
35.7 |
-5.6 |
39.4 |
47.2 |
7.8 |
19.3 |
17.1 |
-2.2 |
|
Sakhalin Oblast |
27.3 |
31.8 |
4.5 |
44.6 |
46.5 |
1.9 |
28.1 |
21.7 |
-6.4 |
|
Chukotka AO |
35.3 |
25.6 |
-9.7 |
48.4 |
67.9 |
19.5 |
16.3 |
6.5 |
-9.8 |
Wages and labor market tension indicators
The migration growth and employment figures mentioned above indirectly characterize labor markets. Direct indicators of the labor market state are wage dynamics and a number of indicators that provide an idea of how easy or difficult it is to find a job in a given local labor market. These include the overall unemployment rate, the average job search time, and the share of longterm unemployed in the total unemployed. If we consider local labor market indicators in terms of migration, we can say that when deciding to move to a new city or region, workers focus on how easy it is to find a job there and how much they can earn compared to labor markets in other regions. Therefore, migration and employment rates are consequences of individual decisions based on their perception of the state of labor markets; they reflect the state of labor demand in the lo- cal labor market. Since living in and/or relocating to northern territories with challenging natural and climatic conditions requires significantly better employment conditions compared to other local labor markets, we will not analyze the dynamics of labor market indicators as such, but will compare them with the average Russian values.
High wages have been a factor attracting workers to northern cities and regions since Soviet times, but for over twenty years, the ratio between wages in the northern and other regions of the Russian Federation has been shifting in favor of the latter [4]. Fig. 6 shows the ratio of the average monthly nominal accrued wages of workers in organizations in the Far North and equivalent areas and the Arctic zone of the Russian Federation to the same indicator for the Russian Federation as a whole.
1.9
1.8
1.7
1.6
1.5
1.4
1.3
1.2
1.1
нш


-
■ Far North ■ Arctic
Fig. 6. Ratio of the average monthly nominal accrued wage of employees in organizations in the corresponding constituent entity to the same indicator for the Russian Federation as a whole 6.
It can be seen that during the period 2019–2023, average wages in the North and the Arctic have become even closer to the national average. We compared the ratio of the average monthly accrued wage in the respective constituent entity of the Russian Federation to the national average (Table 3) and the ratio of the average monthly accrued wage in the respective constituent entity of the Russian Federation to the regional subsistence minimum for the working-age population (Table 4). It is worth noting that in three constituent entities of the Russian Federation (Arkhangelsk Oblast (excluding NAO), Republic of Karelia, and Republic of Tyva), the average wage in 2023 was below the national average (in 2019, this was only the case in the Republic of Tyva). Overall, in 2023, the average wage increased relative to the national average compared to 2019 only in the Chukotka Autonomous Okrug, Yamalo-Nenets Autonomous Okrug, Magadan Oblast, Sakhalin Oblast, and Khanty-Mansi Autonomous Okrug – Yugra. In the remaining regions, this indicator decreased (Table 3), meaning these regions have become less attractive for employment than others. If we normalize the average regional wage by the subsistence minimum for the work- ing-age population (Table 4), then, conversely, in 2023 compared to 2019, this ratio increased in most regions, with the exception of Sakhalin Oblast, Nenets Autonomous Okrug, and Chukotka Autonomous Okrug. The results described can be interpreted as follows: in terms of wage dynamics, most northern regions have become less attractive to migrants, while the standard of living of those already residing there has improved. In three regions — the Yamalo-Nenets and Khanty-Mansi Autonomous Okrugs and the Magadan Oblast — both analyzed indicators increased (Table 3, Table 4).
Table 3 Ratio of average monthly accrued wages in the corresponding constituent entity of the Russian Federation to the national average
|
Place |
2019 |
2023 |
||
|
1 |
Chukotka AO |
1.93 |
Chukotka AO |
2.13 |
|
2 |
Kamchatka Krai |
1.83 |
Yamalo-Nenets AO |
1.94 |
|
3 |
Nenets AO |
1.78 |
Magadan Oblast |
1.80 |
|
4 |
Magadan Oblast |
1.76 |
Kamchatka Krai |
1.60 |
|
5 |
Sakha Republic (Yakutia) |
1.54 |
Nenets AO |
1.59 |
|
6 |
Murmansk Oblast |
1.48 |
Sakhalin Oblast |
1.53 |
|
7 |
Yamal-Nenets AO |
1.44 |
Sakha Republic (Yakutia) |
1.47 |
|
8 |
Khanty-Mansi AO - Yugra |
1.38 |
Khanty-Mansi AO - Yugra |
1.44 |
|
9 |
Sakhalin Oblast |
1.33 |
Murmansk Oblast |
1.32 |
|
10 |
Republic of Karelia |
1.26 |
Komi Republic |
1.04 |
|
11 |
Komi Republic |
1.25 |
Arkhangelsk Oblast (excl. NAO) |
0.97 |
|
12 |
Arkhangelsk Oblast (excl. NAO) |
1.17 |
Republic of Karelia |
0.87 |
|
13 |
Tyva Republic |
0.92 |
Tuva Republic |
0.77 |
Table 4
Ratio of average monthly accrued wages in the corresponding constituent entity of the Russian Federation to the regional subsistence minimum for the working-age population
|
Place |
2019 |
2023 |
||
|
1 |
Yamalo-Nenets AO |
5.92 |
Yamalo-Nenets AO |
6.36 |
|
2 |
Sakhalin Oblast |
5.55 |
Sakhalin Oblast |
5.37 |
|
3 |
Chukotka AO |
4.70 |
Khanty-Mansi AO - Yugra |
5.05 |
|
4 |
Khanty-Mansi AO - Yugra |
4.61 |
Magadan Oblast |
4.94 |
|
5 |
Magadan Oblast |
4.57 |
Sakha Republic (Yakutia) |
4.66 |
|
6 |
Nenets AO |
4.19 |
Kamchatka Krai |
4.16 |
|
7 |
Sakha Republic (Yakutia) |
4.03 |
Nenets AO |
4.08 |
|
8 |
Kamchatka Krai |
3.72 |
Komi Republic |
4.08 |
|
9 |
Murmansk Oblast |
3.64 |
Chukotka AO |
4.06 |
|
10 |
Tuva Republic |
3.64 |
Arkhangelsk Oblast (excl. NAO) |
3.99 |
|
11 |
Komi Republic |
3.62 |
Murmansk Oblast |
3.86 |
|
12 |
Arkhangelsk Oblast (excl. NAO) |
3.57 |
Tuva Republic |
3.65 |
|
13 |
Republic of Karelia |
2.89 |
Republic of Karelia |
3.32 |
Next, let us examine how easy it has become to find work in the labor markets of the northern territories. The overall unemployment rate (measured using ILO methodology) in 2023 decreased compared to 2019 in all analyzed constituent entities of the Russian Federation (Fig. 7), with this trend being particularly pronounced in Republic of Tyva, Sakhalin Oblast, Chukotka Autonomous Okrug, Karelia and Komi Republics. The highest unemployment rate in both 2019 and 2023 was in Republic of Tyva, followed by Nenets Autonomous Okrug.
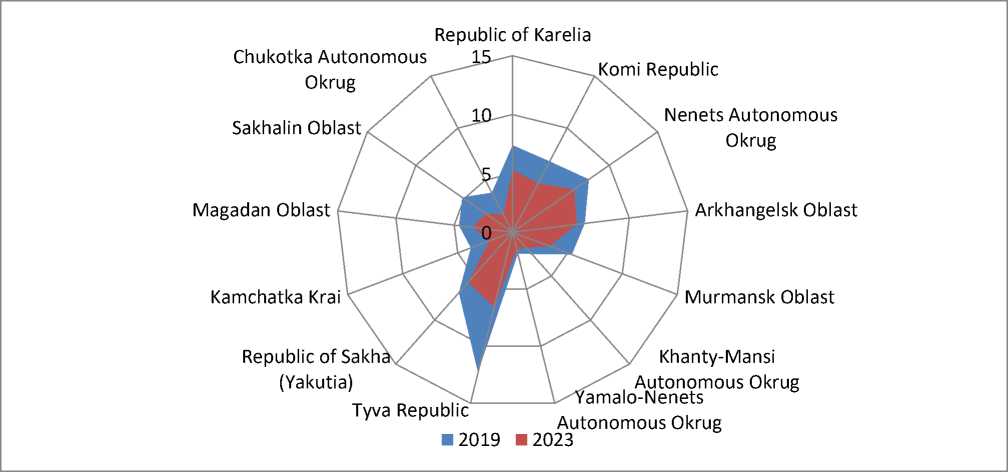
Fig. 7. Overall unemployment rate, % 7.
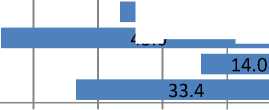
In terms of the “proportion of unemployed people looking for work for 12 months or more” indicator, the situation in 2023 changed significantly compared to 2019 in many of the Russian regions analyzed (Fig. 8). In 2019, this indicator exceeded the national average in seven regions (Arkhangelsk and Murmansk Oblasts, Nenets Autonomous Okrug, Republics of Sakha (Yakutia), Karelia, Tyva, and Komi), while in 2023 — only four (Republics of Karelia, Tyva, and Komi, and Magadan Oblast). In 2023, unemployed people began finding work more quickly in almost all of the regions analyzed, except for Yamalo-Nenets Autonomous Okrug, Magadan Oblast, and Komi Republic. The share of unemployed people seeking work for 12 months or more was less than 10% in 2019 only in Yamalo-Nenets Autonomous Okrug, and in 2023, it was the same in Yamalo-Nenets Autonomous Okrug, Khanty-Mansi Autonomous Okrug – Yugra, and Sakhalin Oblast (Fig. 8).
17.7 2.4
5.1
21.6
24.8
25.6
27.0
19.1
26.8
17.9
I 23.8
26.6
45.0
6.5
7.6
11.1
11.7
12.2
12.6
16.2
16.4
16.4zu
17.2ш
29.9
33.4
34.5
Khanty-Mansi Autonomous Okrug Yamalo-Nenets Autonomous Okrug Sakhalin Oblast
Arkhangelsk Oblast
Nenets Autonomous Okrug Republic of Sakha (Yakutia) Kamchatka Krai
Murmansk Oblast
Chukotka Autonomous Okrug
Russian Federation
Republic of Karelia
Tyva Republic
Magadan Oblast
Komi Republic
50.0 40.0 30.0 20.0 10.0 0.0 10.0 20.0 30.0 40.0
■ 2019
■ 2023
Fig. 8. Share of unemployed people looking for work for 12 months or more, % 8.
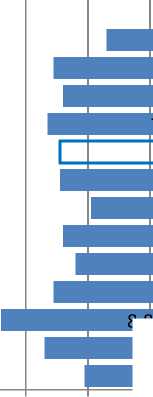
The average job search time for unemployed people in most of the analyzed regions also decreased in 2023 compared to 2019 (Fig. 9), with the exception of Yamalo-Nenets Autonomous
Okrug, Kamchatka Krai, Chukotka Autonomous Okrug, Komi Republic, and Magadan Oblast. The shortest average job search time for unemployed people in both 2019 and 2023 was in Yamalo-Nenets Autonomous Okrug and Khanty-Mansi Autonomous Okrug – Yugra. It is worth noting that the average job search time for unemployed people in 2023 also decreased across the Russian Federation as a whole compared to 2019, which could be caused, for example, by labor shortages. Moreover, while in 2019 the job search lasted longer than the Russian average in five regions (Sakhalin Oblast, Nenets Autonomous Okrug, Republics of Sakha (Yakutia), Tyva, and Komi), in 2023 this figure had increased to eight regions: Republics of Karelia, Tyva, Komi, Kamchatka Krai, Mur- mansk and Magadan Oblasts, and Chukotka and Nenets Autonomous Okrugs. The absolute values of this indicator also varied significantly between the northern regions in both 2019 and 2023 — the ratio of the highest to the lowest value was approximately three times (Fig. 9).
8.8
2.8
5.4
7.1
6.8
7.3
6.9
6.9
5.9
6.8
6.4
7.1
7.4
6.1
3.1
3.1 ■
4.1ц
5.2
5.5
5.8
6.1
6.2
6.6
6.7
7.4
7.9
8.4
Yamalo-Nenets Autonomous Okrug Khanty-Mansi Autonomous Okrug Sakhalin Oblast
Arkhangelsk Oblast
Republic of Sakha (Yakutia) Russian Federation
Republic of Karelia
Kamchatka Krai
Murmansk Oblast
Chukotka Autonomous Okrug Nenets Autonomous Okrug Tyva Republic
Komi Republic
Magadan Oblast
10.0 8.0 6.0 4.0 2.0 0.0 2.0 4.0 6.0 8.0 10.0
-
■ 2019 ■ 2023
Fig. 9. Average job search time for unemployed people, months 9.
Thus, from 2019 to 2023, the labor markets of the northern territories remained highly heterogeneous by many indicators. A positive trend can be seen in the reduction of overall unemployment in all regions analyzed and the average job search time for unemployed people in most of the labor markets. The most favorable labor markets are in the autonomous mining okrugs — Khanty-Mansi AO – Yugra, Yamalo-Nenets AO, Chukotka AO, and Nenets AO. The Khanty-Mansi Autonomous Okrug – Yugra is the absolute leader in terms of aggregate indicators and their dynamics. It is also the largest northern labor market by capacity — over 20% of all workers in the Far North and equivalent areas were employed there during the period under review. The labor market in the Yamalo-Nenets AO is also functioning consistently well, but some negative dynamics in job search indicators should be noted. The labor markets of the Chukotka and Nenets Autonomous Okrugs are small in size, but they are of great importance for the development of the northern territories and showed positive dynamics across most indicators, resulting in increased net migration. The old northern industrial regions of Murmansk and Arkhangelsk Oblasts demonstrated small absolute values, but positive trends. In the Murmansk Oblast, the educational and age structure of the employed population improved. The Republic of Tyva, which has historically demonstrated extremely low values and negative trends, deserves special mention. In 2019–2023, although the Republic of Tyva remained one of the economically depressed regions, it showed positive dynamics across a range of indicators, including a reduction in labor market tensions. Meanwhile, the Komi Republic, on the contrary, worsened its position across almost all indicators. The Magadan Oblast also showed some negative trends: while wages remained relatively high compared to other regions, the period of job search increased here in 2019–2023.
Conclusion
The relatively short but very important period of 2019–2023 was characterized by high instability in the economies and labor markets of many regions and countries. The labor markets of the northern territories are quite flexible at any given time; employment there is highly variable and depends on labor demand, both in the North and in the rest of the country. In 2019–2023, there were periods of migration-driven population growth in the Far North and equivalent areas, as well as in the Arctic zone of the Russian Federation, which indicates that these territories are sufficiently attractive, primarily in terms of labor markets and employment conditions. A more detailed analysis of regional labor markets in the northern territories revealed that, despite persistent large gaps in the indicators describing their functioning, the trends in these indicators were positive in many regions. Positive changes primarily concern indicators of labor market tension: overall unemployment and the time it takes for the unemployed to find work. The only exception is the Komi Republic, where both the proportion of unemployed people looking for work for 12 months or more and the average time it takes for the unemployed to find work increased.
Negative trends in terms of the functioning of labor markets in the northern territories include a decline in the ratio between the average wage in the North and the national average. This trend has been ongoing for several decades and is one of the main reasons for the outflow of population from northern and Arctic regions. It may also be the reason for the deterioration in the educational and age structure of the workforce in most of the regions under consideration, which reduces their labor potential. At the same time, in the vast majority of northern regions, the ratio of the average monthly accrued wage in the respective constituent entity of the Russian Federation to the regional subsistence minimum of the working-age population has improved, indicating a slight increase in the standard of living of the population living there.
