Level of development of scientific and education environment in Russian regions

Author: Golovchin Maksim Aleksandrovich, Solovyova Tatyana Sergeyevna
Journal: Economic and Social Changes: Facts, Trends, Forecast @volnc-esc-en
Section: Young researchers
Article in issue: 5 (23) т.5, 2012.
Free access
The article describes the state of modern scientific-educational complex in Russian regions. It evaluates the RF subjects according to the authors’ methodology of calculating the integral index of the territories’ scientific and education environment development. Besides, the article proposes the grouping of the regions which allows for determining the main directions of Russia’s scientific and education environment development.
Education, science, scientific and education environment, integral assessment of the regions
Short address: https://sciup.org/147223388
IDR: 147223388 | UDC: 332.143:373(470.12)
Text of the scientific article Level of development of scientific and education environment in Russian regions
In the modern world, education and science are the most important social institutions, which are able to respond swiftly to social changes and become direct participants of the process of extended reproduction and increase of its efficiency. In the course of the interaction and integration of scientific and educational spheres, the innovation potential is accumulating, and people develop the abilities to generate and transform new knowledge.
The importance of highlighting the issues of interaction between science and education has led to the necessity of using the concept “scientific-educational environment”.
According to our viewpoint, scientific-educational environment is the set of actively interacting (within a certain geographic space) subjects of scientific, educational and cultural spheres, business community, based on the institutional and (or) information integration, aimed at building human and intellectual potential of the territory.
Scientific-educational environment consists of four interrelated components:
-
1) teaching – educational institutions, post-graduate studies, doctoral studies, corporate universities;
-
2) cultural-educational – research libraries, science foundations, museums, etc.;
-
3) research – establishments, carrying out exploratory, fundamental and applied research;
-
4) application – information and advisory centres, innovation centres, business-incubators, technology transfer centres, scientific and technical information centres, etc. (fig. 1) .
Formation of an efficient scientific-educational environment in foreign countries takes place through mechanisms such as the creation of a network of domestic markets for scientific research, development of “centres of expertise”, the use of instruments of direct and indirect support of scientists, the alliance of the leading universities with industry complexes and science centres.
The necessity of development and state support of integration processes in the sphere of science and education in our country has been legally established relatively recently. Decrees of the RF President “On the doctrine of development of the Russian science” No. 884 dated June 13 1996 and No. 903 “On state support of integration of higher education and fundamental science” officially recognized the integration of science and education as one of the most important directions, ensuring the preservation and development of these spheres, as well as the principle of the state policy in the field of science and technology.
At present, the guidelines of the RF scientific-educational environment development are contained in a whole range of legislative and programme documents. The main goals set out in these documents, include:
-
1. Creation of conditions for all children to obtain the constitutional rights to receive general secondary education.
-
2. Comprehensive and timely development of children and young people, their creative abilities, improvement of work with gifted children and young people.
-
3. Organization of educational process, with regard to modern scientific achievements, ensuring the high quality of education based on the development of its material base and the establishment of appropriate social conditions, training of highly educated people, capable of career promotion and mobility in professions.
-
4. Development of the personnel potential in the sphere of science, education, technology and innovations, creation of conditions for the efficient activity of scientists, teachers, all the participants of the scientific and educational process.
Figure 1. Components of scientific-educational environment
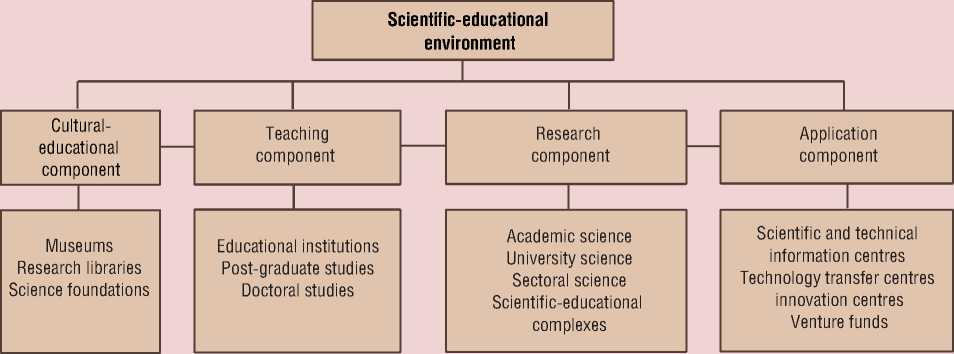
Source: Leonidova G.V. Integration of science, education, business as a solution to the strategic objectives in the training of skilled specialists. Proceedings of inter-regional scientific-practical conference “Formation of management personnel reserve: regional experience”. Available at:
-
5. Creation of programmes for implementation of information technologies in education, the transparency of education system and educational institutions for public control.
-
6. Promotion of healthy lifestyle among children and adolescents.
-
7. Increase of educational institutions funding, promotion of non-governmental investments into the education system.
-
8. Formation of a balanced and sustainably developing R&D sector.
-
9. Increase of innovation activity of business and the overall support of new innovation companies.
-
10. Broad introduction of innovation technologies in the activity of government authorities.
-
11. Provision of transparency of the national innovation system and economy, as well as the integration of Russia into the global processes of creating and using innovations.
-
12. Facilitating the activities for implementing the innovation policy, carried out by state authorities of the subjects of the Russian Federation and municipal entities1.
To achieve these goals at the federal and regional level, in recent years, a complex of modernization activities has been carried out, such as the development of science towns, technology parks; the transition of higher education to the two-level system; introduction of unified state exam and new educational standards in schools, normative financing of education and the new system of salaries for teachers; optimization of educational institutions network [3, p. 23].
However, implementation of these activities is considerably hampered by the fact that the
RF subjects are strongly differentiated by their financial, material, technical, personnel capabilities for the development of scientific-educational environment. So, the analysis of the 2010 state statistics data showed that scientific-educational environment is characterized by the following:
-
– significant differences in the financing of education : the largest share of expenses on education is found in the Republic of Tyva (33% of the total consolidated budget expenditures), the smallest – in the Primorsky Krai (9%);
– different degree of pre-school education availability : the greatest share of children attending pre-school education establishments is found in the Voronezh Oblast (86% of the number of children of the relevant age), the lowest – in the Chukotka Autonomous Okrug (9%);
– significant differences in the financing of science and scientific research : the greatest volume of expenditures is in Moscow (2.7% of the GRP), the smallest – in the Republic of Ingushetia (0.09 %);
– differences in the innovation activity of enterprises and organizations : the highest is in the Belgorod Oblast (13%), the lowest - in the Stavropol Krai (0.8%).
In this regard, greater importance is attached to the application of assessment methodologies enabling to identify and track the main trends in education and science development, to adjust the RF subjects positions in this sphere, to form the sound motivated policy of executive authorities aimed at strengthening and supporting the personnel and scientific and innovation potential of the territories. The present article contains the results of the work on the assessment of the RF regions by the level of development of scientific-educational environment, which was carried out at the Institute of Socio-Economic Development of Territories of the Russian Academy of Sciences.
Table 1. Blocks of indicators of the level of development of scientific-education environment of the RF regions
|
Block “Education” (9 indicators) |
Block “Science” (5 indicators) |
|
Regions’ consolidated budget expenditures on education, in % of the total budget expenditures Average monthly salaries of workers of educational institutions, in % of the average monthly nominal gross payroll Involvement of children from 1 to 6 years old in pre-school education, % Number of children per 100 places at pre-school educational institutions, pers. Number of personal computers per 100 students of educational institutions, units Production of workers and specialists by the institutions of initial vocational education per 10 thousand of population, pers. Production of specialists by the institutions of secondary vocational education per 10 thousand of population, pers. Production of specialists by the institutions of higher professional education per 10 thousand of population, pers. Share of high school graduates who got 100 points for the unified state exam, % of the total number of USE participants |
Number of employees engaged in R&D per 10 thousand of population, pers. Domestic expenditures on R&D,% of GRP Issuance of patents for inventions and useful models, per 1 employee engaged in R&D Number of organizations using information and telecommunication technologies, % of the total number of organizations Share of innovation-active organizations, % of the total number of organizations |
The assessment was carried out on the basis of 14 indicators, which were combined in two thematic blocks (tab. 1) .
Accordingly, the following requirements were taken into account:
-
1) priority of solving the target state tasks and the implementation of activities aimed at science and education development;
-
2) comprehensiveness , i.e. the possibility of analyzing the whole range of education and science development problems;
-
3) systemic character , i.e. taking into account both internal relationships and interdependencies and external factors and positions, influencing the state of science and education;
-
4) commensurability of the economic and social components of the assessment;
-
5) compatibility of indicators with the current system of accounting, statistics and forecasting.
Moreover, it should be noted that this system can be flexible, it can be completed depending on the demographic, social and economic conditions.
In order to define the estimation parameters, the method of multivariate comparative analysis was applied, based on the method of Euclidean distances2. This method made it possible to take into account not only the absolute values of indicators for each municipality, but also the degree of their correspondence to the standard indicator.
The calculation of the estimated indices was carried out for each region of the Russian Federation for 2010 according to 2 options.
The first option used the threshold value for Russia (maximum – if the indicator reflects the positive phenomena, minimum – if the indicator reflects the negative phenomena) as the standard indicator.
In the second option used the average value for the Russian Federation as the standard indicator.
Integrated index of scientific and education environment development for both options assumed the allocation of five groups of regions according to the development level: 1) high; 2) above average; 3) average; 4) below average; 5) low (tab. 2) .
Table 2. Quantitative values of the assessment of scientific-education environment development level
|
Group No. |
Level |
Interval |
|
|
1 option* |
2 option** |
||
|
1 |
High (15% of the regions with the highest values of indicators) |
Over 0.45 |
Over 2.18 |
|
2 |
Above average |
From 0.45 to 0.39 |
From 2.18 to 1.41 |
|
3 |
Average |
From 0.38 to 0.34 |
From 1.40 to 1.0 |
|
4 |
Below average |
From 0.33 to 0.31 |
From 1.0 to 0.89 |
|
5 |
Low (15% of the regions with the lowest values of indicators) |
Less than 0.31 |
Less than 0.89 |
|
* The maximum (minimum) values for Russia were adopted as the standard indicator. ** The average values for Russia were adopted as the standard indicator. |
|||
In the ranging, the unequal, progressively increasing values of intervals were used, which is appropriate when the values of the studied characteristic vary irregularly and considerably.
The ranging according to the first option of calculations shows that the highest development level of scientific-education environment has been achieved in Moscow (0.58 units; fig. 2 ). This is due to the high level of expenditures on education and science, allowing to develop the material base and personnel potential of these spheres, to maintain the high quality of their work.
The Vologda Oblast belongs to the group of regions with the level of development of scientific-education environment below average, it outruns its neighbors in the NorthWest Federal District – the Republic of Karelia (by 0.05 points) and the Kaliningrad Oblast (by 0.07 points). Due to the absence of a highly developed scientific and innovation infrastructure, the oblast lags significantly (by 47%) behind the leader, the city of Moscow. It should be noted that an important strategic advantage of the Vologda Oblast consists in the significant number of specialists with higher education (137 people per 10 thousand of population). However this advantage is not supported by the demand for such specialists in the labor market (in 2009, at the oblast’s enterprises and organizations only 48% of the population worked within the specialty received in the educational institution)3.
The lowest level of education development is revealed in the southern republics – Ingushetia and Chechnya (0.17 and 0.13 points, respectively). The development of science and education in these areas is characterized by the insufficient amount of computers in schools (2 units per 100 pers.), critically low share of public expenditures on science (0.14% of GRP) and low innovation activity of organizations (0.4%).
Calculations made according to the first option, revealed a significant differentiation of the resulting indices. Thus, the greatest value of the index, as it was noted, amounted to 0.58 points (Moscow), while the smallest – 0.13 points. (Republic of Ingushetia). This can be explained by the special position of Moscow, which shows the highest values for all indicators of the development of scientific-education environment. This confirms the appropriateness of using the average values for the Russian Federation as the standard indicator.
In the group, created using the average values for Russia as the standard indicator when calculating the integral indices (the second option), a high development level of scientific-education environment can be observed in
Figure 2. Arrangement of the RF regions according to the composite index of the development level of scientific and education environment (the first option)
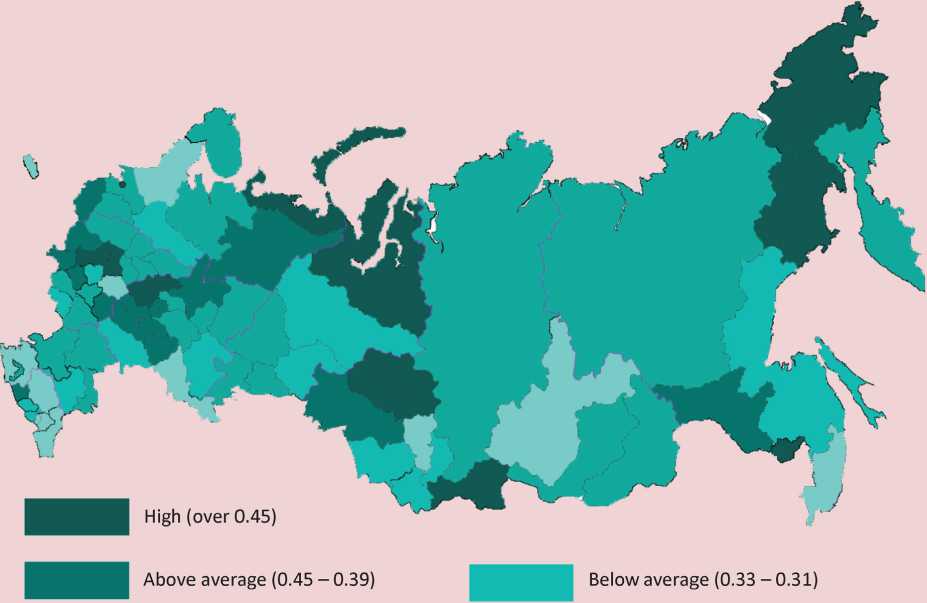
Average (0.38 - 0.34) Low (less than 0.30)
Source: authors’ calculations.
Moscow, the Yamalo-Nenets Autonomous Okrug, Saint-Petersburg, the Republics of Mari El and Chuvashia, the Tomsk, Moscow, Lipetsk, Kaluga, Oryol, Kostroma Oblasts, the Nenets Autonomous Okrug (fig. 3) . According to the integral index, Moscow is well ahead of all the other Russian regions (the difference with Saint-Petersburg is 32%).
A comparison with an average Russian level improved the position of the Vologda Oblast, which had moved into the group with an average level of development of scientific-education environment. The Southern republics – Dagestan, Chechnya, Ingushetia retained their positions in the group with the low values of the integral index (see supplement) (tab. 3) .
Thus, the territorial disproportions in the development of science and education remain a very acute problem in Russia. Overcoming these imbalances is possible, if in the future development, the regions will be guided by the level of territories with well-developed scientific-education environment.
Thus, according to the estimates, the Chuvash Republic, the Oryol and Belgorod Oblasts have significant possibilities of transition into the group with high level of development of scientific-education environment; the Kursk, Pskov, Kurgan, Sverdlovsk Oblasts, the Republics of Mari El, Sakha (Yakutia) – into the group with the level above average.
Figure 3. Grouping of the RF regions according to the integral index of the development level of scientific-education environment (second option)
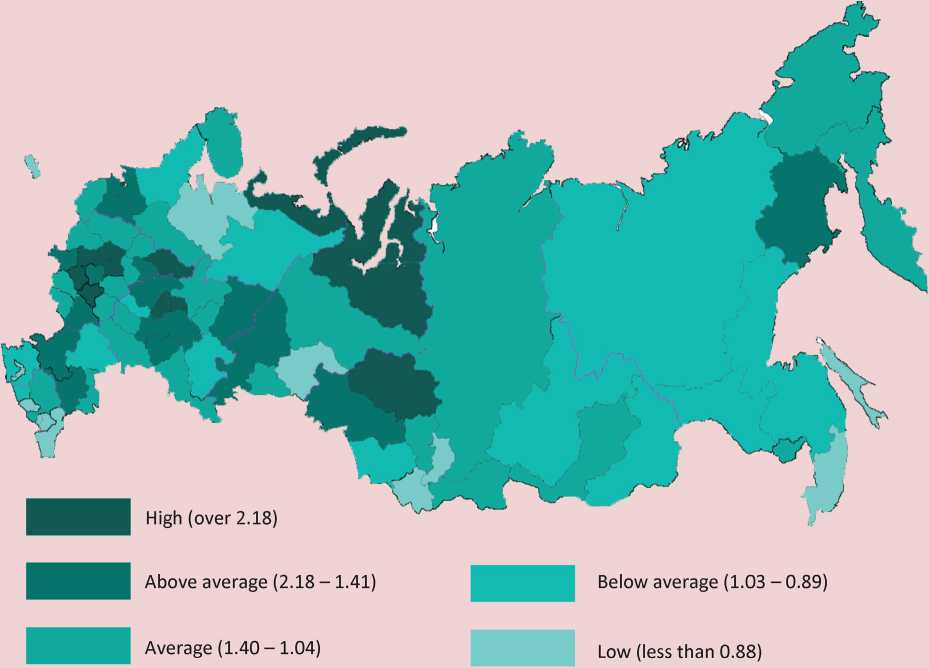
Source: authors’ calculations.
Integral indicators of these territories are very close to the threshold values of the groups with high and lower than average levels.
For the implementation of such a transition, it is necessary to adopt certain effective measures.
In the sphere of education they include first of all:
-
• control over the proper implementation of the Decree of the RF President “On the measures for realization of the state social policy” dated 7 May 2012 No. 597 in the part of bringing the salaries of education workers in 2012 to the average regional salary;
-
• increasing the accessibility of education through the development of its variant forms;
-
• inclusion of indicators characterizing the equality of access to high-quality education into the system of indicators estimating the efficiency of activities of executive authorities and local self-government bodies.
In the field of science and innovations of primary importance are such areas of activity as:
-
> expansion of the activities of state funds for support of science;
-
> promotion of the wide-scale innovations in all sectors of the economy through the systematization of the tax privileges in the innovation sphere and improvement of their administration;
-
> development of programmes of support of wide-scale scientific and technical creativity and innovation entrepreneurship.
Table 3. Values of integral indicators of the development level of scientific and education environment in the RF subjects in 2010 (the second option of calculations: the average value in the Russian Federation is considered 1.0)
|
RF Subjects |
Indicator values |
RF Subjects |
Indicator values |
RF Subjects |
Indicator values |
|
Russian Federation |
1.0 |
||||
|
First group (high indicator value) |
Third group (average indicator value) |
Fourth group (indicator value below average) |
|||
|
Moscow |
3.84 |
Vladimir Oblast |
1.4 |
Karachayevo-Cherkess Republic |
0.97 |
|
Yamalo-Nenets Autonomous Okrug |
3.4 |
Penza Oblast |
1.4 |
Republic of Mordovia |
0.97 |
|
Saint Peterburg |
2.6 |
Kursk Oblast |
1.39 |
Volgograd Oblast |
0.96 |
|
Mari El Republic |
2.57 |
Republic of Tyva |
1.38 |
Republic of Bashkortostan |
0.96 |
|
Tomsk Oblast |
2.51 |
Kemerovo Oblast |
1.37 |
Republic of Sakha (Yakutia) |
0.96 |
|
Moscow Oblast |
2.5 |
Tambov Oblast |
1.36 |
Khabarovsk Krai |
0.96 |
|
Lipetsk Oblast |
2.44 |
Astrakhan Oblast |
1.35 |
Krasnodar Krai |
0.95 |
|
Kaluga Oblast |
2.41 |
Kirov Oblast |
1.35 |
Omsk Oblast |
0.95 |
|
Chuvash Republic |
2.33 |
Pskov Oblast |
1.34 |
Republic of Kareila |
0.93 |
|
Nenets Autonomous Okrug |
2.29 |
Yaroslavl Oblast |
1.33 |
Zabaikalsky Krai |
0.93 |
|
Oryol Oblast |
2.24 |
Murmansk Oblast |
1.33 |
Altai Krai |
0.92 |
|
Kostroma Oblast |
2.21 |
Vologda Oblast |
1.29 |
Irkutsk Oblast |
0.89 |
|
Second group (indicator value above average) |
Republic of Udmurtia |
1.28 |
Fifth group (low indicator value) |
||
|
Samara Oblast |
2.18 |
Orenburg Oblast |
1.23 |
Arkhangelsk Oblast |
0.88 |
|
Nizhny Novgorod Oblast |
2.12 |
Saratov Oblast |
1.21 |
Kaliningrad Oblast |
0.87 |
|
Bryansk Oblast |
2.07 |
Belgorod Oblast |
1.2 |
Kabardino-Balkar Republic |
0.87 |
|
Magadan Oblast |
2.01 |
Tver Oblast |
1.2 |
Altai Republic |
0.87 |
|
Perm Krai |
1.88 |
Chukotka Autonomous Okrug |
1.18 |
Republic of Adygea |
0.86 |
|
Ulyanovsk Oblast |
1.76 |
Stavropol Krai |
1.15 |
Tyumen Oblast |
0.86 |
|
Ivanovo Oblast |
1.69 |
Republic of Buryatia |
1.14 |
Primorsky Krai |
0.86 |
|
Novosibirsk Oblast |
1.67 |
Krasnoyarsk Krai |
1.14 |
Republic of Dagestan |
0.84 |
|
Republic of Kalmykia |
1.66 |
Ryazan Oblast |
1.09 |
Republic of Khakassia |
0.83 |
|
Chelyabinsk Oblast |
1.59 |
Republic of North Ossetia – Alania |
1.09 |
Sakhalin Oblast |
0.79 |
|
Novgorod Oblast |
1.54 |
Kurgan Oblast |
1.09 |
Republic of Ingushetia |
0.58 |
|
Leningrad Oblast |
1.51 |
Jewish Autonomous Oblast |
1.06 |
Chechen Republic |
0.46 |
|
Rostov Oblast |
1.51 |
Smolensk Oblast |
1.05 |
||
|
Republic of Tatarstan |
1.44 |
Khanty-Mansi Autonomous Okrug – Yugra |
1.04 |
||
|
Voronezh Oblast |
1.43 |
Kamchatka Krai |
1.04 |
||
|
Tula Oblast |
1.41 |
Amur Oblast |
1.02 |
||
|
Sverdlovsk Oblast |
1.41 |
Republic of Komi |
1.01 |
||
References Level of development of scientific and education environment in Russian regions
- Bakhtizin A.R., Akinfeyeva E.V. Comparative estimation of innovation potential of Russian Federation regions. Studies on Russian Economic Development. 2010. No. 3. P. 73.
- Beketov N.V. Science in Russia and in the world. ECO -All-Russia economic journal. 2003. No. 11. P. 12-22.
- Brekhova T.B. Key trends of innovation and educational processes in Russia. Education and society. 2012. No. 2 (73). P. 19-23.
- Kovaleva N.V., Kuznetsova V. I., Nechayeva E.G. Informational-analytical system of ranking the regions according to the indicators of education development: methodology and results of the experiment. Part 2. Journal of educational studies. 2008. No 1. P. 210-239.
- Leonidova G.V., Golovchin M.A., Solovyova T.S., Gutnikova E.A. Integrated assessment of the development of educational systems on the municipal level. Under the general editorship of Doctor of Economics A.A. Shabunova. Vologda: ISEDT RAS, 2012. 72 p.
- Leonidova, G.V. Integration of science, education, business as the solution of strategic tasks in the training of qualified specialists. Materials of inter-regional scientific-practical conference “Formation of a management personnel reserve: regional experience”. Available at: http://www.ags-vologda.ru (access date: 31 May 2012).
- Science of Russia in figures: statistical book. Moscow: Centre for Science Research and Statistics, 2004.
- National educational initiative “Our new school”. Available at: http://mon.gov.ru/dok/akt/6591/(access date: 31 May 2012).
- Official data portal of the unified state exam. Available at: http://ege.edu.ru (access date: 31 May 2012).
- Regions of Russia. Socio-economic indicators. 2011: stat. book. Moscow: Rosstat, 2011.
- Russian innovation index. Ed. by L.M. Gokhberg. Moscow: National Research University “Higher school of economics”, 2011.
- Russian statistical yearbook. 2011. -Moscow: Rosstat, 2011.
- Strategy for innovation development of the Russian Federation for the period up to 2020 (approved by the Decree of the Government of the Russian Federation No. 2227-R dated 8 December 2011).
- The strategy-2020: the new model for growth -the new social policy. The final report on the results of the experts’ work on the relevant issues of the socio-economic strategy of Russia for the period up to 2020. Available at: http://2020strategy.ru/(access date: 31 May 2012).
- Federal target programme of education development for 2011 -2015. (approved by the Decree of the Government of the Russian Federation No. 61 dated 7 February 2011).
