Long-bone growth in the Bronze Age skeletal population of Gonur-Depe, Turkmenistan

Author: Kufterin V.V.
Journal: Archaeology, Ethnology & Anthropology of Eurasia @journal-aeae-en
Section: Anthropology and paleogenetics
Article in issue: 1 т.47, 2019.
Free access
Short address: https://sciup.org/145145410
IDR: 145145410 | DOI: 10.17746/1563-0110.2019.47.1.147-156
Text of the article Long-bone growth in the Bronze Age skeletal population of Gonur-Depe, Turkmenistan
Since the study by F. Johnston (1962) on long bones’ longitudinal growth rate in the sample from Indian Knoll (Kentucky, USA) was published, the number of works focusing on the analysis of skeletal growth and development in various past populations has grown to several dozen (Armelagos et al., 1972; Y’Edynak, 1976; Merchant, Ubelaker, 1977; Mensforth, 1978; Stloukal, Hanakova, 1978; Sundick, 1978; Hummert, Van Gerven, 1983; Molleson, 1989; Lovejoy, Russel, Harrison, 1990; Wall, 1991; Hoppa, 1992; Robles et al., 1992; Saunders, Hoppa, Southern, 1993; Ribot, Roberts, 1996; Piontek, Jerszynska, Segeda, 2001; Schillaci et al., 2011; Pinhasi et al., 2014; and others). Similar publications in the Russian language are still not as numerous (Fedosova, 1997, 2003 (see for a review of foreign publications up until 1994); Tur, Rykun, 2006; Kufterin, 2012, 2015, 2016b; Kufterin, Nechvaloda, 2016). This field of research was named “paleoauxology” by Hoppa (2000) and Tillier (2000), but this (quite appropriate) term has not been widely used so far.
Most of the works on longitudinal growth in skeletal samples are based on the comparison between empirical results for an ancient sample and modern growth standards. The most popular modern reference is the growth charts for a sample of roentgenograms of Caucasoid children and adolescents published by M. Maresh (1955, 1970;
Fedosova, 2003). Using such an approach, it is possible to unify the growth rates of various bones and thus enlarge sample size (Fedosova, 2003: 526; Goode, Waldron, Rogers, 1993; Sciulli, 1994). Some authors assess the rate of postcranial growth by comparing sub-adults’ values with those in adults of the same population (see (Mensforth, 1978; Lovejoy, Russel, Harrison, 1990)). The femur is used in most ontogenetic studies (Israelsohn, 1960), since this skeletal element is thought to be the most “adequate” in reflecting environmental effects (Bogin et al., 2002). It is also typically the most numerous and well-preserved bone in skeletal samples (Agnew, Justus, 2014: 190). However, other long bones are employed in many studies as well.
A delay in growth and development rates as compared to modern standards is typical for skeletal populations (Fedosova, 2003: 529), and is most often explained by a complex influence of negative environmental factors, including nutritional stress. Such an explanation is based on the positive relationship between economic status of a population and sub-adult growth rate (Larsen, 1997: 43). In order to assess the economic status, the analysis of skeletal growth curves is often accompanied by an analysis of paleodemographic and paleopathological data (see (Molleson, 1989; Ribot, Roberts, 1996; Agnew, Justus, 2014; Pinhasi et al., 2014)).
The main methodological difficulties in the analysis of postcranial growth in paleopopulations include the lack of standardized techniques for describing and comparing growth curves, poor compatibility of various authors’ data (due to the difference in measurement protocols and/ or the number of age cohorts), and underestimation of differences in the growth rates of various limb segments (Fedosova, 2003).
This study outlines the pattern of longitudinal growth of long bones in the Gonur-Depe population, and builds upon my previous works (Kufterin, 2012, 2015, 2016b). The results of the previous research are tested on a much larger sample and compared to paleopathological data on the sub-adult remains from Gonur-Depe (Kufterin, 2016a).
Materials and methods
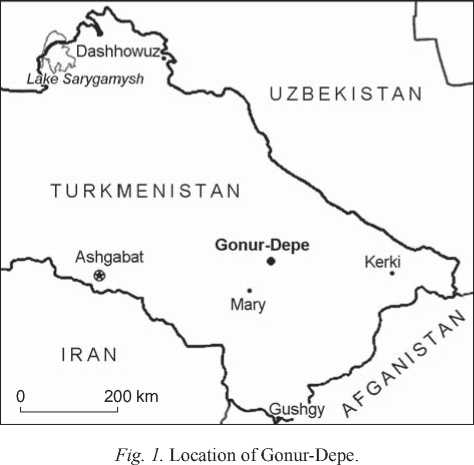
The sample includes the remains of 130 children and adolescents (0–14 years) from Gonur-Depe, the administrative and cultural center of ancient Margiana (Mary Region of Turkmenistan, Bactria-Margiana Archaeological Complex, late 3rd to middle 2nd millennia BC) (Sarianidi, 2002, 2005, 2007, 2008) studied by the author in 2010–2015 (Fig. 1; Table 1). The sample comprises 735 skeletal elements, including 144 humeri, 139 radii, 131 ulnae, 127 femora, 108 tibiae, and 86 fibulae.
The dental age of the sub-adults was assessed using conventional methods (Altukhov, 1913: 84; Ubelaker, 1978: Fig. 71; AlQahtani, Hector, Liversidge, 2010). The rate of longitudinal growth of all long bones was estimated using standardized measurements (Sciulli, 1994). As the standard for children and adolescents from 0 to 18 years of age, the data published by Maresh and quoted from Fedosova (2003) were used. The percentage of adult size attained was also calculated for the measurements of the limb-bones of the sub-adults, where the adult sample from the “ruins” of the Gonur-Depe palace-temple ensemble (Excavation 5, male skeletons) was taken as a reference (Dubova, Rykushina, 2004: 331). The long-bone diaphyses were measured by trammel or sliding caliper (precision 0.1–0.5 mm) according to the Fazekas and Kosa protocol (1978: 43–51), adopted for older individuals. As previous research on documented skeletal samples have not found significant sexual differences in the diaphyseal lengths (Facchini, Veschi, 2004), the sexes of the individuals in our samples were not determined. Similarly to annual intervals typically used in growth curve analyses (see (Agnew, Justus, 2014: 198)), nominal age cohorts were constructed by adding six months before and after the previously determined exact dental age. Descriptive statistics were calculated in AtteStat (www. , while the growth curves were built in MS Excel. The results were further compared to our previously published data on the paleodemography and paleopathology of the Gonur-Depe sub-adults (Kufterin, 2016a).
Results and discussion
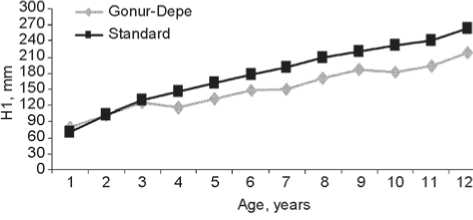
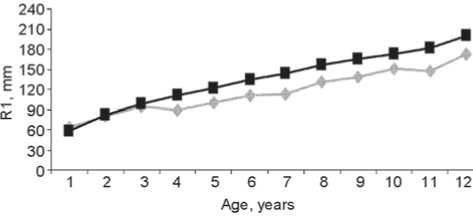
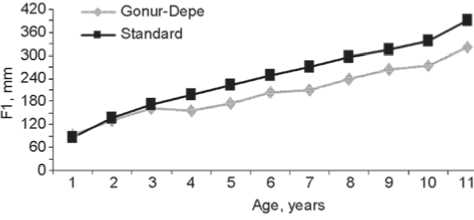
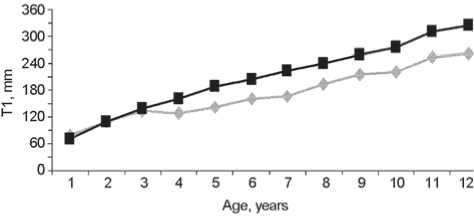
The descriptive statistics of the longitudinal dimensions of long bones in the Gonur-Depe sub-adult skeletal sample can be found in Table 2 and Fig. 2 and 3. These data clearly show that growth of the bones was substantially retarded as compared to modern standards (Table 3). The δlm parameter, which indicates the mean deviation from standard values, is 0.83 in the total sample. But this parameter displays a strong individual variation as well, ranging from 0.73 to 1.19 for the humerus, 0.74– 1.17 for the radius, 0.76–1.21 for the ulna, 0.72–1.15 for the femur, 0.72–1.21 for the tibia, and 0.70–1.23 for the fibula. The retardation is maximal in the leg bones (especially femur and fibula), and minimal in the forearm bones. This is confirmed by the sub-adult to adult bone length ratio (Table 4). Previous research has detected an even stronger retardation of the growth of the lower-limb bones in the samples of the Afanasievo culture of the Altai Mountains (Tur, Rykun, 2006: 74, 109) and the Alakul timber-grave cultural type of the Southern Trans-Urals (Kufterin, Nechvaloda, 2016). My previous results, based on a substantially smaller sample, have demonstrated a
tendency to a stronger retardation of the proximal limb segments than to distal (Kufterin, 2012; 2015; 2016b). This tendency is not clearly confirmed by the result of the present study. The pattern of body proportions typical of the adult Gonur-Depe population (general meso- or dolichomorphy with the forearm and lower leg elongated as compared to the shoulder and hip, respectively) (Babakov et al., 2001; Dubova, Rykushina, 2004, 2007a) was probably forming at later stages of ontogeny (i.e. adolescent period and following years).
Children aged from birth to 2–3 years are the least retarded, which corresponds well with my own results (Kufterin, 2012; 2015; 2016b), as well as with the results of other authors. This is explained by relatively good nutrition at that age due to breast-feeding, but also by a strong genetic determination of growth typical of this cohort (Fedosova, 2003: 529).
Retarded growth rates in paleopopulations as compared to modern standards are traditionally explained by the immediate reaction of the growing body to any fluctuation of environmental factors during the periods of the highest sensitivity, i.e. weaning and the adolescent growth spurt (Fedosova, 2003). Thus, the retardation is considered a consequence of poor nutrition and physiological stress (Larsen, 1997: 43–44); but the real situation may be more complicated. As I. Ribot and C. Roberts noted, “… the interpretation of the results remains difficult, as growth is so variable and the aetiology of stress indicators so hypothetical…” (1996: 67). This is followed by an even less “trivial” conclusion: “…there is no relationship between the frequency of stress indicators and the growth of long bone lengths” (Ibid.: 75). While not fully accepting such radical views, I would like to note that, according to some authors, soft tissues, but not the skeleton, are mostly affected by stress
Table 1. Size of the sample of sub-adults with known dental age
|
Age cohort |
N |
% |
|
0 |
37 |
28.5 |
|
1 |
24 |
18.5 |
|
2 |
17 |
13.1 |
|
3 |
5 |
3.8 |
|
4 |
4 |
3.1 |
|
5 |
14 |
10.7 |
|
6 |
2 |
1.5 |
|
7 |
7 |
5.4 |
|
8 |
7 |
5.4 |
|
9 |
5 |
3.8 |
|
10 |
2 |
1.5 |
|
11 |
1 |
0.8 |
|
12 |
3 |
2.3 |
|
13 |
1 |
0.8 |
|
14 |
1 |
0.8 |
Note. Skeletal remains of all individuals represented by at least one bone of any side were included in the total sample. Nominal age cohorts include the six months intervals before and after the age indicated in the table. Individuals younger than 6 months (inclusive) were assigned to the “0” cohort.
(Little, Malina, Buschang, 1988). For instance, there were no differences in stature found between adults with and without linear enamel hypoplasia (LEH) (Temple, 2008). On the other hand, a relation between LEH frequency and growth rate below the mean level was observed (Schillaci et al., 2011). The frequency of porotic hyperostosis, one more nonspecific stress marker, displays a correlation with growth retardation, but only until 6 years of age, i.e. during the period of growth deceleration (Armelagos, Huss-Ashmore, Martin, 1982).
What conclusions can be drawn from a comparison of the paleopathological, paloedemographic, and “paleoauxological” results of this study? In one of my previous publications, I noted that “…the high quality of life and good demographic situation in the Gonur-Depe population (Dubova, Rykushina, 2007b: 318) is in good agreement with the observation that ontogeny is generally decelerated in “centenarian” groups, owing to a retardation of skeletal maturation in children (Pavlovsky, 1987; Buzhilova, 2005: 20)” (Kufterin, 2016b: 280). It seems that the new data do not dismiss this notion. According to some authors, the bones that grow faster are more vulnerable to adverse environmental conditions (Sciulli, 1994: 257–258). A previous paleopathological study of the sub-adult sample from Gonur-Depe generally confirmed the view on this ancient population as well
Table 2. Variation of longitudinal measurements of the long bone diaphyses
|
Age |
Right side |
Left side |
||||||||
|
cohort |
||||||||||
|
N |
M |
S |
Min |
Max |
N |
M |
S |
Min |
Max |
|
|
1 |
2 |
3 |
4 |
5 |
6 |
7 |
8 |
9 |
10 |
11 |
|
Humerus |
||||||||||
|
0 |
20 |
74.5 |
9.42 |
60.4 |
90.6 |
21 |
78.7 |
12.26 |
64.3 |
102.0 |
|
1 |
13 |
101.4 |
9.08 |
87.1 |
112.0 |
19 |
98.9 |
7.86 |
87.4 |
112.0 |
|
2 |
15 |
122.4 |
6.04 |
110.7 |
133.0 |
13 |
123.9 |
5.85 |
115.0 |
133.5 |
|
3 |
2 |
113.0 |
– |
107.0 |
119.0 |
1 |
116.5 |
– |
– |
– |
|
4 |
2 |
131.5 |
– |
131.0 |
132.0 |
2 |
131.3 |
– |
130.0 |
132.5 |
|
5 |
4 |
136.9 |
4.77 |
132.0 |
142.5 |
6 |
147.7 |
10.09 |
134.0 |
163.0 |
|
6 |
2 |
147.5 |
– |
141.0 |
154.0 |
2 |
149.5 |
– |
142.0 |
157.0 |
|
7 |
5 |
170.4 |
10.31 |
157.0 |
186.0 |
5 |
165.1 |
11.71 |
151.5 |
182.0 |
|
8 |
4 |
187.3 |
15.09 |
173.5 |
205.0 |
4 |
180.9 |
9.99 |
173.0 |
195.5 |
|
9 |
1 |
173.0 |
– |
– |
– |
3 |
182.7 |
– |
172.0 |
199.0 |
|
10 11 12 13 |
1 |
190.0 |
– |
– |
– |
1 |
194.0 |
– |
– |
– |
|
– 2 – |
217.5 – |
– – |
214.0 – |
221.0 – |
2 – |
218.8 – |
– – |
217.5 – |
– 220.0 – |
|
|
14 |
– |
– |
– |
– |
– Radius |
– |
– |
– |
– |
– |
|
0 |
21 |
60.2 |
8.41 |
49.7 |
80.0 |
16 |
64.0 |
8.56 |
52.7 |
81.0 |
|
1 |
14 |
79.7 |
6.85 |
68.0 |
89.0 |
14 |
78.0 |
6.21 |
68.0 |
88.5 |
|
2 |
9 |
93.4 |
4.97 |
86.0 |
100.0 |
15 |
94.8 |
6.15 |
85.4 |
106.0 |
|
3 |
2 |
89.0 |
– |
84.0 |
94.0 |
– |
– |
– |
– |
– |
|
4 |
2 |
98.8 |
– |
96.0 |
101.5 |
2 |
100.5 |
– |
98.0 |
103.0 |
|
5 |
9 |
111.2 |
9.71 |
101.0 |
130.0 |
8 |
109.8 |
9.09 |
100.5 |
130.0 |
|
6 |
2 |
112.3 |
– |
110.5 |
114.0 |
2 |
113.0 |
– |
109.0 |
117.0 |
|
7 |
3 |
130.5 |
– |
116.5 |
140.0 |
4 |
130.5 |
10.25 |
116.0 |
140.0 |
|
8 |
2 |
133.3 |
– |
132.5 |
134.0 |
5 |
138.9 |
5.25 |
134.0 |
145.0 |
|
9 |
4 |
151.5 |
12.70 |
135.0 |
165.0 |
2 |
143.0 |
– |
135.0 |
151.0 |
|
10 11 12 13 14 |
1 |
147.0 |
– |
– |
– |
1 |
147.0 |
– |
– |
– |
|
– 1 |
173.0 |
– |
– |
– |
2 |
169.5 |
– |
167.0 |
– 172.0 |
|
|
– |
– |
– |
– |
– |
1 |
194.0 |
– |
– |
– |
|
|
Ulna |
||||||||||
|
0 |
20 |
68.6 |
9.22 |
57.1 |
91.5 |
18 |
71.8 |
10.02 |
56.6 |
92.5 |
|
1 |
16 |
89.1 |
6.71 |
77.0 |
99.0 |
11 |
88.0 |
6.74 |
77.0 |
100.5 |
|
2 |
9 |
104.8 |
4.14 |
99.0 |
110.5 |
14 |
105.0 |
5.63 |
96.0 |
115.5 |
|
3 |
1 |
93.8 |
– |
– |
– |
2 |
97.3 |
– |
93.6 |
101.0 |
|
4 |
2 |
112.3 |
– |
110.0 |
114.5 |
2 |
112.8 |
– |
109.5 |
116.0 |
Table 2 (continued)
|
1 |
2 |
3 |
4 |
5 |
6 |
7 |
8 |
9 |
10 |
11 |
|
5 |
5 |
118.4 |
3.76 |
113.0 |
122.5 |
9 |
122.8 |
7.89 |
113.5 |
140.0 |
|
6 |
1 |
122.0 |
– |
– |
– |
2 |
126.0 |
– |
122.0 |
130.0 |
|
7 |
2 |
142.0 |
– |
131.0 |
153.0 |
4 |
144.5 |
10.08 |
130.0 |
153.0 |
|
8 |
3 |
153.7 |
– |
149.0 |
162.0 |
5 |
155.5 |
6.40 |
149.0 |
164.0 |
|
9 |
2 |
162.0 |
– |
154.0 |
170.0 |
3 |
159.7 |
– |
154.0 |
168.0 |
|
10 11 12 |
– |
– |
– |
– |
– |
1 |
164.0 |
– |
– |
– |
|
– 1 |
195.0 |
– |
– |
– |
1 |
193.0 |
– |
– |
– – |
|
|
13 14 |
– |
– |
– |
– |
– |
1 |
203.0 |
– |
– |
– |
|
Femur |
||||||||||
|
0 |
20 |
92.4 |
17.29 |
68.2 |
127.0 |
21 |
86.3 |
15.69 |
67.7 |
127.5 |
|
1 |
10 |
128.4 |
13.05 |
107.1 |
145.0 |
10 |
131.4 |
12.62 |
107.2 |
145.0 |
|
2 |
8 |
161.5 |
7.68 |
149.0 |
174.5 |
11 |
159.0 |
7.74 |
147.9 |
174.0 |
|
3 |
4 |
156.5 |
11.14 |
141.0 |
167.5 |
5 |
156.3 |
9.63 |
141.0 |
167.0 |
|
4 |
1 |
173.0 |
– |
– |
– |
1 |
173.5 |
– |
– |
– |
|
5 |
6 |
203.5 |
19.92 |
188.0 |
241.0 |
7 |
193.8 |
6.94 |
185.0 |
203.0 |
|
6 |
2 |
207.0 |
– |
197.0 |
217.0 |
2 |
209.0 |
– |
197.0 |
221.0 |
|
7 |
3 |
238.7 |
– |
228.0 |
259.0 |
3 |
237.3 |
– |
226.0 |
259.0 |
|
8 |
3 |
257.7 |
– |
247.0 |
277.0 |
3 |
265.0 |
– |
251.0 |
279.0 |
|
9 10 |
3 – |
268.0 – |
– – |
262.0 – |
277.0 – |
4 – |
272.3 – |
12.89 – |
259.0 – |
288.0 – |
|
11 12 13 14 |
– 1 |
– 320.0 |
– – |
– – |
– – |
– 1 |
– 314.0 |
– – |
– – |
– – |
|
– 1 |
345.0 |
– |
– |
– |
– |
– |
– |
– |
– – |
|
|
Tibia |
||||||||||
|
0 |
20 |
79.9 |
14.48 |
60.0 |
107.0 |
18 |
77.8 |
12.02 |
60.1 |
96.1 |
|
1 |
6 |
102.5 |
12.48 |
89.9 |
119.0 |
7 |
108.3 |
11.28 |
89.3 |
118.5 |
|
2 |
8 |
132.6 |
6.65 |
122.5 |
142.0 |
8 |
133.0 |
6.78 |
123.0 |
144.0 |
|
3 |
3 |
127.7 |
– |
116.5 |
139.5 |
2 |
129.3 |
– |
118.5 |
140.0 |
|
4 |
2 |
143.0 |
– |
140.0 |
146.0 |
– |
– |
– |
– |
– |
|
5 |
7 |
160.7 |
15.14 |
151.0 |
194.0 |
5 |
161.0 |
18.59 |
150.0 |
194.0 |
|
6 |
2 |
167.0 |
– |
162.0 |
172.0 |
2 |
166.8 |
– |
160.0 |
173.5 |
|
7 |
3 |
194.3 |
– |
180.0 |
209.0 |
2 |
194.5 |
– |
179.0 |
210.0 |
|
8 |
4 |
208.5 |
6.95 |
202.0 |
218.0 |
4 |
215.6 |
13.40 |
201.5 |
233.0 |
|
9 10 11 |
3 |
220.0 |
– |
210.0 |
226.0 |
1 |
211.0 |
– |
– |
– |
|
– – |
– |
– |
– |
– |
1 |
255.0 |
– |
– |
– – |
|
|
12 |
1 |
263.0 |
– |
– |
– |
– |
– |
– |
– |
– |
Table 2 (end)
|
1 |
2 |
3 |
4 |
5 |
6 |
7 |
8 |
9 |
10 |
11 |
|
13 14 |
– 1 |
– 306.0 |
– – |
– – |
– – |
– – |
– – |
– – |
– – |
– – |
|
Fibula |
||||||||||
|
0 |
15 |
76.5 |
13.29 |
59.1 |
104.0 |
14 |
71.3 |
10.69 |
58.4 |
86.8 |
|
1 |
4 |
95.1 |
12.63 |
88.0 |
114.0 |
2 |
105.4 |
– |
98.7 |
112.0 |
|
2 |
7 |
127.6 |
7.54 |
118.5 |
138.5 |
6 |
127.0 |
5.93 |
119.5 |
137.0 |
|
3 |
3 |
124.0 |
– |
112.5 |
134.0 |
1 |
114.5 |
– |
– |
– |
|
4 |
1 |
143.5 |
– |
– |
– |
1 |
144.0 |
– |
– |
– |
|
5 |
9 |
155.6 |
12.31 |
146.0 |
186.0 |
5 |
156.5 |
16.13 |
146.0 |
185.0 |
|
6 |
2 |
163.5 |
– |
159.0 |
168.0 |
2 |
164.0 |
– |
159.0 |
169.0 |
|
7 |
3 |
188.8 |
– |
173.5 |
201.0 |
22 |
187.0 |
– |
173.0 |
201.0 |
|
8 |
2 |
204.5 |
– |
200.0 |
209.0 |
1 |
200.0 |
– |
– |
– |
|
9 |
2 |
215.5 |
– |
209.0 |
222.0 |
3 |
213.7 |
– |
207.0 |
223.0 |
|
10 |
2 |
222.0 |
– |
218.0 |
226.0 |
– |
– |
– |
– |
– |
|
11 |
1 |
236.0 |
– |
– |
– |
– |
– |
– |
– |
– |
|
12 13 |
1 |
254.0 |
– |
– |
– |
1 |
254.0 |
– |
– |
– |
|
14 |
– |
– |
– |
– |
– |
– |
– |
– |
– |
– |
а
b
Fig. 2. Age variation of the humeral ( a ) and radial ( b ) diaphyseal lengths as compared to standard values.
а
b
Fig. 3. Age variation of the humeral ( a ) and tibial ( b ) diaphyseal lengths as compared to standard values.
Table 3. Limb bone diaphyseal lengths in respect to age standards
|
Age cohort |
Humerus |
Radius |
Ulna |
Femur |
Tibia |
Fibula |
Total |
|||||||
|
N |
δl m * |
N |
δl m |
N |
δl m |
N |
δl m |
N |
δl m |
N |
δl m |
N |
δl m |
|
|
0 |
40 |
0.98 |
37 |
0.96 |
38 |
0.99 |
41 |
0.93 |
38 |
1.00 |
29 |
0.99 |
223 |
0.98 |
|
1 |
27 |
0.90 |
29 |
0.90 |
27 |
0.91 |
19 |
0.87 |
13 |
0.90 |
6 |
0.89 |
121 |
0.90 |
|
2 |
28 |
0.93 |
24 |
0.95 |
23 |
0.95 |
19 |
0.92 |
16 |
0.93 |
12 |
0.91 |
122 |
0.93 |
|
3 |
3 |
0.78 |
3 |
0.78 |
3 |
0.81 |
9 |
0.80 |
5 |
0.79 |
3 |
0.77 |
26 |
0.79 |
|
4 |
4 |
0.81 |
4 |
0.82 |
4 |
0.84 |
3 |
0.77 |
3 |
0.77 |
1 |
0.79 |
19 |
0.80 |
|
5 |
10 |
0.81 |
17 |
0.83 |
14 |
0.82 |
13 |
0.80 |
12 |
0.79 |
14 |
0.77 |
80 |
0.80 |
|
6 |
4 |
0.78 |
4 |
0.78 |
3 |
0.79 |
4 |
0.77 |
4 |
0.75 |
4 |
0.74 |
23 |
0.77 |
|
7 |
10 |
0.81 |
4 |
0.82 |
4 |
0.83 |
4 |
0.83 |
5 |
0.81 |
5 |
0.79 |
32 |
0.82 |
|
8 |
8 |
0.84 |
5 |
0.82 |
6 |
0.85 |
5 |
0.82 |
5 |
0.81 |
2 |
0.78 |
31 |
0.82 |
|
9 |
4 |
0.78 |
6 |
0.86 |
5 |
0.85 |
7 |
0.80 |
4 |
0.80 |
5 |
0.79 |
31 |
0.81 |
|
10 |
2 |
0.80 |
2 |
0.81 |
1 |
0.82 |
– |
– |
– |
– |
2 |
0.78 |
7 |
0.80 |
|
11 |
– |
– |
– |
– |
– |
– |
– |
– |
– |
– |
1 |
0.78 |
1 |
0.78 |
|
12 |
4 |
0.83 |
3 |
0.85 |
2 |
0.88 |
2 |
0.81 |
2 |
0.80 |
2 |
0.81 |
15 |
0.83 |
|
13 |
– |
– |
– |
– |
1 |
0.84 |
– |
– |
– |
– |
– |
– |
1 |
0.84 |
|
14 |
– |
– |
1 |
0.83 |
– |
– |
1 |
0.74 |
1 |
0.77 |
– |
– |
3 |
0.78 |
|
Total |
144 |
0.84 |
139 |
0.85 |
131 |
0.86 |
127 |
0.82 |
108 |
0.83 |
86 |
0.81 |
735 |
0.83 |
*Parameter indicating the mean deviation of limb bone measurements from standard values.
Table 4. Limb bone diaphyseal lengths, percentage of the adult value attained by a particular age
|
Age cohort |
Humerus |
Radius |
Ulna |
Femur |
Tibia |
Fibula |
|
0 |
25.6 |
26.3 |
27.3 |
20.7 |
21.3 |
21.4 |
|
1 |
33.0 |
32.8 |
33.9 |
29.4 |
28.8 |
29.4 |
|
2 |
40.3 |
39.0 |
39.9 |
36.1 |
35.4 |
35.6 |
|
3 |
37.9 |
36.6 |
37.0 |
35.0 |
34.4 |
34.6 |
|
4 |
42.7 |
41.4 |
42.9 |
38.8 |
38.1 |
40.2 |
|
5 |
48.0 |
45.8 |
46.7 |
45.5 |
42.9 |
43.7 |
|
6 |
48.6 |
46.5 |
47.9 |
46.7 |
44.5 |
45.8 |
|
7 |
55.4 |
53.7 |
54.9 |
53.4 |
51.8 |
52.7 |
|
8 |
61.0 |
57.2 |
59.1 |
59.3 |
57.4 |
57.1 |
|
9 |
59.4 |
62.3 |
61.6 |
60.9 |
58.6 |
60.2 |
|
10 |
63.0 |
60.5 |
62.3 |
– |
– |
62.0 |
|
11 |
– |
– |
– |
– |
67.9 |
65.9 |
|
12 |
71.1 |
71.2 |
74.1 |
71.6 |
70.0 |
70.9 |
|
13 |
– |
– |
77.1 |
– |
– |
– |
|
14 |
– |
79.8 |
– |
77.2 |
81.4 |
– |
Note. The largest mean value of either right or left side was used for calculation.
adapted to environment (Kufterin, 2016a). This is evident, for instance, in the low frequency of infection markers on the skeletons, and the absence of cases of scurvy, rickets, or traumatic lesions (Ibid.: 97).
Notably, the frequency in the studied sample of cribra orbitalia , the skeletal marker of anemia, is the highest in the cohort of 5-to-9-year-old children. This cohort also displays the highest level of retardation of longitudinal growth (statistically significant) as compared to the younger age group (Ibid.: 94–95). The probable age of emergence of most hypoplastic enamel defects (1–1.5 years) correlates to some extent with growth rates as well. As was noted above, the cohort of 2–3 year old children deviates the least from the modern standards. The observed younger age of formation of the hypoplastic defects could be related to the beginning of weaning, while some “delay” of longitudinal growth (in respect to the stress marker) might be associated with differences in genetically determined growth rates between the dentition and skeleton.
Finally, the results of the study of longitudinal growth in “agriculturalist” and “pastoralist” ancient populations of the Bronze and Iron Ages from Ukraine (Piontek, Jerszynska, Segeda, 2001) are of interest for interpretation of the results of the present work. The “pastoralist” subadults were found to be taller than their “agriculturalist” counterparts, which is explained by the Ukrainian and Polish researchers (among other factors) by different reproductive strategies in the two groups, similar to the classical r- and K-strategies (Ibid.). The “agriculturalists” displayed a higher fertility, a larger reproductive potential, a shortened duration of breast-feeding, and an early maturation (Ibid.: 69). Indeed, it is tempting to interpret the relatively high level of sub-adult (including infant) mortality in the late population of Gonur-Depe (burials in the “ruins” of the palace-temple ensemble), accompanied by a growth retardation in children and adolescents, as manifestations of the r-strategy. But direct parallels are barely relevant here, since no species (moreover, no population, “agriculturalist” or “pastoralist”) is subjected to purely r- or K-selection (Pianka, 1970; MacArthur, Wilson, 2001: 148–149).
Conclusions
The study of the rate of longitudinal growth in children and adolescents from Gonur-Depe has confirmed the views on this ancient population as well-adapted to its environment. The observed retardation of skeletal maturation, which is expressed in the “lagging” of longitudinal growth, can by no means be considered a manifestation of maladaptation of the population. Rather, it reflects a complex and multifaceted interaction with the environment. The comparison of paleodemographic, paleopathological, and growth rate data shows that the sub-adult sample from Gonur-Depe can be viewed as a “litmus test”, which integrally reflects the most complex process of biosocial adaptation of the Murghab oasis population to its environment. Any mechanistic interpretation of the “paleoauxological”, as well as paleopathological, data seems unpromising, and the “osteological paradox” is not to be forgotten (Wood et al., 1992; Jackes, 1993).
Acknowledgement
This study was supported by the Russian Foundation for the Humanities (Project No. 16-01-00288a “Paleoanthropological Investigation of the Bronze Age Site Gonur-Depe (Turkmenistan)”).
