Low cost virtual instrumentation using pc printer port for ultrasonic velocity measurements

Author: Rajagopalan S., Sharma S.J., Ghodki V.M.
Journal: Техническая акустика @ejta
Article in issue: т.7, 2007.
Free access
The most popular and effective technique for ultrasonic velocity measurements is the pulse technique. In the present work, PC based single-pulse sender/receiver system is developed using indigenous components and the bi-directional printer port. A program written in C, under the DOS/WINDOWS environment, controls the pulse generation, detection and travel time measurement. A radio frequency burst of 2 MHz of 5 µs width is obtained from an external source. This pulse is amplified and sent to the transmitting transducer. The received pulse is detected and is used to stop the counter. The number of pulses is counted using a 32 MHz external crystal source. The count is read by printer port and is further used in determining the travel time and to display the ultrasonic velocity of propagation in the medium on the computer screen. The system developed has been tested for ultrasonic velocity measurements in standard liquids. It has been found that the ultrasonic velocity measurement results obtained using the above system match well with those reported in the literature.
Ultrasonic velocity, ultrasonic measurements, pulse technique, bidirectional printer port
Short address: https://sciup.org/14316071
IDR: 14316071
Виртуальное оборудование для измерения скорости ультразвука
Наиболее распространенный и эффективный способ измерения скорости ультразвука - импульсный способ. В данной работе представлена одноимпульсная приемно-излучающая система, использующая обычные компоненты и двунаправленный порт принтера. Программа на языке С управляет генератором импульсов, приемом сигнала и измерением времени распространения. Пакет радиочастотных (2 МГц) импульсов шириной 5 ms генерируется внешним источником. Импульсы усиливаются и посылаются на излучающий преобразователь. Принимаемые импульсы подсчитываются внешним устройством. Результаты считываются через порт принтера и затем используются для определения времени распространения. Скорость ультразвука изображается на мониторе компьютера. Разработанная система проверена путем измерения скорости ультразвука в жидкостях. Обнаружено что полученные результаты хорошо совпадают с известными данным.
Text of the scientific article Low cost virtual instrumentation using pc printer port for ultrasonic velocity measurements
Electronic Journal «Technical Acoustics»
Ultrasonic measurements have been put to use for a variety of applications for many decades now. Initial rapid developments in instrumentation [1, 2] provoked by the technological advances since 1950 continue even today. Through the 1980's and continuing into the present, computers have provided scientists with smaller and more robust instruments with greater capabilities in the measurements of ultrasonic parameters [3]. Numerous techniques and instruments have been designed by researchers to cope up with the requirements of higher accuracy.
The advent of PC have made the researchers to exploit its capabilities to sense, detect, modify, manipulate and display the acquired data [4–6] in user required form. So the conventional instrumentation is being replaced by Virtual Instrumentation (V.I.) [7, 8]. The instruments that were used for ultrasonic measurements are replaced by V.I. In a low cost V.I., data acquired using transducers with necessary signal conditioning is fed to the directional printer port for online or offline processing. All these operations are performed under the suitable software control. The collected data is processed and displayed in the desired form. The data can be stored for future reference and use, leading to more consistent and accurate measurement.
There are different techniques [9] for measurement of ultrasonic velocity in liquids. The techniques for measurements of ultrasonic velocity in liquids can be classified into pulsed and continuous wave (CW) methods. The pulsed method includes sing around, pulse echo overlap and pulse superposition techniques [10] and continuous wave method includes interferometric technique. CW technique is generally used in low frequency region, and it suffers from number of drawbacks such as presence of complicated modes of vibrations, boundary effects, and large energy dissipation, which results in unwanted heating of the sample. These shortcomings of CW techniques can be overcome using the pulse technique. Woodward and Salman[11] designed a programmable ultrasonic velocity meter using a single pulse transmission technique. There were limitations on the range of values of ultrasonic velocities and digital counter.
In the present work, we have designed a computer based single pulse sender/receiver technique using bidirectional printer port with indigenous components. The system is accurate, reliable, fast and flexible to be operated over a wide range of velocities and frequencies.
A simple graphical user interface designed in VISUAL BASIC [12] at front-end, controls the various functions involved in the measurements. The system developed in our laboratory has been tested for ultrasonic velocity measurements in different standard liquids. The ultrasonic velocity measurements using the above technique, matches well with those reported in the literature.
HARDWARE DESIGN AND SOFWARE
The hardware consists of instrumentation required for measurements and a centronics bidirectional [13] printer port. Each printer port consists of three port addresses: data, status and control port. These addresses are in sequential order. That is, if the data port is at address 0X0378, the corresponding status port is at 0X0379 and the control port is at 0X037a. Fig. 1 and Fig. 2 give the description of printer port pins assignments and port assignments respectively.
|
1 |
13 |
View is looking at |
|
|
,.0000000000000/ |
Connector side of |
||
|
\000000000000/ |
DB-25 Male Connector |
||
|
14 |
25 |
||
|
Pin |
Description |
||
|
1 |
/Strobe |
PC Output |
|
|
2 |
Data 0 |
PC Output |
|
|
3 |
Data 1 |
PC Output |
Pin Assignments |
|
4 |
Data 2 |
PC Output |
|
|
5 |
Data 3 |
PC Output |
Note: 8 Data Outputs |
|
6 |
Data 4 |
PC Output |
4 Misc Other Outputs |
|
7 |
Data 5 |
PC Output |
|
|
8 |
Data 6 |
PC Output |
5 Data Inputs |
|
9 |
Data 7 |
PC Output |
|
|
10 |
/ACK |
PC Input |
|
|
11 |
Busy |
PC Input |
Note: Pins 18-25 are |
|
12 |
Paper Empty |
PC Input |
Ground |
|
13 |
Select |
PC Input |
|
|
14 |
/Autofeed |
PC Output |
|
|
15 |
/Error |
PC Input |
|
|
16 |
Initialize Printer |
PC Output |
|
|
17 |
/Select Input |
PC Output |
|
Fig. 1. Pin assignments
|
Data Port |
Status Port |
Control Port |
|||
|
D7 |
----► Data 7 |
D7 |
4-- Busy |
D7 |
Res. |
|
D6 |
----► Data 6 |
D6 |
4-- /ACK |
D6 |
Res. |
|
D5 |
----► Data 5 |
D5 |
4-- PE |
D5 |
----► Direction |
|
D4 |
----к Data 4 |
D4 |
Select |
D4 |
—к IRQ Enable |
|
D3 |
----» Data 3 |
D3 |
4-- /Error |
D3 |
----► /Select In |
|
D2 |
----► Data 2 |
D2 |
/IRQ |
D2 |
—► INIT |
|
D1 |
----► Data 1 |
D1 |
Res. |
D1 |
—► /Autofeed |
|
D0 |
----► Data 0 |
D0 |
Res. |
D0 |
—► /Strobe |
Fig. 2. Port assignments
In present work data port is used as input port, status port as input port and control port as output port. Table 1 depicts the actual use of each printer port pin.
Table 1
|
Pin |
Description |
Use |
Type |
Pin |
Description |
Use |
Type |
|
1 |
Strobe |
Clear |
Output |
10 |
Ack |
D8 |
Input |
|
2 |
Data 0 |
D0 |
Input |
11 |
Busy |
D9 |
Input |
|
3 |
Data 1 |
D1 |
Input |
12 |
PE |
D10 |
Input |
|
4 |
Data 2 |
D2 |
Input |
13 |
Select |
D11 |
Input |
|
5 |
Data 3 |
D3 |
Input |
14 |
Autofeed |
5 uS |
Output |
|
6 |
Data 4 |
D4 |
Input |
15 |
Error |
Not Used |
------ |
|
7 |
Data 5 |
D5 |
Input |
16 |
Init |
S |
Output |
|
8 |
Data 6 |
D6 |
Input |
17 |
Select in |
R |
Output |
|
9 |
Data 7 |
D7 |
Input |
18 |
Ground |
Gnd |
Output |
Fig. 3 shows the block diagram of a single pulse sender/receiver technique. It consists of IBM compatible PC with bi-directional printer port, RF Amplifier, sample holder with matched piezoelectric transducers, receiver amplifier and pulse shaper circuit. Fig. 4 shows the printer port interface to system. A pulse of 5 µ s is generated using a program. This pulse is given to an AND gate with a 2 MHz source so as to get r.f. carrier pulse of 2 MHz. This is amplified by r.f. amplifier to 24 V peak to peak, is used to drive the transmitting transducer, Tx. The ultrasonic waves generated travel through a sample and are then received by receiving transducer, T R . The received pulse consists of the direct received pulse and the echoes. This pulse is amplified by the receiver amplifier (Fig. 5) to generate pulse of 5 Volts for each echo to trigger the printer port to record the number of pulses, under the program control. This count is used to display the velocity of the liquid under test on the front panel designed using VB.
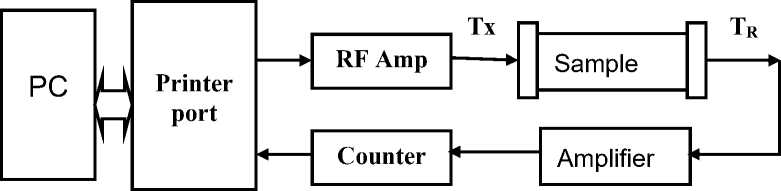
Fig. 3. Block diagram of a single pulse sender/receiver technique
Software is used to control the total operation of triggering, receiving the pulse corresponding to echo and measuring the travel time. For pulser/receiver circuit printer port pins are used. DOS platform is used to write software in C programming language.
Initially, a reset pulse is generated using the software to activate R input of Flip-Flop to reset the counter. A trigger pulse is generated and sent to the transmitting transducer, simultaneously a pulse is sent to S input of Flip-Flop to activate the counter. The counter (12 bit – 743939) is used to record the counts between the trigger and the first received echo. An external standard frequency source of 32 MHz is used to measure the travel time of the sonic pulse for a given sample length. Counter stops counting of the pulses as soon as the first echo is received. The count is then read using software through bi-directional printer port. It gives the total travel time that includes the total travel time through sample and electronic delay. The electronic delay can be determined using ultrasonic velocity propagation in standard liquid. The ultrasonic velocity in the liquid under study is calculated and displayed on the screen designed (Fig. 6) for V.I. using VB. This procedure can be repeated number of times as per the user’s need. The data corresponding to repetitions are stored in the computer file and can be used for further analysis. The same program calculates the actual velocity in the liquid sample and displays the velocity on the screen.
From Gate
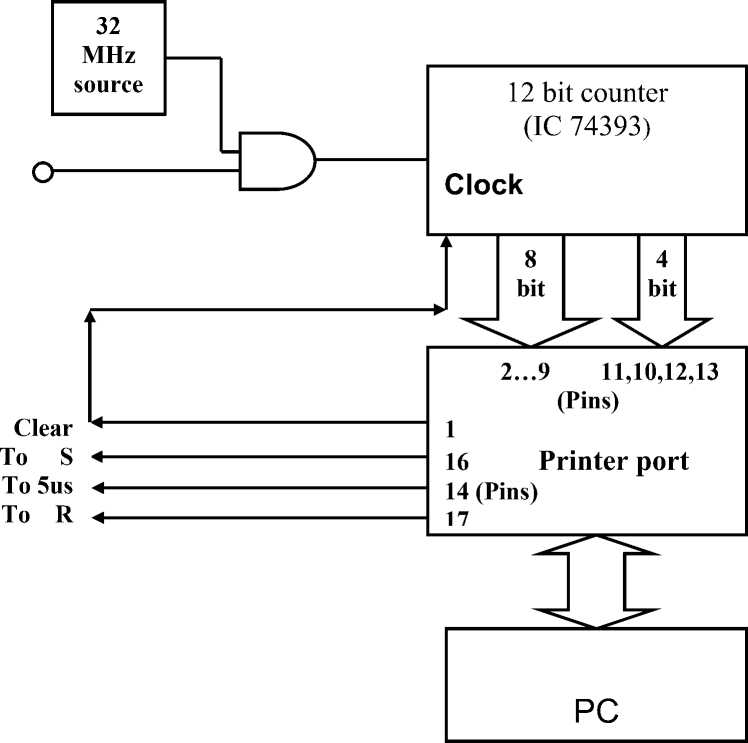
Fig. 4. Diagram showing the printer port interface
RESULTS
The system has been developed in the laboratory and tested for the ultrasonic velocity measurements in distilled water. It has been found that the ultrasonic velocity measurements carried out using the above system matches well with those reported in the literature. Table 2 shows the results of our measurements carried out for water at various temperatures.
Table 2
|
Liquid |
Temperature (C ° ) |
Present work (m/s) |
Literature (m/s) [14] |
|
Water |
25.0 |
1496.69 |
1496.687 |
|
26.4 |
1500.20 |
1500.356 |
|
|
27.6 |
1503.54 |
1503.384 |
|
|
28.3 |
1505.24 |
1505.102 |
|
|
30.5 |
1510.12 |
1510.272 |
|
|
31.7 |
1512.83 |
1512.949 |
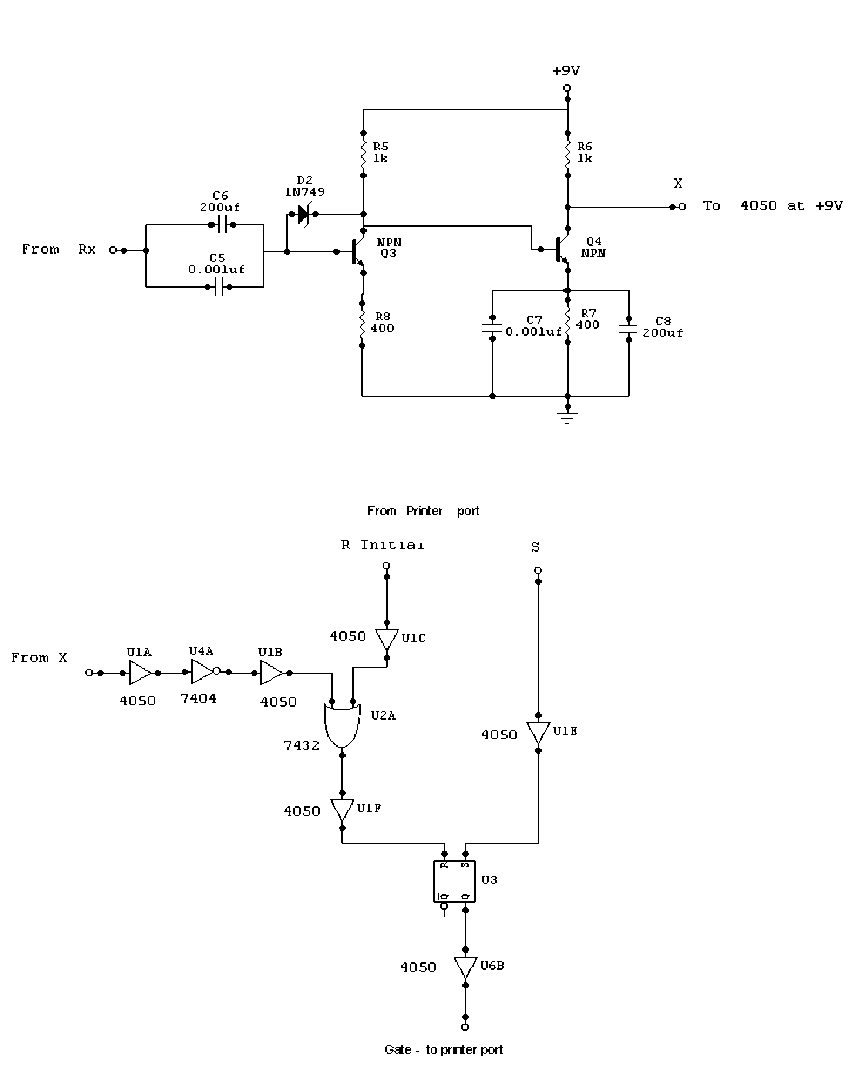
Fig. 5. Circuit diagram of a receiver amplifier and pulse shaper
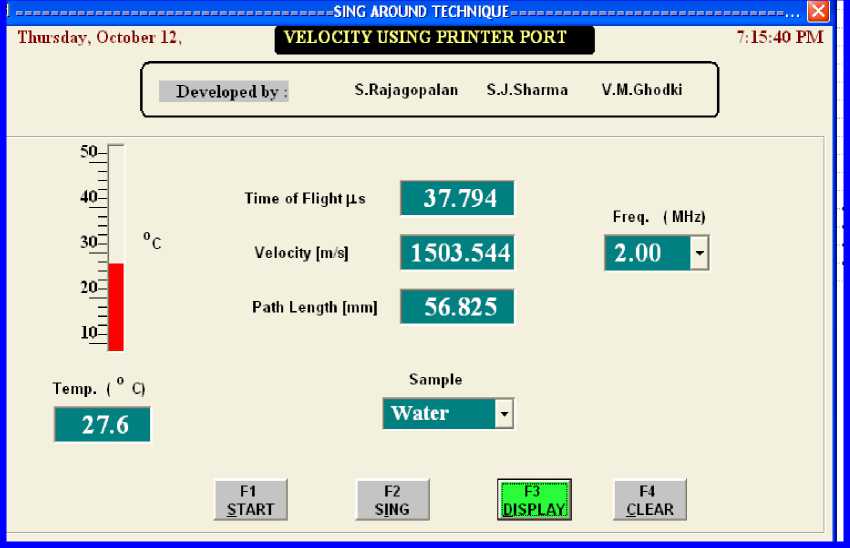
Fig. 6. Screen shot showing the front panel
DISCUSSION
The ultrasonic velocity measurements using the present PC based system are found to be precise and consistent. The system can be used for measurements in different liquids at different temperatures. In the present work, 32 MHz standard external frequency source was used for travel time measurements. Attempts are being made to use higher value frequency sources for better resolution. New systems in binary liquids or gel form are being taken up.
ACKNOWLEDGEMENT
The authors are grateful to Miss Gajbhiye, Head, Department of Electronics, RSTM, Nagpur University, Nagpur to carry out the experimental work. The authors are grateful to Mr. V. R. Vyaghra for useful discussions during the work, to Dr. M. N. Ghoshal and Dr C. D Zanwar for their interest in the work. One of the authors (S. J. Sharma) would like to thank University Grants Commission, New Delhi for the financial assistance provided to carry out the work.
References Low cost virtual instrumentation using pc printer port for ultrasonic velocity measurements
- Flower Kim. Multiprocessing in real time system (part 5). IEEE Instrumentation and measurement Magazine, March 2003, 51-54.
- Engelberg S. Measurement of Physical constants using noise. IEEE Instrumentation and measurement Magazine, Dec. 2003, 49-52.
- Papadakis E. Effect of multimode guided wave propagation on ultrasonic phase velocity measurement problem and remedy. J. Acoust. Soc. Am. 45, 1969, 1547.
- Kollar I., Pintelon R., Schoukens J. Complicated procedure made easy (GUI). IEEE Instrumentation and measurement Magazine. Sept. 2003, 19-26.
- Kollar I., Pintelon R., Schoukens J., Simon G. How to test graphical user interface. IEEE Instrumentation and measurement Magazine, Sept. 2003, 27-33.
- Sachenko A., Kochan V., Turchenko V. Instrumentation for gathering data (DAQ System). IEEE Instrumentation and measurement Magazine, Sept. 2003, 34-40.
- Vyas N. S. Condition monitoring Applications using Virtual Instrumentation. National Symposium on Instrumentation, Pantnagar, India, 2003.
- Vijaykumar P. N. Virtual Instruments in Research. National Symposium on Instrumentation, Pantnagar, India, 2003.
- E. P. Papadakis, W.P. Mason. Physical Acoustics, vol. XII, 227, 1976.
- R. L. Forgacs. Improvements in the Sing Around Technique for Ultrasonic Velocity Measurement. J. Acoust. Soc. Am. 32, 1960, 1697.
- B. Woodward, M. N. Salman. Programmable ultrasonic velocimeter. Acoustics letters 6(8), 1983, 110-114.
- Mastering VB6. Evansgelos Petroutos, BPB Publication, New Delhi, 1998.
- http://engr.nmsu.edu/~etti/fall96/computer/printer/printer.html
- V. A. Del Gross, C. W. Mader. Speed of sound in pure water. J. Acoust. Soc. Am. 52 (7) (part 2), 1972, 1442-1446.
