Low-power Wireless Pressure Transmitter and Net of Oil-well Based on Zigbee

Author: Xiwei Yang, Changyun Li
Journal: International Journal of Information Technology and Computer Science(IJITCS) @ijitcs
Article in issue: 1 Vol. 2, 2010.
Free access
The paper introduced a low-power wireless pressure transmitter for measure pressure and temperature of oil-well. To avoid wiring cables onsite, ZICM2410 was adopted to construct Wireless Sensor Network (WSN), and powered by Li-Ion battery. To reduce the power consumption, MSP430F477 and other low-power chips were used to construct the hardware, and energy conservation strategies were designed in the software. One strategy was turning off the power when some chips or modules were not on duty. Another strategy was working, sleeping and timer waking up. The SNAP wireless network solution of Zigbee was used to compose WSN. By analysis and test, the power consumption of the transmitter is very low, and the transmission range of it could be up to 300m. It could longtime continuously work for the low power consumption ability. The transmitter could fully meet the actual requirements, and could be applied to other industry situations easily.
MSP430, Low-power, Data Acquisition, Transmitter, Wireless sensor Network
Short address: https://sciup.org/15011576
IDR: 15011576
Text of the scientific article Low-power Wireless Pressure Transmitter and Net of Oil-well Based on Zigbee
Published Online November 2010 in MECS
As the oil-wells are scattered over the hostile environment, collection of production data timely becomes more difficult with the expansion of the scope of oilfield operations. As the well sites are unattended operation, getting and mastering the data of oil wells in time is a very important significance in promptly troubleshooting and maintenance for oil-wells [1].
Transmitter which is placed in the wild must be able to work permanently and stably. Power consumption is particularly important because it uses lithium battery-powered. The two most important parameters of the oilwell are the pressure and temperature [2]. Therefore, this paper took pressure testing and temperature testing as examples. It focused on how the transmitter collects data of oil-well pressure under premise of low-power, processes and analyzes sampling data, displays the testing waveform so that the field staffs can view the monitoring data conveniently, and transmits data to a remote monitoring network in time. The transmitter must work safely in high temperature, high pressure and high shock of oil-wells environment [3], obtains the oil-well data reliably, as well as preserves the data for a long time without loss. Accordingly, the electric circuit of the transmitter must withstand the high temperature, the high pressure and the high shock. In addition, the transmitter must be explosion-proof and avoid damage. Using the MSP430f477 low-power microcontroller unit (MCU) as the core and combing industrial sensors, the transmitter could chronically collect oil well field data. Adopting the ZICM2410 wireless module, a Wireless Sensor Network (WSN) of multipoint pressures and temperature on oilwell field could be constructed.
In this design, there are two problems should be solved: one is how to reduce the low power consumption; the other is how to construct wireless sensor network.
-
A. low power consumption
Because the transmitter was powered by Li-Ion battery and maybe needed to work three months, half years or even longer in practical application. In order to work as longer as possible, the transmitter must adopt some ways to reduce the power consumption as possible. According to the structure of this system, combining the hardware with softwaer was used to reduce power consumption.
In the hardware, there were three ways which could be used to reduce the power consumption. The first way was to adopt low power chip of MCU, the second was to choose low power consumption Zigbee chip, and the third way was to select low power sensors.
-
1) MCU chip selection
Considering of the power consumption, the MCU must have a low voltage supply, and must be integrated with high resolution AD converter because the power of external AD converter is quite high usually. The chip should also have a variety of low power consumption mode. So this system chose the microcontroller of MSP430F477 as the MCU.
-
2) Wireless module selection
It should choose a low power module which powered by battery, and the power supply voltage range must be consistent with the voltage of MCU. So this paper chose ZICM2410 as the wireless module.
-
3) Sensors selection
It should be powered by low voltage supply. Because the input voltage of sensor transmitters in the market are always higher, a temperature sensor and a pressure sensor working under a low voltage power supply were designed in this paper.
In the software, there were two energy conservation strategies designed. One strategy was turned off the power when some chips or modules were not on duty. Another strategy was working, sleeping and timer waking up. The most effective way to reduce power consumption was to reduce the working time of the transmitter. This system was very suitable for sleep mode, because data sampling was cyclical. The transmitter was sleeping after sampling until it was woke up by the timer. After waking up, the transmitter sampled and sent the set of collected data to the wireless network of Zigbee, after then it went to the sleep mode again.
-
B. Wireless Sensor Network
According to the condition of oil field, the range of distance between sensor nodes could be a few meters to hundreds of meters, and the range of distance between oil wells also ranges from a few meters to hundreds of meters. So the wireless sensor network could be infinite and outspread and unlimited expansion. According to this characteristic, as well as considering from low power consumption and low cost, Zigbee wireless network was appropriate in this system. Zigbee had some solutions, and most commonly used was TI’s Z-Stack protocol stack. But structure of this scheme was complex, and the development cycle was long. Since the task of the system of the wireless network was mainly to transmit data, there was no need to make complex network management functions. A wireless sensor node could join in the network optionally. According to these requirements, this system chose the SNAP network solution with networking simple, cheap and short development cycle.
II.Design Of System Hardware Citcuit
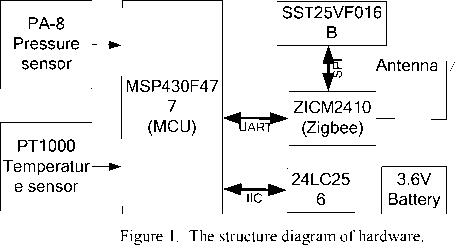
The wireless pressure transmitter was a part of the oil wells monitor system and a node of SNAP network. The task of it was to collect oil-well parameters and then sent these parameters to remote terminal by wireless network. The hardware of it mainly made up of three modules, which were the sensor module, the CPU module and the wireless module.
Sensor module: responsible for sensing pressure and temperature of oil-well.
CPU module: sampling the signal of pressure and temperature; processing the data; sending the data to wireless module; receiving commands from PC through wireless module. It consisted of power supply module, reset modules, memory module, protection circuit, etc.
Wireless module: responsible for sending the data coming from CPU module to Zigbee network, receiving data from Zigbee network and sending it to CPU module.
This design also used a LCD display module to display the data of oil-well parameters for on-site view as an optional module.
Schematic diagram of the wireless pressure transmitter was shown in Fig. 1.
-
A. 16-bit low-power MCU of MSP430F477
MSP430F477 MCU is a 16-bit ultra-low power MCU, with a low supply voltage range from 1.8V to 3.6V, five power saving modes, the corresponding of wake-up from standby mode is no more than 6us, 16-bit SigmaDelta 16-Bit Sigma-Delta Analog-to-Digital (A/D) Converter (SD16_A) with internal reference and five differential analog inputs, one 12-bit Digital-to-Analog (D/A) converter, two universal serial communication interfaces (USCI), two 16-bit timers, a basic timer with a real-time clock, supply voltage supervisor/monitor with programmable level detection, three clock source(this system uses 32KHz crystal oscillator as low-frequency clock and 8MHz crystal oscillator as high-frequency clock). The current consumption is 262µA at 1MHz and 2.2V in active mode, 1.1µA in standby mode and only 0.1µA in off mode. These features of low power consumption provide an advantageous condition for the low-power system designing [4].
-
B. Power module and Reset module
3.6V
SW1
D1
VCC3.3V
C12
VIN_1.2V
R10
Battery

1K
VCC_3.3V

1K
3.3K

Power
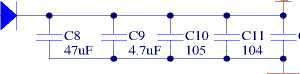
Figure 2. The power supply circuit.
The system used 3.6V lithium battery to supply power directly. A germanium diode was used to connect the battery and the circuit in series, in order to protect the transmitter when the battery was reversed. The circuit supply voltage reduced to 3.3V because the voltage dropped on the germanium diode. Then the 3.3V could be divided into 1.2V by divider resistances, the 1.2V was used to power supply of the excitation electric bridge sensors and external reference voltage. Battery energy was detected by Supply Voltage Detection (SVS) which integrated within MSP430F477. The MAX809ZD was used to reset the transmitter. The reset threshold voltage and power consumption of MAX809ZD were 2.32V
(typical value) and 17µA. The power supply circuit was shown in Fig. 2.
-
C. Sensors Module
-
1) pressure sensor
Most of bridge sensors in the market require a higher excitation voltage (usually 10V), and consume large power. Thus, in order to meet the requirements of low voltage and low-power, a Keller’s PA-8 low-power pressure transducers was selected. A PA-8 Piezoresistive OEM Pressure Transducers was adopted in the gauge. The Series 8 pressure sensors are extremely durable, even when they are exposed to fast pressure peaks. They have been developed especially for the measurement of high pressures. The series 8 sensors for ranges 400~1000bar use a thicker glass feed through and a wire-bonded measuring cell. A high-sensitivity piezoresistive silicon chip is used for pressure sensing. The chip is protected against ambient influences by a stainless steel housing sealed with a concentrically corrugated diaphragm. The housing is filled with silicone oil for the transfer of the pressure from the diaphragm to the sensing component[5]. The structure of PA-8 is a full bridge. Its outputs were connected to channel A0 of SD16_A. The P1.0 of the MSP430F477 was used to control the power supply of pressure sensor. In standby mode, the inputs of sensors were turned off for reducing power consumption. The input voltage (VIN) of sensors was 1.2V, resistance of bridge was 3.5K, so the power consumption was 0.343mA (1.2V/3.5KΩ) when the VIN was 1.2V and 0mA when the VIN was turned off. A supply current of 1mA outputs a nominal signal of 200mV for all standard pressure ranges, and the sensor signal is proportional to the excitation current [6]. Because the excitation current was 0.343mA, so the full scale output voltages (Vomax) could be calculated using (1). The pressure sensor’s output ranged from 0mV to 64.6mV.
0 W™4
V = 200 mV 0.343 mA = 64.6 mV (1) o max
1mA
-
2) temperature sensor
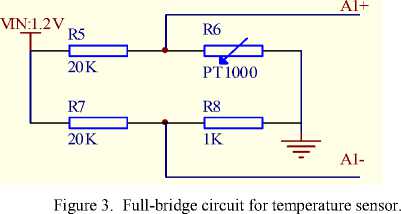
Generally, pressure sensors require temperature compensation [7]. The traditional hardware compensation methods were relatively complicated, while software compensation methods were simpler. The software compensation method was used here. MCU collected values of ambient temperature by temperature sensor, and then calculated the actual values of pressure by compensation algorithm. In spite of SD16_A had an internal temperature sensor, for the MCU chip could not contact with the transmitter shell, the internal temperature sensor had a large delay in apperceiving the outside temperature changing and the internal temperature testing result was not enough accurate. Therefore, an external temperature sensor was adopted in temperature testing. As shown in Fig.3, the bridge used PT1000 thermal resistance, and its output was connected to the channel A1 of SD16_A, and 1.2V input voltage was connected to VIN. The power consumption was only 110µA in the excitation state.
-
D. Memory Module
System's memory module was mainly used to store the sampling data of oil-well parameters and keep the data when out of power. Flash memory had non-volatile, rewritable and other outstanding features, so the system selected flash chips 24LC256 of Microchip Technology Inc. 24LC256 has a wide working voltage (2.5V~5.5V), with a low power consumption which standby current is 1 μ A and working current is 1mA.
-
E. Wireless Module
A ZICM2410, which was a wireless system-on-chip (SoC) of Zigbee according to 2.4 GHz IEEE 802.15.4 standard from CEL Company, was chosen as wireless module in the transmitter. It supported SNAP network, provided transmitting data ratio up to 1Mbps. Transmitting range with non-barrier up to 3000 feet, and three low-power modes. The ZICM2410 working voltage range was 2.1V~3.3V, and had a very low power consumption that the lowest sleep current was less than 1µA, receiving current was 35mA and sending current was 44mA. MSP430F477 connected with ZICM2410 by the serial communication interface of USCI_A0.
It used the SST company serial flash of SST25VF016B to be the memory of ZICM2410. The memory was to store the ZICM2410 driver, the SNAP protocol stack and the user program. The WP-pin of SST25VF016B connected to the low level and pull-down a 0Ω resistance, so that SST25VF016B was writeable. The pins of SO, SI and SCK of SST25VF016B SPI serial port respectively connected to the P3.4 (SPISO), P3.5 (SPISI), and P3.6 (SPICLK) of ZICM2410.
-
III. Design Of System Software
The software system consisted of initialization program, data acquisition program, temperature compensation program, wireless receiving and sending program and dynamic waveform display program.
-
A. Initialization program
After the transmitter was power-on, firstly, the MSP430F477 initialized peripherals: disabling watchdog timer, configuring the basic clock and the basic timer1, setting the timer1 with 1Hz, setting a sleep period of T(s) to the variable ‘interval’ for waking up the system, and configuring SD16_A converter module; secondly, the basic timer1 was started and the system was set into sleeping mode LPM0. When timer1 generated a rising edge, the system was waked up. If the variable N was less than interval, the N was increased with 1 and the MCU was set to LPM0. If the N equaled the interval, the pressure and temperature were sampled orderly; the actual physical quantity was calculated by compensation algorithm; the sampling data were saved into EEPROM and sent out by wireless modules; the N was set with 0; the system returned to sleeping mode LPM0 automatically. Necessary, the range of T could be set from 1s to several hours. Certainly, the longer the T was, the lower the power consumption was. The frequency of basic timer1 was 32kHz. Only in the LPM0 mode, basic timer and FLL+ phase-locked loop could work normally. By using 16bit timing mode of the basic timer1, FLL+ phase-locked loop was 8 multiple division to basic clock frequency, so the basic timer timing cycle could reach 192s.
If the display-key was pressed, an I/O interruption was triggered; the LCD displayed real-time pressure and temperature waveform. If the serial interface interruption was triggered, it accepted the commands from the USART, and then set the related configurations according to the commands. The main flowchart for the system was shown in Fig. 4.
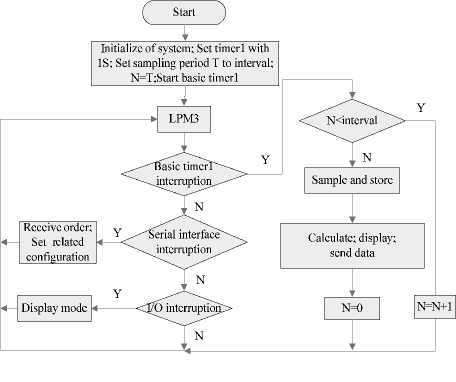
Figure 4. The main flowchart for the system
-
B. Data Acquisition program
MSP430F477 integrates a SD16_A which has five differential analog inputs. SD16_A is a single-channel multiple choice 16-bit AD converter with internal reference voltage, internal temperature sensor and PGA which offers gains up to 32. The SD16_A is designed for low power applications. When the SD16_A is not actively converting, it is automatically disabled and automatically re-enabled when a conversion is started. The reference is not automatically disabled, but can be disabled by setting SD16_AREFON=0. When the SD16_A or reference are disabled, they consume no current [4].
After system went into the measurement mode, SD16_A interrupt was enabled. The VIN, the sensors power and the external reference voltage of SD16_A, was turned on. The SD16_A used the continuous conversion mode, its oversampling rate (OSR) was 128 and frequency was 1MHz. First, selecting the channel A0, the MCU sampled the pressure. Second, selecting the channel A1, the MCU sampled the temperature. At last, the MCU turned off VIN to reduce the current consumption, and then exited the interrupt handler. The flowchart was shown in Fig. 5.
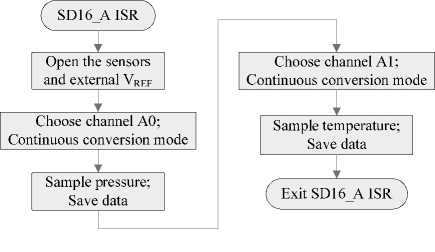
Figure 5. Data acquisition flowchart
-
C. temperature compensation program
The temperature of oil well field ranges from -30 C to 50 °C , so the pressure transmitter must work in different temperature environments. Generally, the sensors’ outputs and AD convertor value may shift along with the temperature change. In order to get accurate pressure value, the transmitter must adjust the test data with temperature model. In this transmitter, the error may be fixed by the software algorithm. The method was described detailed in [8].
-
IV. Zigbee network solution
-
A. Structure of wireless sensornetwork
The system used the SNAP wireless network solutions. As shown in Fig. 6, on the oilfield, a SNAP network was composed by several SNAP nodes, and a SNAP gateway worked as a base station. Each SNAP node was a wireless transmitter which measure different parameters of oil-well.
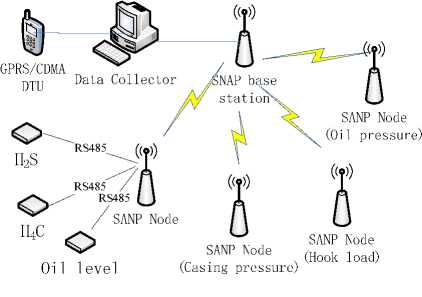
Figure 6. The structure diagram of wireless sensor network.
Considering same special application occasions, the sensors could not use wireless transmission, so a RS485 subnet was adopted to connect those sensers with a SNAP node.
SNAP gateway was responsible for receiving sampling data from each node and sending the data to data collector. The data collector analysed and processed the data, and then sent to remote control center through GPRS/CDMA module.
This network solution for small oil-Wells and large oil platforms were very practical, it had a very good flexibility, simple and reliable. A node without application could be very easily joined to a SNAP network, and a node’s trouble also won't affect the entire SNAP network.
Using the SNAP Portal development software from the Synapse Company, this system developed and downloaded the program for ZICM2410. The Portal supports download and upgrade OTA(On The Air), configuration equipment, channel analysis, data and event monitoring, and other functions, supports Python language script editor. SNAP node program included ZICM2410 drive, SNAP protocol stack and user script. SNAP protocol stack, built-in Python virtual machine, used Python scripting language for development.
B.Wireless receiving and sending program
After powered-on, ZICM2410 module was initialized, and then entered into the sleep mode of PM3. The ZICM2410 would exit the sleep mode if there was an interruption. If command from a host computer came, The ZICM2410 sent the received commands to the UATR0; if the transmitter wanted to send data, the ZICM2410 received the data from the UATR0, and sent it out. After data was sent, ZICM2410 entered into the sleep mode of PM3. The flowchart was shown in Fig. 6.
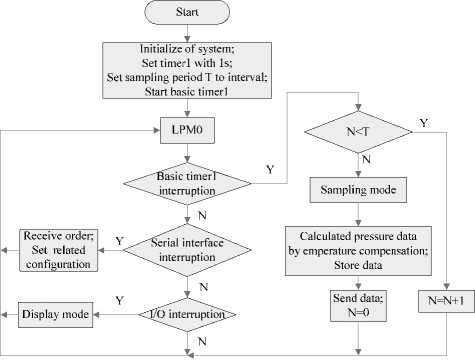
Figure 7. ZICM2410 flowchart.
-
C. SNAP configuration program
In SNAP node, ZICM2410 connected to MCU of MSP430F477 by the serial port of UART1, so the UART1 of ZICM2410 was set to work in wireless transmission mode, ZICM2410 received data from UART1 and then forward the data immediately. The SNAP base station node address was set 0x0e0001, and all other SNAP nodes forward data to the SNAP base station.
Part of SNAP configuration program followed as: otherNodeAddr =“\x0e\x00\x01”
# Destination node address defstartup():
initUart(1,115200) #UART initiation flowControl(1,False) #Desable flow control crossConnect(DS_STDIO, DS_UART1)
-
# Bind standard input/output to UART1 ucastSerial(otherNodeAddr)
#Set destination node snappyGen.setHook(SnapConstants.HOOK_START
UP,startup) #Start the startup event
SNAP network transmission had two modes: one was transparent wireless transfer mode, another was wireless transmission mode. In transparent wireless transmission mode, the ZICM2410 send the data out directly without process after receiving data from UART1, or forwarded the data to serial port after receiving from the network. The point-to-point communication only needs to forward data and does not need to process the data, so the transparent wireless transmission mode was satisfied.
But in this system, after ZICM2410 received data, it must process the data, then sent it out, so the system adopted wireless transmission mode. It could bind standard input and output to UART1 through set crossConnect (DS_STDIO, DS_UART1).
D. SNAP base station program
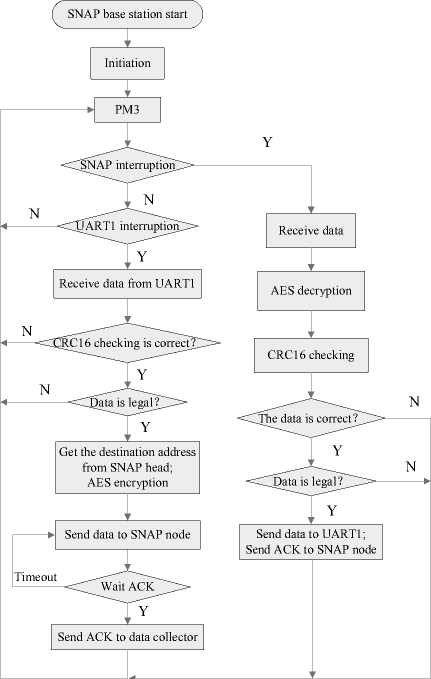
Figure 8. SNAP base station program flowchart.
Though the ZICM2410 data transmission has higher reliability, in order to ensure the reliability of data transmission, and considering the low power consumption, this system used ACK in SNAP network.
Data encryption adopted AES128 hardware encryption which integrated in ZICM2410. For the efficiency, it only needed to encrypt data frame and command frame, didn’t need to decrypt ACK frame.
For the SNAP base station, when it received data from network, at first, the data was decrypted by AES and then checked by CRC16. If it was correct, then it judged whether the destination address field was local network addresses and information code field was legal. If the data was not correct or illegal, it was discarded. If the destination address and information code was correct, then the data was sent to serial port 1, and an ACK frame was sent to data source. When the PC sent command frame to SNAP node, the SNAP base station received orders through serial port 1, checked the data by the CRC, and then judged weather the orderes were legal. If so, then read it and figured the receiver’s destination node address, and sent orders to SNAP node after encripiting them by AES through wireless network.Then waiting for the ACK frame which sent frome SNAP node. After the SNAP base station received ACK frame, it sent ACK frame to PC to end the progress. If PC did not receive ACK frame, then SNAP node sent overtime retransmission order. The flow chart was shown in Fig. 8.
C. SNAP node program
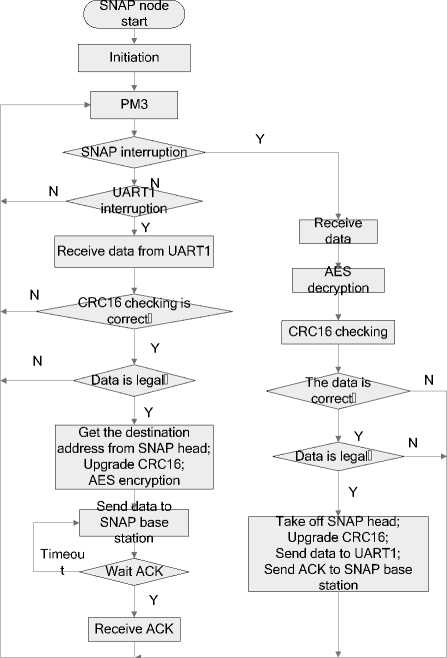
Figure 9. SNAP node program flowchart.
When SNAP nodes received data from the network, at first, it decrypted data by AES, then checked it by CRC to determine whether the destination address field data were local network address and information code field was legal, if the data was not correct or illegal, it was discarded. If the destination address field data and the data of check code field were legal, it removed the SNAP’s head, restarted CRC16 calibration and added to the end of data queue, sent to the serial port 1,and sent ACK frame to SNAP stations, ended receiving data. When place machine sent data frame to SNAP node, SNAP node base station received data through UART1, then it checked whether it was correct and data information code field was legal by CRC. If so, it added the local network addresses and SNAP base address in legal on the data’s head and added CRC check code on the data’s rear. After encrypted by AES, the data was sent to SNAP stations through wireless. Then it waited for the ACK frame from the SNAP base station until the timeout.
If the SNAP node received ACK frame, it ended the sending process. If not, then SNAP node resent retransmission order. The flowchart was shown in Fig. 7. Part of SNAP node program followed as:
BaseNodeAddr =“\x0e\x00\x01” #Destination base station address #Send data def stdinEvent(sendata): Crc16Check(sendata) Analytic(data) sdata=SnapAdd(sendata) sdata=Crc(sdata) data=AesEncry(sdata)
#Read UART1 event
#CRC16 checking
#Validity checking
#Add SNAP head #Upgrade CRC16 #AES encryption
rpc(BaseNodeAddr,'remote_rpc',data)
-
# Send data to SNAP base station
-
# Receive data
def remote_rpc(recdata):
rdata=AesDecry(recdata) Crc16Check(rdata) Analytic(rdata) data=SnapDel(rdata) data=Crc(data) print data
#Remote response event
#AES decryption
#CRC16 checking
#Validity checking
#Take off SNAP head
#Upgrade CRC16
#Print of data to UART1
rpc(BaseNodeAddr,'remote_rpc',ACK)
#Send ACK snappyGen.setHook(SnapConstants.HOOK_STDIN, stdinEvent) #Start receive event
In practical applications, the signal may be impassability due to network is busy, the bad weather, node fault, and so on. Aiming at these problems, the transmit program used ACK frame and overtime reissued mechanism. After sending a data out, the system would wait the ACK coming from the destination node. After it received the ACK, the procedure of sending was complete. Setting the overtime for 1s, if the ACK was not received in 1s, it resent data. Suppose sending data just happen collision with another node’s transmitting data, and if use equally interval to resend data, the possibility of a collision again would be very big. In order to solve this problem, overtime retransmission interval should be variable, and the interval generated by system should be a random number. Considering the power consumption, the random number was selected from 0 to 0.5s. If the network link was impassability, the sender would keep retransmitting data, so it would consume lager energy. According to this problem, the times of overtime should not exceed 10 times. As for nodes or network fault problem, when the data collector had received nothing for a long time from one node, it would send an error flag to the remote control server.
-
V. Analysis And Results
Low-power chips were used to construct the hardware, and energy conservation strategies were designed in software. One strategy was turning off the power when some chips or modules, such as the wireless module, the LCD module, the sensors module and SD16_A, were not in duty. Another strategy was working, sleeping and timer waking up. For example, after sampling the pressure and temperature, the transmitter turned off the extern modules power and went into sleeping mode until being waked up by the timer1.
-
A. Current consumption analysis
The components of current consumption were as follow: CPU was 50μA in LPM0 mode and 420μA in normal mode; MAX809ZD was 1μA in standby mode; SD16_A was 1mA in working; 24LC256 was 400μA in read operation; 3mA in write operation and 1μA in sleep mode; pressure sensor was 350μA; temperature sensor was 110μA; LCD was 1.2mA; ZICM2410 was 1μA in PM3 mode, 35mA in receive mode and 44mA in send mode; SST25VF016B was 10mA in working, 5µA in standby mode; CAT809S was 1μA in standby mode. So the current as follow:
I SAMPLE ≈420+1000+350+110=1870µA
I STORE ≈420+3000=3420µA
I READ ≈420+400=820µA
I COMMU ≈420+44000=44420uA=44.42mA
I SLEEP ≈50+5+1+1+1=58 µA
Though the communication current was 44.3mA, but the time was short, its power consumption was not very large relatively. LS-14250 1/2AA Li-Ion battery produced by French company SAFT was used to power the transmitter, with the output voltage of 3.6V and the capacity of 1.25A*h.
If the sampling data was 4bytes, added 11bytes data head and 2 bytes CRC, so the data packet length was 17 bytes. UART baud rates is 115200, with one start bit, eight data bits, one parity bit, one stop bit, so the serial bit stream was 17*11bit and the transmit time on UART was 187b/115200bps=1630µs. When data transmitted in ZICM2410 network, would add 7 bytes SNAP head, the data packet length changed to 24bytes, and the data packets became 32bytes after filled by AES encryption, and the serial bit stream was 32*11bit in wireless transmission. Zigbee transmission rate is 250kbps, so the data transmit time was 352b/250kbps=1408µs and data processing time was about 50µs. Then the transmitter would wait to receive ACK frame after sending the data out. The ACK length was 16 bytes after it encrypted by
AES, so the time for receiving ACK was 176b/250kbps=704µs. Thus, the total time of sending a sampling data was be calculated using (2).
T SEND ≈1630µs+1408µs+704µs +50µs=3792µs (2)
If the received current consumption calculated by sending current, in theory, the energy consumption while ZICM2410 sending a data from start to end could be calculated using (3).
Q COMMU ≈3.3V*44.42mA*3792µs=5.56*10-4(J) (3)
In condition of 1MHz of the SD16_A sampling frequency and 256 OSR, the sampling conversion time was about 244µs. Then the sampling energy consumption could be calculated using (4).
Q SAMPLE ≈3.3V*1870µA*244µs*2=3.012*10-6(J) (4)
The time for flash 24LC256 storage data was 8ms, thus the storage energy consumption could be calculated using (5).
Q STORE ≈3.3V*3420µA*8ms=9.029*10-5(J) (5)
-
B. pressure and temperature sensors test
The test was to measure pressure transmitter sensor's temperature drift, so as to emendate pressure value. During the test, the pressure sensor and temperature sensor were put into a constant temperature case, and setting the temperature of the case. After the signal of the temperature sensor became respectively stability, the pressure and temperature signal values were recorded. Then changing the temperature of the case, the pressure and temperature signal values were recorded again. Repeating this measurement, pressure and temperature signal values were recorded in the whole temperature range. Then putting different weights on pressure sensor, repeating the steps above, pressure and temperature signal values were record respectively. Temperature were measured in -10°C, 0°C, 10°C, 25° C , 50°C, pressure were measured in 0MPa, 1MPa, 10MPa, 20MPa, 30MPa, 40MPa, 50MPa, 60MPa. If not to use error compensation, the measurement precision of the transmitter could be very low.
According to the measure data, it could use nonlinear error compensation algorithm to calculate the temperature drift coefficient of the pressure signal. The real pressure value could be calculated by this coefficient and the measure data of pressure and temperture. The nonlinear error compensation algorithm was described in reference [8]. After error compensation, the pressure error of the transmitter was less than 0.05% under the temperture between -10°C to +50°C.
-
C. Communication performance test
The purpose of this testing was mainly to test the reliability and communication distance of wireless pressure transmitter when it was working. Through actually test, in outdoor barrier-free environment, communication distance of the transmitter could be reached above 200m, and it worked stability. The sizes of testing data were 100bytes, the measured result was shown in table II.
In point-to-point communication test of ZICM2410 module A and module B, from the measured result could be seen the lost package rate was 0 in 300m communication distance, the rate of successfully data sending was 100%. But it started to lost package while the communication distance was over 300m. If the communication distance was over 500m, the packet loss rate was 100%, and it couldn't normal communication already.
TABLE I. S icm 2410 C ommunication D istance T est
|
Send(times) |
Receive(times) |
Packet loss |
|
10 |
10 |
0 |
|
10 |
10 |
0 |
|
10 |
10 |
0 |
|
10 |
10 |
0 |
|
10 |
10 |
0 |
|
10 |
10 |
0 |
|
10 |
8 |
20% |
|
10 |
3 |
70% |
|
10 |
0 |
100% |
In the spectrum test, the transmission distance of 16 channels were no change.
In the network test, when the distance of the two ZICM2410 modules was 400m to 600m, it could not to communicate. But putting another ZICM2410 module in the middle of the two modules, the module A and B could have normal communication again.
To ensure communication link quality and to make the minimum power consumption of transmitter, it was a suggestion that the peer-to-peer communication distance should not be over to 250 meters. In order to reduce the probability of data collision while the sensor nodes were communicating, data quantity should be as less as possible. The stagger sampling time for various sensor nodes is necessarily. To ensure the reliability of data transmission, the wireless sensor transmitter should be used for a relatively empty and barrier-free place.
From the power consumption calculation could be seen, the power consumption of the transmitter was very low, it could work more than one year under normal circumstance. From the network test, the transmitter could work in 300 meters. Due to the communication scope of oilfield was less than 300 meters generally, the transmitter could fully satisfy the actual communication needs.
-
V. Conclusions
The transmitter could collect the pressure and temperature of oil-well accurately. It used wireless communication to avoid complex wiring on-site. It could longtime continuously work for the low power consumption ability. As the oil-well data changes slowly, the sampling interval could be set in a very long time, thus, the battery life could be greatly enhanced. The transmitter fully met the actual requirements, and could be applied to other industry situations easily, such as measure the different parameters using different sensors. The transmitter’s communication distance could be up to 300m, so it was suitable to construct a short distance wireless industry testing network. It could connect to GPRS or CDMA module to construct a long distance network.
References Low-power Wireless Pressure Transmitter and Net of Oil-well Based on Zigbee
- Yan Liu, Lin Huang, Xu Yang, “Embedded System of Oil Wells Monitoring Base on GPRS,” IEEE Asia-Pacific Conference, pp. 451–454, April 2009.
- Julio Cezar Adamowski, Celso Massatoshi Furukawa, Alexander T.Mafra, Julio Cezar Adamowski, “A novel competitive learning neural network based acoustic transmission system for oil-well monitoring,”IEEE Transctions on industry applications, vol. 36, no. 2, pp. 484–491, March/April 2000.
- Xiaoyu Wu, Dongxing Pei, Chengshuai Wang, Ruijie Sun, “Design of oil well pressure measurement system based on MSP430 MCU”, Electronic Design Engineering, Vol.17 No.9, September 2009. (in Chinese).
- Texas instruments, MSP430F477 data sheet, http://focus.ti. com/lit/ug/slau056j/slau056j.pdf
- Xiwei Yang, Tianxiao Yang, Changyun Li, “Downhole pressure and temperature gauge design”, The 2nd International Workshop on Database Technology and Applications(DBTA2010). Wuhan. China, pp. 482–485, November 2010.
- James Karki, Signal Conditioning Wheatstone Resistive Bridge Sensors,Texas Instruments Incorporated, September 1999.
- Xiwei Yang, Changyun Li, TianxiaoYang. “Design of a Low-power Wireless Pressure Transmitter for Oil-well”, The 2nd International Symposium on Computer Network and Multimedia Technology(CNMT2010), Wuhan, China, Vol.2, pp. 487–490, December,2010.
- Xiwei Yang, Tianxiao Yang, “Downhole pressure gauge temperature correction model design” The 2nd International Conference on Information Engineering and Computer Science(ICIECS2010), Wuhan, China, Vol.2, pp. 1765–1768, December 2010.
