Machine Learning based Wildfire Area Estimation Leveraging Weather Forecast Data

Author: Saket Sultania, Rohit Sonawane, Prashasti Kanikar
Journal: International Journal of Information Technology and Computer Science @ijitcs
Article in issue: 1 Vol. 17, 2025.
Free access
Wildfires are increasingly destructive natural disasters, annually consuming millions of acres of forests and vegetation globally. The complex interactions among fuels, topography, and meteorological factors, including temperature, precipitation, humidity, and wind, govern wildfire ignition and spread. This research presents a framework that integrates satellite remote sensing and numerical weather prediction model data to refine estimations of final wildfire sizes. A key strength of our approach is the use of comprehensive geospatial datasets from the IBM PAIRS platform, which provides a robust foundation for our predictions. We implement machine learning techniques through the AutoGluon automated machine learning toolkit to determine the optimal model for burned area prediction. AutoGluon automates the process of feature engineering, model selection, and hyperparameter tuning, evaluating a diverse range of algorithms, including neural networks, gradient boosting, and ensemble methods, to identify the most effective predictor for wildfire area estimation. The system features an intuitive interface developed in Gradio, which allows the incorporation of key input parameters, such as vegetation indices and weather variables, to customize wildfire projections. Interactive Plotly visualizations categorize the predicted fire severity levels across regions. This study demonstrates the value of synergizing Earth observations from spaceborne instruments and forecast data from numerical models to strengthen real-time wildfire monitoring and postfire impact assessment capabilities for improved disaster management. We optimize an ensemble model by comparing various algorithms to minimize the root mean squared error between the predicted and actual burned areas, achieving improved predictive performance over any individual model. The final metric reveals that our optimized WeightedEnsemble model achieved a root mean squared error (RMSE) of 1.564 km2 on the test data, indicating an average deviation of approximately 1.2 km2 in the predictions.
Wildfires, Area Estimation, Weather Forecast Data, Machine Learning, Ensemble Learning, Burned Area Prediction
Short address: https://sciup.org/15019666
IDR: 15019666 | DOI: 10.5815/ijitcs.2025.01.01
Text of the scientific article Machine Learning based Wildfire Area Estimation Leveraging Weather Forecast Data
The phenomenon of wildfires, unplanned and uncontrolled fires caused by lightning strikes, unauthorized human-caused fires, and escape fires from prescribed burn projects [1] has been closely monitored by the Copernicus Atmosphere Monitoring Service (CAMS) [2] throughout 2023. The CAMS Global Fire Assimilation System (GFAS) [3, 4] assimilates satellite-based fire radiative power observations to estimate daily wildfires and biomass burning emissions, tracking the impacts on the atmosphere and surrounding communities. Unfortunately, many regions experienced record-breaking wildfire activity this year. CAMS data revealed that Canada experienced the highest level of wildfire carbon emissions in 2003, whereas Greece experienced the most massive wildfire in EU history. As of December 10th, global 2023 wildfires have emitted approximately 2100 megatons of carbon. The consequences of wildfires, which have ravaged several regions, such as Canada and Greece, are severe and far-reaching, profoundly impacting air quality, infrastructure, and human lives around affected zones. These fires are driven by increasingly hot and dry conditions linked to climate change, increased fuel build-up, and accelerated urbanization in fire-prone areas. Given the complex interactions between landscape properties such as fuel conditions, topography, and weather/meteorological drivers, accurately modeling final burn areas remains challenging despite advances in detection and mapping. Furthermore, the self-perpetuating cycle triggered by wildfires can exacerbate this situation. Higher temperatures promote conditions conducive to fire ignition and spread, while the resulting emissions further reduce humidity levels, and burnt-out regions cannot effectively reduce temperatures. This spiral effect contributes to the increasing prevalence of large, high-intensity wildfires across various parts of the globe. Effective modeling to improve prediction and preparedness is therefore critical. This paper investigates using numerical weather prediction data to enhance wildfire area estimates from satellite observations. By integrating information on forecasted weather conditions conducive to fire growth, it may be possible to produce more accurate predictions of final wildfire sizes. This technique has important implications for fire management, including emergency response planning, evacuation, and resource allocation. Enhanced wildfire area estimation via weather data can aid monitoring efforts and help assess the ecological and economic impacts of these destructive events. This study utilizes multiple datasets processed and compiled by IBM PAIRS Geoscope based on raw data from NASA, Copernicus, and NOAA sources. The critical dataset for modeling is wildfire data containing fire activity in Australia since 2005. This is derived from the MODIS Thermal Anomalies/Fire product (MCD14DL), which detects 1 km pixels with active fires via onboard satellite sensors. Additional datasets include historical weather observations, numerical weather predictions, vegetation indices, and land cover classifications. These supplementary datasets provide crucial spatial information on fuel conditions, terrain, and meteorological variables influencing fire ignition and spread. By integrating wildfire occurrence data with land surface and weather data, models can be developed to predict wildfire progression and the final burn area as a function of environmental conditions. Using processed geospatial datasets from IBM PAIRS allows leveraging multiple satellite and modeled data sources to improve wildfire modeling accuracy.
Figure 1 illustrates the methodology for shortlisting research papers related to wildfire prediction to be used in a literature review as follows:
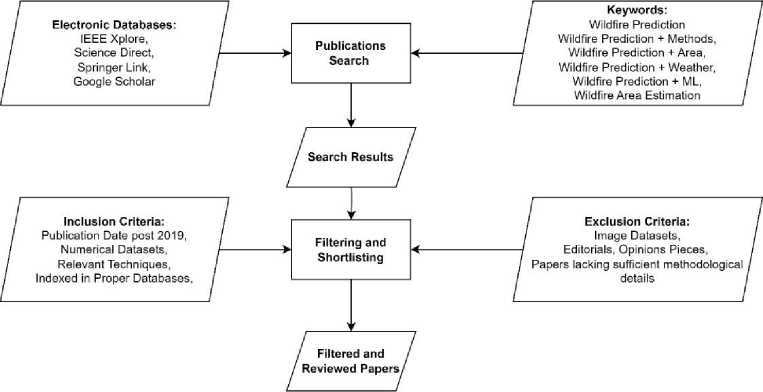
Fig.1. Flowchart of the literature review
-
• Publications Search: Search for publications via specified electronic databases such as IEEE Xplore, Science Direct, Springer Link, and Google Scholar. The following targeted keywords were used to refine the search: "Wildfire Prediction," "Wildfire Prediction + Methods," "Wildfire Prediction + Area," "Wildfire Prediction + Weather," "Wildfire Prediction + ML (Machine Learning)," and "Wildfire Area Estimation."
-
• Search Results: Collect the initial database search results via the above keywords.
-
• Inclusion and Exclusion Criteria: The inclusion and exclusion criteria were applied to the initial search results to narrow the list.
o Inclusion Criteria : Include papers published after 2019 that contain numerical datasets, describe relevant techniques, and are indexed in the proper databases.
o Exclusion Criteria : Exclude papers that primarily on image datasets, editorials, opinion pieces, conference proceedings, papers lacking sufficient methodological details, and papers that were not peer-reviewed were excluded.
• Filtering and Shortlisting: The inclusion and exclusion criteria were used to filter out irrelevant papers. This step may involve reading abstracts, methodologies, and conclusions to ensure the papers meet the specified criteria.
• Filtered and Reviewed Papers: The remaining papers that passed the filtering and shortlisting process are considered suitable for the literature review on wildfire prediction. These papers should be compiled, organized, and reviewed in depth to extract valuable information and data for the literature review.
2. Related Works
This methodology ensures that the research papers selected for the literature review are recent, relevant, and high quality, focusing on the various aspects of wildfire prediction necessary for the study.
Wildfire prediction and management have attracted significant research interest, with machine learning (ML) and deep learning (DL) approaches at the forefront. Neural networks, in particular, have been explored for their potential to predict the scale of wildfires. Reference [5] applies neural networks to model wildfire spread, emphasizing the importance of preprocessing climate variables such as snow cover in regions like Canada. The study successfully demonstrates the utility of these models in forest management but identifies challenges in generalizing to different geographies. Key performance metrics like accuracy and receiver operating characteristic (ROC) analysis are used for validation, highlighting the potential of neural networks while recognizing the complexities of generalization. This research lays the foundation for integrating machine learning into environmental contexts, especially with practical wildfire prevention strategies.
Moving beyond neural networks, IoT-based systems have emerged to enhance wildfire detection. Reference [6] presents an innovative bushfire detection system utilizing IoT sensors to distinguish between natural fires and false alarms. The system achieves high accuracy and efficiency by incorporating ML algorithms, demonstrating significant potential for early detection. The research evaluates system performance through metrics like the F-score and Moran's index, demonstrating the viability of real-time applications. This sets the stage for integrating IoT data with ML to provide early warnings and rapid responses in wildfire management.
Satellite data also plays a crucial role in wildfire susceptibility analysis. Reference [7] integrates soil moisture data from NASA's SMAP and MODIS instruments with fire activity measurements to identify high-risk regions in Australia and California. The study underscores the importance of satellite data in fire risk forecasting, particularly for post-wildfire management strategies like erosion control and water quality assessments. This research informs the current project’s use of satellite-driven environmental variables, integrating them to improve wildfire area prediction models.
Wildfire risk assessment models must address challenges like data imbalance and geographical specificity. Reference [8] explores using one-class classification algorithms to tackle these issues, offering a comparative analysis of ML models across regions. Although promising, geographical specificity remains a limitation. This is directly relevant to the current project’s objective of developing a robust model that generalizes across diverse environments. Similarly, Reference [9] tailors ML models to specific environmental contexts in Algeria's Mediterranean region, constructing a prediction model based on ten input variables. Despite limited data availability, the research offers a comprehensive evaluation through metrics like accuracy, precision, recall, and F1 scores. Building on these findings, the current project tailors its models to regional climate conditions using weather forecast data for enhanced accuracy.
A global wildfire prediction model leveraging satellite remote sensing data is introduced in Reference. [10], where a comprehensive dataset encompassing vegetation, soil, and weather variables is processed with ML algorithms to predict wildfire occurrences. Despite the model’s global applicability, challenges like data accessibility and technical limitations persist. This study’s spatial data integration for wildfire estimation informs the current project’s approach to leveraging remote sensing data for improved predictions.
Meteorological variables such as temperature, humidity, and wind speed are essential for wildfire predictions. Reference [11] investigates ML models, including artificial neural networks, multiple linear regression, and random forest, for predicting forest fires based on meteorological data. While these models effectively identify high-risk zones, the small dataset limits broader applicability. The current project addresses this limitation by incorporating a more extensive dataset of meteorological variables, improving prediction accuracy for wildfire spread.
Bayesian networks have proven effective in managing the inherent uncertainties of wildfire prediction. Reference [12] develops a risk assessment model combining topographic, climatic, and human factors, using fuzzy numbers to address uncertainties. GIS is employed for spatial analysis, and this study guides the current project’s uncertainty management approach through ensemble modeling and probabilistic methods, ensuring more reliable wildfire predictions.
Deep learning techniques, particularly convolutional neural networks (CNNs), have shown promise in detecting fire from image data. Reference [13] expands on this by applying CNNs to satellite imagery, where fire spread and intensity are predicted using time-series data. The study demonstrates high prediction accuracy, though it lacks real-time applicability. This informs the current project’s emphasis on real-time forecasting, incorporating satellite and weather data for dynamic fire prediction.
Real-time wildfire monitoring and prediction are crucial research areas. Reference [14] presents a CNN-based forest fire prediction model trained on images, demonstrating high accuracy (94.3%) but lacking validation across diverse datasets. The current project builds on this by applying ML to non-image data, specifically weather forecasts and satellite observations, ensuring model adaptability across varying environmental conditions.
Reference [15] introduces a cost-effective sensory circuit for atmospheric monitoring combined with ML for realtime fire detection. This approach emphasizes real-time detection and mapping, providing valuable insights for fire management strategies. The current project incorporates real-time weather forecast data, which, combined with ML, aims to offer actionable predictions of wildfire spread and severity.
Various ML algorithms for wildfire prediction are compared in References [16, 17], focusing on accuracy, precision, recall, and F1 scores. These studies reveal challenges like data dependency and model tuning, which are crucial considerations for the current project. By leveraging ensemble models and integrating diverse datasets, the current project aims to overcome these limitations and provide robust wildfire area predictions that generalize across regions.
Reference [18] expands on this by integrating spatial-temporal analysis into wildfire prediction, where ML models such as LSTMs are employed to capture temporal dependencies in weather data. The study finds that incorporating spatial-temporal dynamics improves the precision of wildfire predictions, though model complexity and data requirements increase significantly. The current project leverages similar approaches but balances complexity with efficiency by incorporating ensemble learning techniques alongside temporal data.
Building on these studies, Reference [19] introduces an ensemble XGBoost model for wildfire area estimation, which integrates various environmental factors, including meteorological, topographical, and satellite data. The model shows robust performance across diverse regions, highlighting its scalability and adaptability. This forms the foundation for the current project’s ensemble approach, incorporating spatial-temporal analysis and uncertainty quantification for a comprehensive wildfire area prediction model.
From the insights gained from previous research, this project proposes a method for wildfire area estimation that integrates weather forecast data with machine learning models. Ensemble modeling, analysis, and uncertainty-aware approaches reflect advancements in the field while addressing the limitations identified in earlier studies. This structured approach ensures that the current model is adaptable and reliable, significantly contributing to the wildfire prediction and management field.
In summary, various machine learning and deep learning approaches have been explored for wildfire prediction and management, each with strengths and limitations. As we seek to build on these prior works and further advance the state-of-the-art methods, we propose our method for wildfire area estimation leveraging weather forecast data and machine learning. Recognizing the challenges around data quality, model generalization, and uncertainty quantification that surfaced in previous research, we propose an approach that fuses ensemble modeling with spatial-temporal analysis to achieve robust and reliable predictions. Neural networks show promise in modeling fire complexity but can face generalization difficulties. Integrating IoT sensors and ML enables early detection and rapid response, whereas satellite data aids risk zone identification through soil moisture analysis. One-class classification and Bayesian models address data imbalance and uncertainty issues. Although careful validation is warranted, CNNs and LSTMs have strengths in image-based fire recognition and meteorological forecasting. Ensemble XGBoost models show efficient large-scale risk mapping but may require optimization for maximal accuracy. By synthesizing diverse data sources, uncertainty-aware neural network architectures, and probabilistic postprocessing, our method aims to offer highly accurate and operationally relevant wildfire area estimates. The following sections detail our technical approach, experiments, and results toward pushing the boundaries of machine learning-based wildfire modeling and prediction.
3. Methodology
Figure 2 illustrates the methodology processes followed for the execution of the project:
-
3.1. Data Loading and Inspection
Loading Data : The dataset, sourced from [20] and merged on "Date" and "Region," was incorporated into a Pandas data frame. This dataset consists of weather-related time series data from 2005 to 2021. This process was essential, as the DataFrame structure in Pandas provides a convenient and efficient platform for data manipulation and analysis.
-
3.2. Data Cleaning
-
3.3. Handling Missing Values
Initial Observation : Methods such as head () provide an immediate snapshot of the dataset's initial rows, allowing for a preliminary understanding of data features. The shape method was pivotal in determining the dataset's size, providing insights into the number of records and attributes.
Column Renaming : Columns associated with vegetation indices underwent a renaming procedure to maintain consistency and improve readability. A systematic naming convention helps better understand data and manipulation during subsequent stages. The columns "Vegetation_index_max," "Vegetation_index_min," "Vegetation_index_mean," and “Vegetation_index_variance” corresponding to the vegetation indices were renamed "Vegetation_Index_Max," "Vegetation_Index_Min," "Vegetation_Index_Mean" and “Vegetation_Index_Variance.” The terms ‘vegetation indices’ and ‘climatic indices’ refer to specific sets of environmental measurements used in the study. Vegetation indices quantify vegetation health, while climatic indices pertain to temperature, humidity, and precipitation metrics. Consistent usage of these terms is critical for accurately interpreting model inputs and outputs.
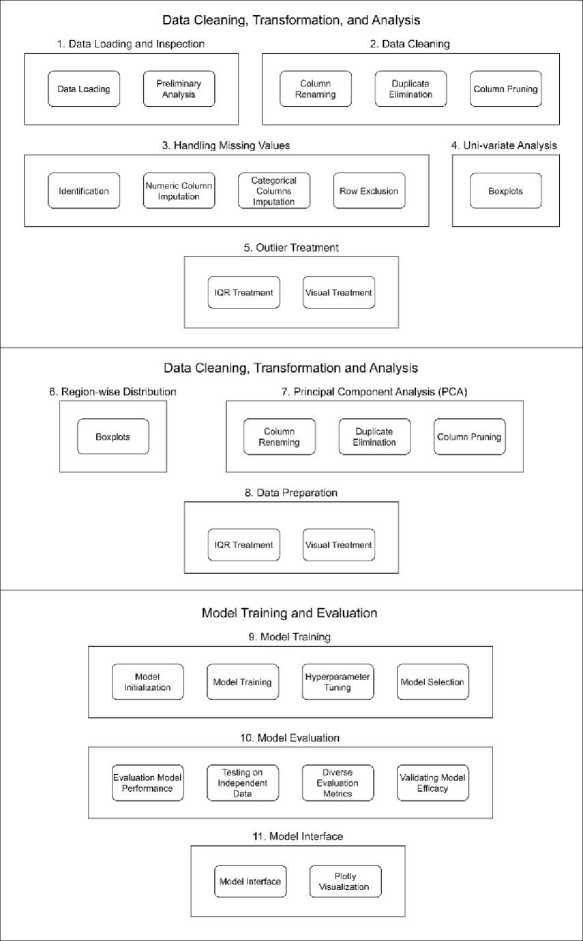
Fig.2 . Methodology process followed
Duplicate Elimination : Duplicates could lead to overrepresenting specific data points, thus skewing the analysis. The drop_duplicates () method ensured that such redundancies were promptly addressed.
Column Pruning : A reasonable approach to data analysis involves focusing on relevant features. Some columns, after assessment, were deemed non-contributory to the study's objectives and hence were excluded. Columns such as "Mean_Confidence," "Std_Confidence," "Var_Confidence," "Count," "Replaced," "Vegetation_index_std," "Vegetation_index_max," "Vegetation_index_min," "Vegetation_index_mean" and "Vegetation_index_variance" were deemed nonessential and were removed.
Identification : Recognizing columns with incomplete data is the precursor to any imputation strategy. A thorough scan ensured that all the columns were earmarked for appropriate treatment.
Numeric Column Imputation : Missing value treatment for numeric columns depends on their semantics. For columns with semantic suffixes such as '_Mean,' '_Max,' or '_Min,' logical derivations were employed. When a 'mean' value was absent, but corresponding 'max' and 'min' values were present, an arithmetic average filled the gap.
Categorical Column Imputation : The most common value (mode) was the logical choice for imputation for nonnumeric columns, ensuring minimal disturbance to the data distribution. The columns 'Region' and 'Date' are examples of non-numeric columns.
Row Exclusion : Some rows had pervasive missingness across all the metrics for certain features. These rows contained more noise than value, necessitating their removal. For some weather indices, no data were provided for the suffixes '_Mean,' '_Max,' or '_Min'; such records were removed from the dataset.
-
3.4. Univariate Analysis
-
3.5. Outlier Treatment
Boxplots : These visual representations are instrumental in grasping various attributes' central tendency, spread, and skewness. The boxplots, especially when compared before and after outlier handling, provided insights into how the data distributions were refined. Boxplots were generated for the weather attributes "precipitation," "relative humidity," "soil water content," "solar radiation," "temperature," and "wind speed." Figure 3 shows a boxplot for the climatic indices before outlier removal. The figure shows boxplots for the climatic indices before and after outlier removal, demonstrating how removing outliers improved the distribution of critical variables such as temperature and precipitation.
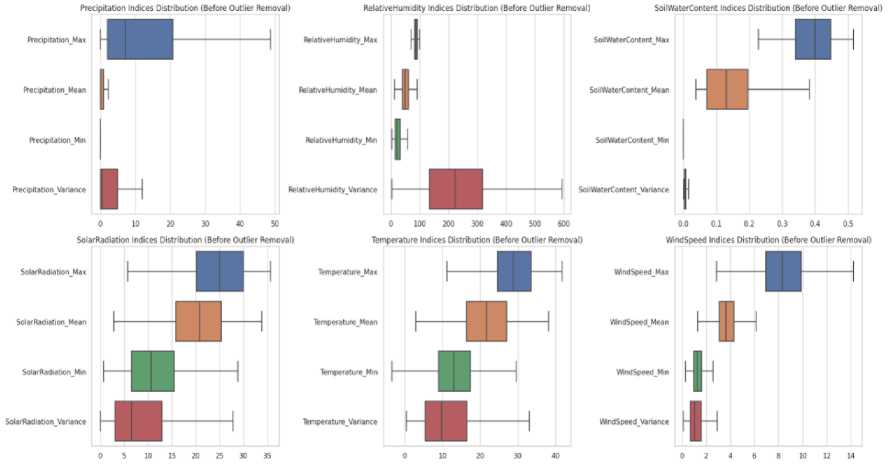
Fig.3. Pre-outlier removal climatic indices boxplot: distributions of the maximum, mean, assessment, and variance values for key weather indices before outlier removal, providing an overview of data extremes for initial wildfire risk assessment
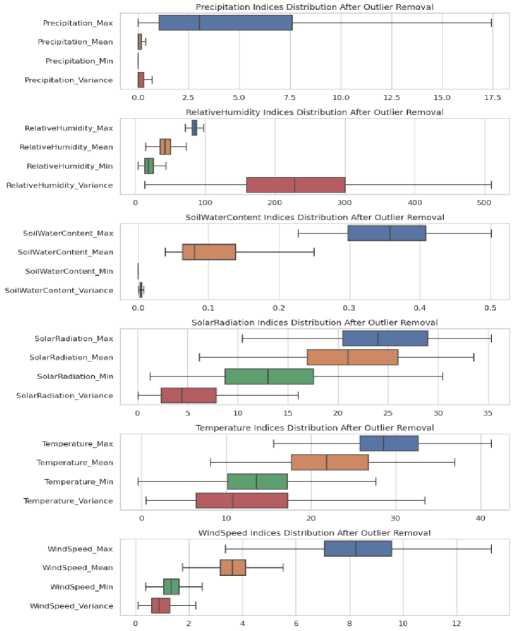
Fig.4. Post-outlier removal climatic indices boxplot: refined data distributions of climatic indices after outlier mitigation are essential for enhancing the accuracy of wildfire prediction models
IQR Method : Using the interquartile range (IQR) provides a robust method to discern potential outliers. The values falling outside the computed bounds were outliers. The IQR method was used to remove outliers from the weather attributes "precipitation," "relative humidity," "soil water content," "solar radiation," "temperature," and "wind speed" with the suffixes ‘_Mean,' '_Max,' '_Min' or '_Variance.'
Visualization : Generating boxplots after the outlier treatment phase was indispensable for visualizing how the data distributions had been optimized. Figure 4 shows a boxplot for the climatic indices after outlier removal.
-
3.6. Region-wide Distribution
-
3.7. Principal Component Analysis (PCA)
Histograms : These plots provide insights into how different attributes behave across various regions. By discerning these distributions, regional patterns and anomalies can be recognized. The region-wise distribution was visualized for all attributes and their respective suffixes. Figure 5 shows the histogram distributions of the regional climatic factors, revealing distinct regional differences in weather patterns contributing to variations in wildfire risks. These visualizations are integral to understanding the data preprocessing steps and their impact on model performance.
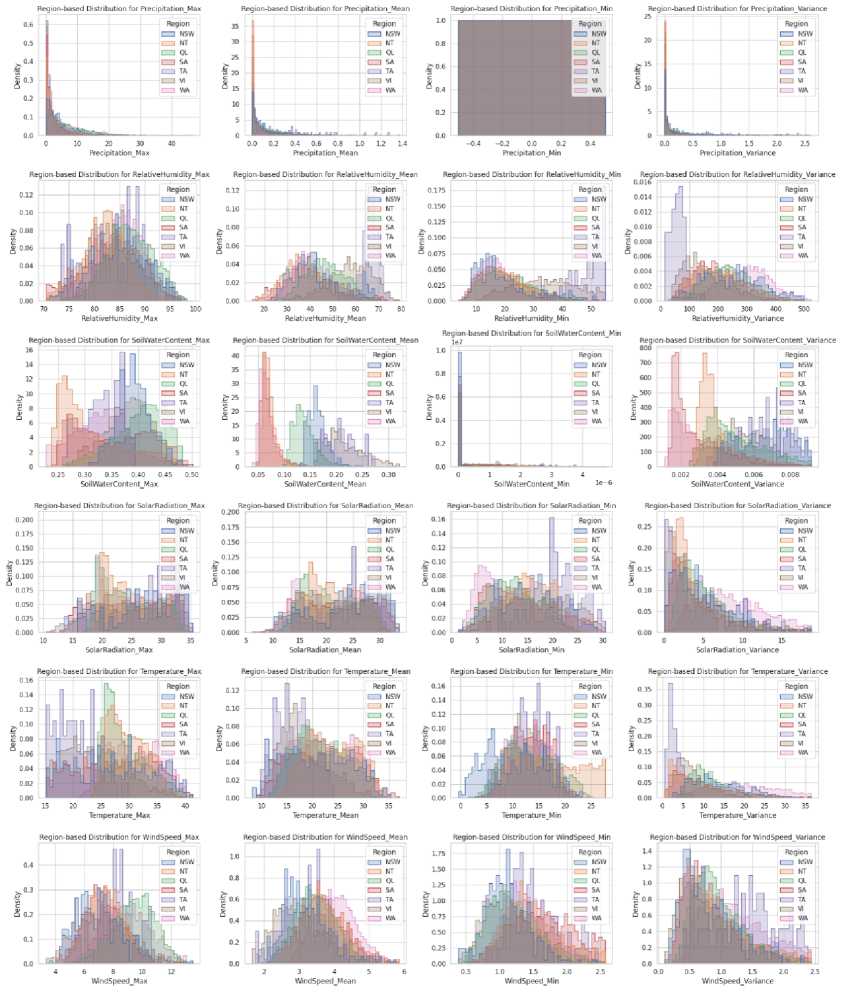
Fig. 5. Regional climatic factors histogram distribution: detailed histogram analysis displaying the frequency of various climatic factors across different regions, aiding in the regionalization of wildfire prediction efforts
Pattern Recognition : Employing PCA allows synthesizing the data's information into fewer dimensions, facilitating the recognition of inherent patterns. The suffixes ‘_Mean,' '_Max,' '_Min,' or '_Variance' can be synthesized into a single dimension.
Variance Analysis : Plotting the explained variance helps determine the significance of each principal component, guiding decisions on dimension reduction. Attributes such as "precipitation," "relative humidity," and "soil water content" required 2 PCA components, whereas "solar radiation," "temperature," and "wind speed" required 3 PCA components to extract the most information from their respective suffixes.
Euclidean Distance : In the PCA-transformed domain, distances from the origin for each data point serve as a metric that could be instrumental for clustering or anomaly detection tasks. Figure 6 shows a bar chart for the principal components of the wildfire indices; the y-axis shows the amount of information retailed concerning the number of components denoted in the x-axis.
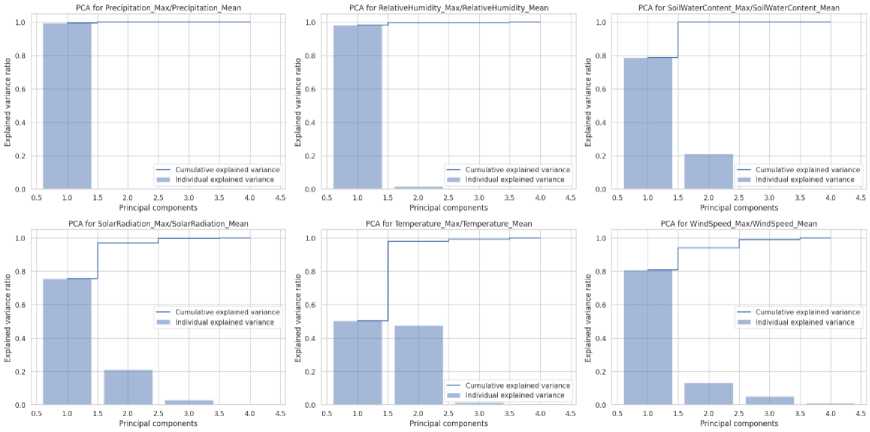
Fig.6. Principal components for wildfire indices. Bar chart: Visualization of principal components derived from the climatic index, highlighting the most significant factors influencing wildfire predictions
-
3.8. Data Splitting
-
3.9. Model Training
The dataset was split into training and testing subsets to ensure the model's generalizability, with each subgroup echoing the overall data distribution. Figure 7 shows biplots for the PCA variance of the climatic indices.
Employing the AutoGluon Framework : In this phase, we utilized the AutoGluon framework, known for its robustness in automated machine learning. This approach enables systematic exploration of diverse models and hyperparameters, leading to selecting the best-performing model.
Defining the Target Variable and Problem Type : The target variable for this task was "Estimated_fire_area," framing the problem as a regression task. The objective was to predict a continuous numerical value.
Assessing Model Performance : We evaluated the model's performance via the root mean squared error (RMSE), a widely accepted metric for regression tasks. The RMSE quantifies the average deviation of the predicted values from the actual values, measuring the model's accuracy. Therefore, the ‘eval_metric’ parameter for Autogluon was set to ‘root_mean_squared_error’.
Setting Time Limit for Training : To ensure efficient resource management and prevent overfitting, we imposed a time limit of 7200 seconds (2 hours) for the training process.
Leveraging AutoGluon's Model Selection : AutoGluon utilizes a variety of machine-learning algorithms and automatically chooses and refines models based on the dataset and type of problem. This process involves ensembles, gradient boosting, and neural networks. AutoGluon accomplishes this by laying models and training them sequentially, transforming raw data into accurate predictions within a specified time frame. By carefully partitioning the data and monitoring out-of-fold examples, this approach helps prevent overfitting.
Hyperparameter Optimization : AutoGluon extensively searches over hyperparameter spaces to identify the optimal settings for each model. This process ensures that the models are finely tuned to the specific characteristics of the data. AutoGluon optimizes key hyperparameters for each algorithm type, including but not limited to learning rates, tree depths, number of estimators for ensemble methods, regularization strengths, and neural network architectures. The search space for each hyperparameter is automatically defined based on best practices and scaled according to the dataset size and available computational resources.
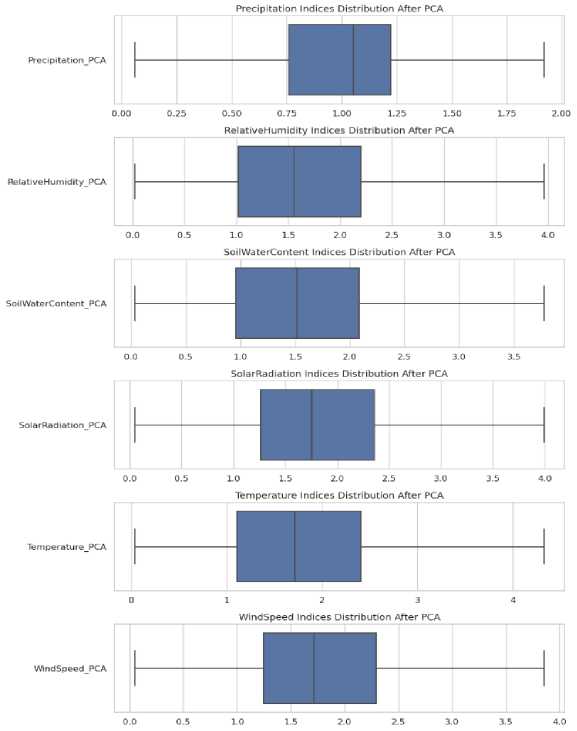
Fig.7. Climatic indices PCA variance biplots: principal component analysis plots showing the explained variance ratios for climatic factors help identify critical variables in wildfire detection models
Selecting the Best Model : After the training phase, we used a method provided by the predictor to automatically pinpoint and choose the model that demonstrated the highest performance, a determination based on the selected evaluation metric (in this case, the RMSE).
-
3.10. Model Evaluation
-
3.11. Model Interface
Evaluating Model Performance : Following the model training phase, it was imperative to assess its performance to ensure an accurate estimation of wildfire areas.
Testing on Independent Data : The trained model was evaluated on a separate test dataset that it had never encountered during training. This step emulates real-world scenarios, indicating the model's ability to generalize to new, unseen data.
Diverse Evaluation Metrics : Various metrics were computed to assess the model's performance comprehensively. The RMSE was employed to quantify the average prediction error and measure the model's accuracy.
Interpreting Model Predictions : Besides numerical metrics, efforts have been made to interpret the model's predictions. This involved techniques such as feature importance analysis, providing insights into which variables exerted the most influence in predicting wildfire areas. Stakeholders, such as emergency response teams and policymakers, may require more precise explanations of how certain variables influence predicted fire areas. Tools can be employed in future iterations to provide more granular interpretability of the model’s outputs.
Validating Model Efficacy : The evaluation results were instrumental in validating the model's effectiveness for wildfire area estimation. The RMSE and other metrics were clear benchmarks for assessing the model's performance.
Gradio-Enabled Model Interface : The model interface, developed via Gradio, enables users to estimate wildfire areas quickly. It seamlessly incorporates parameters such as estimated fire brightness, estimated fire radiative power, precipitation, relative humidity, soil water content, solar radiation, temperature, and wind speed.
Interactive Severity Visualization through Plotly: Moreover, the interface hosts an interactive and dynamic plot powered by Plotly. This graphical representation actively categorizes wildfire severity into distinct zones based on the estimated fire area. It identifies regions with an estimated fire area less than 38.22 units as 'Low Severity,' whereas areas exceeding 38.22 units but remaining less than 146.43 units are designated as 'Moderate Severity.' Finally, regions exceeding 146.43 units are labeled 'High Severity,' indicating potentially significant fire impacts. This visual tool enables users to assess the potential severity of wildfires across different regions promptly. Figure 8 illustrates the user interface created for forecasting wildfire spread.
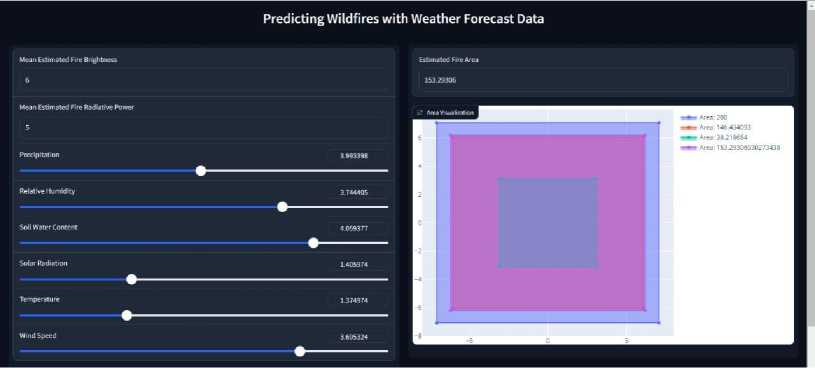
Fig.8. Wildfire prediction interactive dashboard interface: A user-centric dashboard that integrates weather forecast data with sliders to predict and visualize potential wildfire characteristics such as fire brightness and affected area
4. Advantages
Combining these insights allows us to discern the holistic benefits of the project in the realm of wildfire detection. A detailed discussion of the advantages is as follows:
-
4.1. Data-Driven Decision Making
-
4.2. Early Wildfire Detection
-
4.3. Enhanced Wildfire Management
-
4.4. Robustness Against Outliers
-
4.5. Reproducibility and Flexibility
Initial Exploration : The project involves comprehensive data exploration, including visualizations and statistics. This gives stakeholders insights into the current wildfire situation, setting the foundation for initiative-taking and informed decision-making.
Feature Correlation : By understanding the interrelationships between variables, decision-makers can prioritize efforts on the most influential factors impacting wildfire severity.
Model Predictions : Leveraging advanced machine learning tools such as AutoGluon, the project can predict the potential severity and area of wildfires. Early detection can significantly reduce the associated costs, which are both monetary. Furthermore, environmental issues can be addressed by enabling timely interventions.
Feature Importance : Understanding which variables most significantly influence the spread or severity of wildfires enables resource allocation to areas of most concern. For example, if specific environmental or meteorological conditions strongly affect wildfires, management efforts can focus on monitoring and addressing those factors.
Robust Scaling : Utilizing RobustScaler ensures that extreme values or outliers influence the modeling process less. This is crucial for wildfire datasets, which may often have such outliers due to the unpredictable nature of wildfires.
Data Splitting with a Set Seed : The project uses a set seed for reproducibility in data splitting. This ensures consistent results across different runs, enabling more accurate comparisons and evaluations.
Model Serialization : By saving the trained model and the scalers using joblib, the project provides flexibility for real-time predictions in the future without retraining, leading to efficiency in operations.
4.6. Optimized Predictive Modelling
4.7. Detailed Evaluation
4.8. Contribution to Research and Conservation:
5. Disadvantages5.1. Data Limitations
AutoGluon Capabilities : AutoGluon, a state-of-the-art automated machine learning tool, ensures that the project obtains the best possible model without extensive manual hyperparameter tuning. This saves time and results in better predictive performance.
Model Evaluation Metrics: The project comprehensively evaluates the trained models, ensuring the stakeholders know the model's reliability and performance.
Detailed EDA : Extensive data analysis can benefit immediate wildfire detection, prevention, and academic research. This information can be used to understand wildfire patterns, their causes, and potential preventive measures.
In conclusion, this project is a potent wildfire detection and management arsenal tool. Leveraging detailed exploratory data analysis and advanced predictive modeling promises to provide tangible benefits in early detection, optimized resource allocation, and informed decision-making in the critical wildfire conservation and management domain.
While the project offers several advantages in wildfire detection, it is essential to consider these limitations. The following is a detailed discussion of the potential limitations of the project in the realm of wildfire prediction:
Incomplete Variables : While the EDA provides comprehensive insights into the available variables, the dataset might encompass only some factors relevant to wildfire prediction, such as local vegetation, soil moisture, and human activities.
Potential Biases : Predictions may not generalize well to other regions or periods if the dataset primarily originates from specific geographic areas or periods.
-
5.2. Modelling Limitations
-
5.3. Scalability Concerns
Fixed training time: Model training is set with a fixed time limit (7200 s). While this ensures that the model training runs smoothly, it may only sometimes be sufficient to explore all potential model configurations, especially for larger datasets.
-
5.4. Operational Constraints
-
5.5. Evaluation Limitations
-
5.6. External Factors
Assumptions of Independence : Machine learning models often assume that data points are independent. However, intricate interdependencies can influence wildfires, such as how a fire in one region might affect neighboring regions.
Overfitting Risk : Despite the use of advanced tools such as AutoGluon, there is always a risk of overfitting, where the model might perform exceptionally well on the training data but needs to generalize unseen data.
Generalization to Different Regions : The model's ability to generalize to regions with varying environmental conditions remains challenging. The data used in this study predominantly reflects the environmental conditions of specific regions, potentially limiting the model’s performance in other areas with different climates, fuel types, or topographies. Future research should explore the model's adaptability to diverse biomes, perhaps by including regionspecific data or model re-training.
Model Update Frequency : The project must specify how often the model should be retrained. Wildfire patterns can change due to numerous factors, making updating models regularly for accurate predictions crucial.
Hardware Requirements : The model uses GPU acceleration (num_gpus: 1). Organizations without access to GPUs might find it challenging to replicate or scale the model efficiently.
Single-Metric Focus : This project primarily evaluates the model via the root mean squared error (RMSE). While the RMSE is a popular metric for regression tasks, relying solely on it might overlook other aspects of model performance, such as prediction bias.
Unpredictable Events : Wildfires can be triggered or influenced by unpredictable events like lightning strikes or sudden human activities. These unforeseen factors might not be represented in the data but can significantly impact actual events.
Climate Change Dynamics : As climate change accelerates, its influence on wildfires becomes more pronounced. The historical data might need to capture these rapidly evolving dynamics more effectively.
5.7. Interpretable Insights
6. Results
Model Interpretability : While AutoGluon provides feature importance metrics, ensemble models, which often yield the best predictive performance, can be complex and challenging to interpret. This might make it difficult for stakeholders to understand and trust the model's predictions fully.
In summary, while the project provides a robust framework for predicting wildfires, it is essential to be aware of its limitations. Addressing these limitations in future iterations and considering additional data sources, modeling techniques, and evaluation metrics can further enhance its effectiveness in wildfire prediction.
We implemented an automated machine learning approach using AutoGluon to develop a regression model for predicting wildfire-burned areas based on weather and satellite data. Seventeen algorithms were trained, including neural networks, forests, boosted trees, and k-nearest neighbor regressors. The model selection process is automated as AutoGluon tries to fit various types of models. Each model type has various hyperparameters that automatically and iteratively test values for hyperparameters to produce the best performance on the validation data. Table 1 shows that boosting models like CatBoost and LightGBM are often the best performers, given their ability to handle categorical features, efficiency with large datasets, and the benefits of ensemble learning. The models were optimized to minimize the root mean square error (RMSE) between the validation dataset's predicted and actual fire sizes.
The table summarizes vital results, including validation scores, inference times, and training times, providing insights into computational efficiency and training duration. This research informs future efforts to enhance wildfire prediction systems, offering detailed insights for more effective and timely responses to mitigate the impact on ecosystems and communities.
Table 1. Model evaluation metrics from AutoGluon
|
Method |
Validation Score |
Inference Time |
Train Time |
|
WeightedEnsemble_L2 |
1.88 |
30.20 |
1330.15 |
|
CatBoost_BAG_L2 |
1.88 |
32.29 |
4134.71 |
|
WeightedEnsemble_L3 |
1.88 |
35.76 |
4020.29 |
|
LightGBMXT_BAG_L1 |
1.88 |
19.98 |
507.97 |
|
LightGBMXT_BAG_L2 |
1.88 |
34.77 |
3691.15 |
|
LightGBM_BAG_L2 |
1.90 |
32.76 |
3663.17 |
|
LightGBM_BAG_L1 |
1.90 |
3.04 |
326.42 |
|
LightGBMLarge_BAG_L1 |
1.90 |
6.37 |
495.15 |
|
LightGBMLarge_BAG_L2 |
1.92 |
33.36 |
3817.76 |
|
CatBoost_BAG_L1 |
1.92 |
0.47 |
2003.21 |
|
XGBoost_BAG_L1 |
1.92 |
1.35 |
472.57 |
|
ExtraTreesMSE_BAG_L1 |
1.97 |
0.23 |
0.55 |
|
ExtraTreesMSE_BAG_L2 |
1.98 |
32.22 |
3336.18 |
|
RandomForestMSE_BAG_L1 |
1.99 |
0.30 |
1.88 |
|
RandomForestMSE_BAG_L2 |
2.00 |
32.28 |
3340.52 |
|
KNeighborsDist_BAG_L1 |
2.06 |
0.79 |
0.03 |
|
KNeighborsUnif_BAG_L1 |
2.07 |
0.78 |
0.03 |
The WeightedEnsemble_L2 model attained the best validation performance, blending four top performers into an integrated predictor. Ensembling multiple models enables accuracy gains over individual techniques. Among the standalone models, CatBoostRegressor achieved the lowest validation error. Overall, tree-based methods and neural networks outperform k-nearest neighbor regressors. Figure 9 shows the performance metrics.
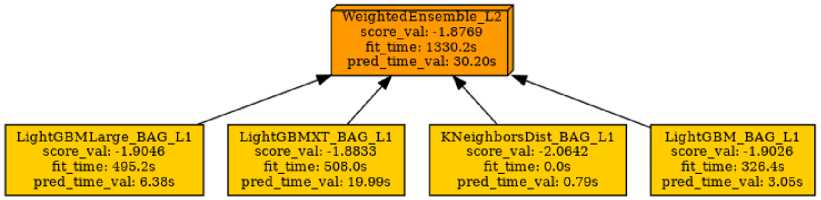
Fig.9. Model Ensemble Performance Metrics: A diagram comparing individual machine learning models' validation score, fit, prediction time, and a weighted ensemble method
We quantified the generalization ability of the WeightedEnsemble on an unseen test set. The primary evaluation metric remained the RMSE between the observed and forecasted burn areas. The model achieved an RMSE of 1.564 km2 on the test data, indicating an average deviation of approximately 1.2 km2 in predictions. To provide a more comprehensive evaluation, we also calculated the Mean Absolute Error (MAE) of 0.758 km2, representing the average magnitude of errors without considering their direction. Additionally, the coefficient of determination (R²) was 0.36, suggesting that the model explains about 36% of the variability in wildfire areas. While the RMSE and MAE indicate reasonably accurate predictions, the moderate R² value highlights room for improvement in capturing all drivers of fire progression. However, the current capability is sufficient for projecting resource allocation and postfire impacts early in rapidly evolving significant incidents when detailed perimeter mapping is lacking.
These initial results demonstrate the viability of data fusion in leveraging Earth observations and numerical model forecasts to support wildfire preparedness and response. The estimated burn zones help size evacuation zones, predict air quality declines, and guide recovery efforts. Mapping the preliminary event magnitude for 2-3 days facilitates the mobilization of proportional emergency assets. Empirically relating model outputs to operational decisions over time can optimize planning. While future iterations will seek to increase accuracy, this work pioneers a broadly generalizable approach to augment evidence-based decision-making for weather-driven disasters. This research pioneers a data fusion approach that blends Earth observations and numerical forecasts to enhance evidence-based decision-making and response efficiency when uncontained wildfires endanger people and land resources. The following steps involve incremental model refinement and establishing statistical operational guidance benchmarks customized to address enduser risk management needs.
7. Conclusions
Through this research, we developed and evaluated a robust framework for predicting wildfire areas via sophisticated machine-learning techniques. By analyzing meteorological variables, we created a predictive model to estimate wildfires' potential severity and spread. Our approach leverages the strength of AutoGluon to automate model training and optimization, ensuring high predictive accuracy with minimal manual intervention.
It is essential to acknowledge the limitations of our study. Data limitations, such as incomplete variables and potential biases, can affect the model's generalizability. Furthermore, the model's scalability and requirement for regular updates to capture changing wildfire patterns due to changes in climatic factors are critical areas for future improvement.
One limitation of this study is the lack of consideration for future climate scenarios. As climate change continues to alter temperature and precipitation patterns, the conditions under which wildfires occur may shift, impacting the reliability of predictions based solely on historical data. Future work should incorporate simulations of future climate scenarios to understand how changing weather patterns might affect the accuracy of wildfire predictions.
The project's current scope offers foundational capabilities in wildfire detection and prediction. However, the rapidly evolving landscape of data science and environmental monitoring presents numerous opportunities for refinement and expansion. Restricted generalization owing to the lack of robust fuel, terrain, soil, and weather representations constrains transportability across biomes. However, promising capabilities warrant nurturing reliability through ecological data science advances. Specifically, leveraging multidimensional data fusion and abrasive computing offers pathways to augment the predictive infrastructure. Multispectral satellite image time series tracking of vegetation health could enable advanced neural networks to distill richer environmental shift representations. Blending such imagery datasets with climatological records supports training deeper convolutional architectures adept at characterizing fuels and topography. Deploying an expansive real-time wildfire monitoring infrastructure that combines ground-based and orbital sensors would provide the dynamic data streams needed to tune complex models adaptively [21, 22]. Converting immense volumes of fire-related image data into early alerts further requires innovative analytics and change detection techniques. Given the increase in mega-fire costs, the continuous enhancement of predictive systems through neural data fusion should guide science-based mitigation. This study confirms the feasibility of this approach; achieving operational accuracy now depends on deliberately cultivating model robustness.
Our research contributes to wildfire management by providing a dependable, data-driven tool for early wildfire detection and severity estimation. Future work should address the identified limitations, incorporate more diverse data sources, and continuously refine the model to increase its accuracy and applicability across different regions and conditions. By advancing the capabilities of wildfire prediction models, we aim to support more effective management strategies, reducing the devastating impact of wildfires on ecosystems and human communities.
References Machine Learning based Wildfire Area Estimation Leveraging Weather Forecast Data
- “Wildfire Statistics.” Accessed: Aug. 03, 2024. [Online]. Available: https://crsreports.congress.gov/product/pdf/IF/IF10244/59
- ‘2023: A year of intense global wildfire activity | Copernicus’. Accessed: Aug. 03, 2024. [Online]. Available: https://atmosphere.copernicus.eu/2023-year-intense-global-wildfire-activity
- ‘Global fire monitoring | Copernicus’. Accessed: Aug. 03, 2024. [Online]. Available: https://atmosphere.copernicus.eu/global-fire-monitoring
- H. Setchell, ‘Global Fire Assimilation System’, ECMWF. Accessed: Aug. 03, 2024. [Online]. Available: https://www.ecmwf.int/en/forecasts/dataset/global-fire-assimilation-system
- H. Liang, M. Zhang, and H. Wang, ‘A Neural Network Model for Wildfire Scale Prediction Using Meteorological Factors’, IEEE Access, vol. 7, pp. 176746–176755, 2019, doi: 10.1109/ACCESS.2019.2957837.
- M. R. Nosouhi, K. Sood, N. Kumar, T. Wevill, and C. Thapa, ‘Bushfire Risk Detection Using Internet of Things: An Application Scenario’, IEEE Internet Things J., vol. 9, no. 7, pp. 5266–5274, Apr. 2022, doi: 10.1109/JIOT.2021.3110256.
- N. Sazib, J. D. Bolten, and I. E. Mladenova, ‘Leveraging NASA Soil Moisture Active Passive for Assessing Fire Susceptibility and Potential Impacts Over Australia and California’, IEEE J. Sel. Top. Appl. Earth Obs. Remote Sens., vol. 15, pp. 779–787, 2022, doi: 10.1109/JSTARS.2021.3136756.
- F. N. Ismail and S. Amarasoma, ‘One-class Classification-Based Machine Learning Model for Estimating the Probability of Wildfire Risk’, Procedia Comput. Sci., vol. 222, pp. 341–352, Jan. 2023, doi: 10.1016/j.procs.2023.08.173.
- A. Zaidi, ‘Predicting wildfires in Algerian forests using machine learning models’, Heliyon, vol. 9, no. 7, p. e18064, Jul. 2023, doi: 10.1016/j.heliyon.2023.e18064.
- Y. O. Sayad, H. Mousannif, and H. Al Moatassime, ‘Predictive modeling of wildfires: A new dataset and machine learning approach’, Fire Saf. J., vol. 104, pp. 130–146, Mar. 2019, doi: 10.1016/j.firesaf.2019.01.006.
- T. Preeti, S. Kanakaraddi, A. Beelagi, S. Malagi, and A. Sudi, ‘Forest Fire Prediction Using Machine Learning Techniques’, in 2021 International Conference on Intelligent Technologies (CONIT), Jun. 2021, pp. 1–6. doi: 10.1109/CONIT51480.2021.9498448.
- M. Naderpour, H. M. Rizeei, and F. Ramezani, ‘Wildfire Prediction: Handling Uncertainties Using Integrated Bayesian Networks and Fuzzy Logic’, in 2020 IEEE International Conference on Fuzzy Systems (FUZZ-IEEE), Jul. 2020, pp. 1–7. doi: 10.1109/FUZZ48607.2020.9177700.
- A. Malik, N. Jalin, S. Rani, P. Singhal, S. Jain, and J. Gao, ‘Wildfire Risk Prediction and Detection using Machine Learning in San Diego, California’, in 2021 IEEE SmartWorld, Ubiquitous Intelligence & Computing, Advanced & Trusted Computing, Scalable Computing & Communications, Internet of People and Smart City Innovation (SmartWorld/SCALCOM/UIC/ATC/IOP/SCI), Oct. 2021, pp. 622–629. doi: 10.1109/SWC50871.2021.00092.
- A. S. Oliver, U. Ashwanthika, and R. Aswitha, ‘Detection of Forest Fire using Convolutional Neural Networks’, in 2020 7th International Conference on Smart Structures and Systems (ICSSS), Jul. 2020, pp. 1–6. doi: 10.1109/ICSSS49621.2020.9202200.
- K. Revathi, T. Tamilselvi, R. Arunkumar, and T. Divya, ‘Spot Fire: An Intelligent Forest Fire Detection System Design With Machine Learning’, in 2022 International Conference on Automation, Computing and Renewable Systems (ICACRS), Dec. 2022, pp. 532–537. doi: 10.1109/ICACRS55517.2022.10029044.
- A. Singh, R. Yadav, G. Sudhamshu, A. Basnet, and R. Ali, ‘Wildfire Spread Prediction using Machine Learning Algorithms’, in 2023 14th International Conference on Computing Communication and Networking Technologies (ICCCNT), Jul. 2023, pp. 1–5. doi: 10.1109/ICCCNT56998.2023.10308041.
- V. Bharathi and C. PeddaReddy, ‘Comparison of Forest Fire Prediction System using Machine Learning Alogrithms’, in 2023 3rd International Conference on Advance Computing and Innovative Technologies in Engineering (ICACITE), May 2023, pp. 1539–1542. doi: 10.1109/ICACITE57410.2023.10182818.
- C. Ran and L. Fang, ‘Prediction model of forest fire area based on the improved Extreme Gradient Boosting’, in 2021 2nd International Conference on Computer Communication and Network Security (CCNS), Jul. 2021, pp. 16–19. doi: 10.1109/CCNS53852.2021.00011.
- N. Omar, A. Al-zebari, and A. Sengur, ‘Deep Learning Approach to Predict Forest Fires Using Meteorological Measurements’, in 2021 2nd International Informatics and Software Engineering Conference (IISEC), Dec. 2021, pp. 1–4. doi: 10.1109/IISEC54230.2021.9672446.
- H. Hamann and J. S. May 2021, ‘Predicting Wildfires with Weather Forecast Data’, IBM Developer. Accessed: Sep. 07, 2024. [Online]. Available: https://developer.ibm.com/exchanges/data/all/spot-challenge-wildfires/
- V. Vinodhini, M. R. S. Kumar, S. Sankar, D. Pandey, B. K. Pandey, and V. K. Nassa, ‘IoT-based early forest fire detection using MLP and AROC method’, Int. J. Glob. Warm., vol. 27, no. 1, pp. 55–70, Jan. 2022, doi: 10.1504/IJGW.2022.122794.
- D. Gao, J. Xin, and F. Zhang, ‘A decision tree algorithm for forest fire prediction based on wireless sensor networks’, Int. J. Embed. Syst., vol. 13, no. 4, pp. 422–430, Jan. 2020, doi: 10.1504/IJES.2020.110656.
