MADLVF: An Energy Efficient Resource Utilization Approach for Cloud Computing

Автор: J.K. Verma, C.P. Katti, P.C. Saxena
Журнал: International Journal of Information Technology and Computer Science(IJITCS) @ijitcs
Статья в выпуске: 7 Vol. 6, 2014 года.
Бесплатный доступ
Last few decades have remained the witness of steeper growth in demand for higher computational power. It is merely due to shift from the industrial age to Information and Communication Technology (ICT) age which was marginally the result of digital revolution. Such trend in demand caused establishment of large-scale data centers situated at geographically apart locations. These large-scale data centers consume a large amount of electrical energy which results into very high operating cost and large amount of carbon dioxide (CO_2) emission due to resource underutilization. We propose MADLVF algorithm to overcome the problems such as resource underutilization, high energy consumption, and large CO_2 emissions. Further, we present a comparative study between the proposed algorithm and MADRS algorithms showing proposed methodology outperforms over the existing one in terms of energy consumption and the number of VM migrations.
Green ICT, virtualization, cloud computing, dynamic VM Consolidation
Короткий адрес: https://sciup.org/15012117
IDR: 15012117
Текст научной статьи MADLVF: An Energy Efficient Resource Utilization Approach for Cloud Computing
Published Online June 2014 in MECS
Cloud computing is a wide term used for applications and services that executes over a distributed network using virtualized resources and accessed through commonly used networking protocols. It delivers computing services as a utility similar to the public goods on a metered basis. Virtualization technology powers cloud computing by allowing creation of multiple virtual machines ( VM ) over the underlying hardware and improves resource utilization. A VM is a software implementation of the Instruction Set Architecture ( ISA ) at the application layer of the system that provides abstraction from the underlying hardware.
Cloud computing promise to deliver the power of a supercomputer facilitated by a large collection of hardware resources which is referred as resource-pooling. High level of resource pooling has led to the establishment of large-scale datacenters. These large-scale data centers consume an enormous amount of electrical energy and results into a high operating-cost, a large amount of carbon dioxide (CO2) emission and heat content which becomes surplus to our environment. On the other hand, CO2 act as a greenhouse gas (GHG) and do not allow the trapping out of thermal radiation into the space. Therefore, the heat produced due to the IT infrastructure, loops into our environment, and contribute towards the effect of global warming. High power consumption by large scale data centers led to the high CO2 emission that causes concentration of more GHGs into the environment and further deepens the effects of global warming. As per a study, it is estimated that energy costs will contribute around 25% to the overall operating cost of a data center by 2014 [1]. Studies suggest that the dominating operating cost of an inefficient data center will cause a low Return on Investment (RoI) during the entire course of its usage. The most important factor behind high power consumption is under-utilization of the resources deployed in the large-scale data centers.
The problem of energy inefficiency can be mitigated by the help of Virtualization technologies that allows creation of multiple instances of VMs over the physical hosts deployed in a data center as resources [2]. Each of the VM operates as an independent computation unit to execute various applications. Virtualization technology helps to improve overall utilization of the physical hosts and increase RoI. VMs executing on the physical hosts can be migrated across the several physical hosts and allows the clean separation between software and hardware, avails fault management, load balancing including low level system maintenance [3]. Live migration of VMs facilitates consolidation of VMs over the fewer physical hosts without suspending the jobs in execution that causes reduced power consumption and lower CO 2 emission into the environment. Dynamic consolidation of VMs presents an ideal model for sustainable and eco-friendly way of computing. This paper focuses upon the energy-efficient resource management strategy that can be applied in a large-scale data center. We propose MADLVF algorithm for dynamic VM consolidation that can reduce power consumption significantly. Further, we present the comparative study between MADLVF and MADRS algorithm to show high performance of the proposed algorithm.
The remainder of the paper is structured as follows. In Section II we review the related work on green computing. In Section III we present the system model on which CloudSim works in context to our experimental setup. In Section IV we present the methodology to achieve energy efficiency that deals with overloading detection, the existing heuristic and the proposed scheme of VM selection criteria form overloaded host, underloading detection and VM placement. Section V present performance evaluation of existing heuristic and proposed scheme and gives the experimental results. We discuss the future directions of research and conclude the paper in Section VI.
strategies in [9] for energy efficient allocation of resources to overcome the problem of static threshold values.
In contrast to the discussion made above, we propose an energy efficient algorithm for reallocation of resources using an adaptive technique, Median Absolute Deviation ( MAD ), of setting threshold values dynamically based on the set of VMs instantiated and past historical data of resource usage by the VMs.
-
II. Related Work
Nathuji and Schwan proposed [4] local and global resource management strategies where VM consolidation is achieved by global policies using live migration. Kusic and others [5] used Limited Lookahead Control ( LLC ) to address the problem of continuous consolidation in terms of sequential optimization. They used a complex model using simulation-based learning but execution time was high enough even for small number of nodes. On the contrary, the proposed algorithm is based on a heuristic that aims high performance for large infrastructure.
Verma and others [6] have proposed pMapper for placement of applications in a virtualized system which is power and migration cost-aware based on the idea of binpacking problem with differently sized bin where servers represent the bins and VMs represent the balls. On the contrary, the proposed algorithm does not ensure the Service Level Agreement ( SLA ) negotiated due to workload variability.
Gmach and others in [7] and Beloglazov and others in [8] have worked upon the static threshold based approach for dynamic workload consolidation. This approach is not suitable for an Infrastructure-as-a-Service ( IaaS ) environment serving different application due to the reason that static values of the threshold do not help much for dynamic and unpredictable workload. Beloglazov and others proposed several adaptive
-
III. System Model
-
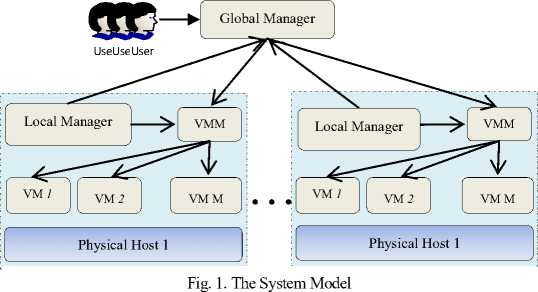
A. Beloglazov and others [9] have suggested the system model focusing upon a large-scale infrastructure as shown in Fig. 1. In this paper, we target an IaaS environment which is represented by a large-scale data center. The data center consists of N heterogeneous physical hosts and capabilities of each host are characterized by the following three attributes:
-
(i) Performance of CPU, that is, Million Instructions Per Second ( MIPS ) it can execute;
-
(ii) Amount of the RAM; and
-
(iii) Network bandwidth provisioned for the host.
The system model is a two level architecture that consists of a global manager and local manager. Global manager sits upon the master host and gathers information from all the local managers to manage overall resource utilization. Meanwhile, The local manager sits upon each of the physical hosts as a module of the Virtual Machine Monitor ( VMM ) and monitors CPU utilization of the host, resizes VMs as per their resource requirement and performs decision making for migration of a particular VM from a host. Live migration of VMs is enabled by providing Network Attached Storage ( NAS ). The following power model and live migration cost has been taken into consideration during the simulation study:
-
A. Power Model
Due to the rapid spread of multi-core systems and virtualization technologies, modern data centers are associated with the very large amount of memory and it started dominating on the proportion of power consumption by data center [10]. Developing a new analytical formula for power consumption is a complex research problem. Therefore, we utilize a set of real data on power versus performance provided by SPECpower benchmark [11] as shown in Table 1.
Table 1. Power consumption model for the selected servers on different load (Watts)
|
Server |
0% |
10% |
20% |
30% |
40% |
50% |
60% |
70% |
80% |
90% |
100% |
|
HP Proliant G4 |
86 |
89.4 |
92.6 |
96 |
99.5 |
102 |
106 |
108 |
112 |
114 |
117 |
|
HP Proliant G5 |
93.7 |
97 |
101 |
105 |
110 |
116 |
121 |
125 |
129 |
133 |
135 |
-
B. Live Migration Cost
Live migration of VMs enables transfer of VMs executing on one host to another host without suspending applications executing on the VM. Live migration causes some disadvantages viz. a short downtime and performance degradation of the application. Experimental study by Voorsluys and others [12] suggested that the duration of downtime and performance degradation for a VM depends upon the number of memory pages updated by the application during its period of execution. The simulation and modeling of our work allocates same amount of CPU capacity on the destination host as much as required by a VM on the overloaded host during the course of migration and causes some SLA violations, therefore, number of VM migrations has to be minimized. The duration of a single migration is directly proportional to the total amount of memory used by a VM and inversely proportional to the available bandwidth for the VM. Beloglazov and others [9] have defined the migration time and performance degradation suffered by a VM j as shown in (1).
M tn + m
T = —, U, = 0.1 -I / j u itt) dt,
-
mjBj , djt0 j,
Where U is the total performance degradation by d j
VM j , t is the time when migration starts, and T is 0
the time taken to complete the migration, u ( t ) is the CPU
j utilization by VM j , M is the amount of memory used by VM j , and B is the available bandwidth to the VM.
-
IV. Methodology
A data center is a collection of physical hosts or servers that are the basic computation units of a data center. The physical hosts often remain under-utilized below its capacity of computation and causes excessive power consumption. Therefore, it is useful to migrating VMs on fewer hosts and switching idle hosts to either minimum power consumption mode or turn off them and the process is referred to as VM consolidation. Setting up utilization threshold of servers helps to avoid SLA violations and improves resource utilization. Static VM consolidation strategies are not always helpful to serve our purpose and, therefore, dynamic consolidation strategies should be adopted to further improve the resource utilization. Beloglazov and others [9] have proposed several heuristics for dynamic consolidation based on historical past data of resource usage by the
VMs. They split the problem of consolidation into four sub-problems:
1.0
Z = T - A uu

T u
A u
0.5
Physical Host
0.0
Fig. 2. Schematic representation of the dynamic VM consolidation problem for single host
-
(i) Overloading detection;
-
(ii) VM Selection for migrating off the overloaded host;
-
(iii) Underloading detection; and
-
(iv) Finding a new VM placement for migrated VMs from overloaded and underloaded hosts both.
The dynamic VM consolidation problem for a single host, in context to our problem, can be illustrated by the following mathematical formulation as shown below in (2) through (5) and in Fig. 2.
min Z = T - A(2)
uu s.t.
T - A > 0
uu
T , A > 0
u,u and T , A < 1
u,u where T is the utilization threshold of the physical host and A is the actual utilization of the physical host. The mathematical formulation points out that actual utilization of the physical host must be lesser than or equal to utilization threshold of the physical host to prevent potential SLA violations. However, T is not fixed and A has to be set accordingly to make a host nonoverloaded, therefore, an optimum solution cannot be provided. Henceforth, we look for near-optimal solution that minimize the gap between T and A to achieve energy efficiency for the deployed system. The problem can be split into four parts as discussed below in the Section 4.1 through 4.4.
-
A. Overloading Detection
Beloglazov and others proposed migration of VMs based on upper and lower thresholds of utilization for hosts where violation of upper threshold causes one or more VMs to migrate from the host to prevent SLA violation [13]. To avoid static values of utilization thresholds, the need is to apply a robust statistic that provides an alternative approach to a classical approach [14]. MAD has been proposed in [9] as a suitable and robust technique for auto-adjustment of upper utilization threshold based on historical past data. MAD act as a robust statistic for a data that contains outliers or nonnormal distribution as it is more resilient to outliers as compared to standard deviation or any other statistic.
Consider a univariate data set as X X .... X . Hence,
1, 2,,
MAD can be defined as median of the absolute deviations from the median of data as shown in (6):
MAD = median^ (| X^ - median^. (X^.) |),
Utilization threshold ( ) can be defined as shown in
T = 1 - 5 ■ MAD.
u where 5 e R+ is a safety parameter to define how aggressively the system consolidate VMs for safety of method. Lower the value of s lower will be the power consumption but higher will be the SLA violations and vice-versa. For our experimental study, we have chosen 5 = 2.5 to be the safe value.
-
B. VM Selection
This section describes principle criteria for selection of VMs to migrate from an overloaded host so that host becomes non-overloaded. The following two policies are taken into consideration for the purpose of comparative study:
-
a. Random Selection:
Random Selection (RS) policy select VMs for migration as per the uniformly distributed discrete d random variable X = U(0 | Vj |), whose values index set of
VMs V allocated to a host j [9].
-
b. Least VM in CPU Utilization First:
VMs selected for migration according to RS policy may create a larger void between T and A causing to resource underutilization. Therefore, we propose Least VM in CPU utilization First (LVF) policy for VM selection to migrate off an overloaded host for the purpose of minimizing the gap between T and A . The proposed VM selection policy sorts all the VMs in increasing order of CPU utilization that are executing on an overloaded host and selects a VM for migration present at 0th index of the sorted list, or smallest in terms of CPU utilization, in order to eliminate minimum load from the host in each iterative step. The process repeats until the host does not become non-overloaded, that is, utilization of the host reaches below the threshold utilization ( T ) for the host.
-
C. Underloading Detection
After processing all the hosts for overloading detection, as per the criteria described in Section 4.1, all the hosts are processed for underloading detection. The minimum utilized host among all the hosts is considered to be underloaded host. Therefore, an underloaded host suffers migration of all the VMs executing on the host.
-
D. VM Placement
The problem of VM placement can be viewed as binpacking problem where the physical hosts are considered as differently sized bins and the VMs to be placed can be considered as objects to be filled in the bins [15]. It is a decision problem and NP-hard in nature. Therefore, Power-Aware Best Fit Decreasing ( PABFD ) algorithm is applied that uses not more than 11/9 ■ OPT + 1 bins so that least increase of the power consumption caused due to reallocation of VMs where OPT is the number of bins provided by the optimal solution [9], [13], [16].
Algorithm 1. MADLVF
Algorithm: MADLVF(hostList) # Pm - power model
-
1. Initialize simulation parameters;
-
2. Repeat
-
3. foreach host in hostList do
-
4. if (hostUtilization> 1- 5 ■ MAD ) then
-
5. vmsToMigrate.add (LVF (host) )
-
7. vmsToMigrate.clear( )
-
8. Repeat
-
9. foreach host in hostList do
-
10. i f (isHostMinUtilized(host) ) then
-
11. vmsToMigrate.add(host.getVmList( ) )
-
13. r eturn migrationMap
. (vmsToMigrate))
. (vmsToMigrate))
Procedure: LVF (host)
-
1. Begin
-
2. migratableVms —— getMigratableVms (host)
-
3. migratableVms —— sortByCpuUtilization(migratableVms)
//Sorting VMs of current host in ascending order of CPU utilization
-
4. return migratableVms.get(0)
//Returns smallest VM in CPU utilization
-
V. Performance Evaluation
-
A. Workload Data
Table 2. Workload traces characteristics (CPU utilization)
|
Date |
Number of VMs |
Mean |
St. dev. |
Q1 |
Median |
Q3 |
|
03/03/2011 |
1052 |
12.31% |
17.09% |
2% |
6% |
15% |
|
03/04/2011 |
1463 |
12.39% |
16.55% |
2% |
6% |
17% |
-
B. Performance Evaluation Metrics
Beloglazov and others have discussed several performance evaluation metrics in [9] for cloud computing framework viz. Energy consumption, SLAV, and VM migrations. Those metrics are calculated in the following manner as described below:
-
a. Energy Consumption
Energy consumption by a data center amounts to the overall energy consumed by various components of the data center viz. CPU, disk storage, memory, power supply units and air cooling systems [10]. The energy consumption metric takes into consideration the power model as discussed in section 3.1. Recent studies [5], and [18] shows that power consumption can be explained by a linear relationship between power consumption and CPU usage. Therefore, power-consumption can be written as a function of CPU utilization in the following manner as shown in (8).
P (u) = kP + (1 - k) P u max max
where k is the fraction of energy consumed by the idle server, P is maximum power consumption by fully max utilized server and u is the CPU utilization. As per the power model, idle power consumption for HP Proliant G4 server is 73.5% and HP Proliant G5 server is 69.41% of the fully utilized servers. Therefore, (8) can be rewritten for HP Proliant G4 and HP Proliant G5 as shown in (9) and (10), respectively.
P ( u ) = P max (0.735 + 0.265u ) (9)
P ( u ) = P max (0.694 + 03 06u ) (10)
Utilization of the servers varies due to variability in workload and it is considered to be as a function of time: u ( t ). Overall energy consumption can be written as shown in (11) [19].
-
b. SLAV
Service Level Agreement (SLA) is defined as the QoS requirements negotiated between Cloud provider and customer in terms of minimum throughput and maximum response time. These parameters are workload dependent and vary for different application. SLAs are said to be delivered when 100% of performance requested by an application, executing inside a VM, is provided in a time bound manner. Beloglazov and others [9] have proposed the following metrics that are workload independent to measure the SLA violations:
-
(i) SLA Violation Time per Active Host ( SLATAH ):
The percentage of time during which active hosts experienced 100% CPU is as shown in (12).
1 N T
SLATAH = Z (12)
Ni = 1 Tai
-
(ii) Performance Degradation due to Migration ( PDM ):
The overall performance degradation due to live migration of VMs on the other physical hosts is as shown in (13).
1 M Cd
PDM = — Z — j-M j = 1 Crj
where N is the number of physical hosts; T is the time si period during which the host i has experienced the utilization level of 100% causes SLA violations; T is the total time period of the host i being in active state; M is the number of VMs; C estimation of performance degradation suffered due to live migration of VM j ; C is the total CPU capacity demanded by the VM j during its life time. To capture impact of both the metrics SLATAH and PDM on SLA violations the combined metric, SLAV, can be written as shown in (14).
E = J P ( u ( t )) dt
SLAV = SLATAH x PDM
Therefore, CPU utilization of a physical host must be improved to reduce energy consumption in data center.
-
c. VM Migrations
Live migration allows transfer of VMs among physical hosts without suspension and with a small downtime [9].
Live migrations causes negative impact on application’s performance executing in a VM in terms SLATAH and PDM (or SLA violations). Applications executing in a VM causes updating memory pages and, therefore, suffers downtime proportional to the number of memory pages updated by applications during the migration. On the other hand, in a real kind setting higher VM migrations poses bandwidth constraint and increased internet cost. Therefore, it is essential to reduce the number of VM migrations and that is why it has been chosen as a one of the metric of performance evaluation.
-
C. Experimental Setup
We have targeted an IaaS environment which is supposed to avail infinite computing resources to the user. Therefore, it is essential to evaluate the proposed algorithm on a large-scale virtualized infrastructure. We have chosen simulation as an alternative method to evaluate performance of the proposed algorithm and to ensure repeatability of the experiment rather than implementing on a real infrastructure. The CloudSim toolkit [20], [21] has been chosen as simulation platform as it offers all the functionalities of Cloud computing environment. We have modified the simulator itself to carry out our experimentation study.
We have simulated a large-scale data center that comprises 800 heterogeneous physical hosts, half of which are HP Proliant ML 110 G4 servers, and rest of the half consists of HP Proliant ML 110 G5 servers. The power consumption characteristics of the servers are shown in Table 1. Each server is configured to have network bandwidth of 1 GB/s. We have modeled four types of VMs which corresponds to Amazon EC2 instance types [22]:
-
(i) High-CPU Medium Instance (2500 MIPS, 0.85 GB);
-
(ii) Extra Large Instance (2000 MIPS, 3.75 GB);
-
(iii) Small Instance (1000 MIPS, 1.7 GB); and
-
(iv) Micro Instance (500 MIPS, 613 MB).
Initially, VMs are provisioned according to their resource requirements and over-subscription of VMs is allowed. During the course of simulation, VMs resizes their demand for resources and create opportunities for dynamic consolidation.
-
D. An Illustrative Example
0.1}.
0.2 = {0.1, 0.1, 0, 0, 0.2, 0.4, 0.7}
Let us assume that CPU utilization for a set of hosts = {0.1, 0.1, 0.2, 0.2, 0.4, 0.6, 0.9}; and CPU utilization by the VMs executing on a particular host H = {0.4, 0.2, 0.2,
Step 1: MAD
Median of utilization level of set of hosts = 0.2
Absolute deviation about the median
Median Absolute Deviation (MAD) = 0.1 Threshold Utilization
T = 1 - s • MAD = 1 - 2.5 * 0.2 u
= 0.75
Step 2: Overloading detection
Overall utilization of host H is
A = (0.4 + 0.2 + 0.2 + 0.1)
= 0.9
Check { T^ < A } False {Host is overloaded}
Therefore, some of the VMs have to be migrated from the host H .
Step 3: LVF
Sorting VMs executing on a host H in terms of CPU utilization = {0.1, 0.2, 0.2, 0.4}
Iterative Steps 1 :
Check { T > A } False
VMs executing on the host H in terms of CPU utilization = {0.1, 0.2, 0.2, 0.4}
After migrating a VM of least CPU utilization from the host H , A = 0.8
Iterative Step 2 :
Check { T > A^ } False
VMs executing on the host H in terms of CPU utilization = {0.2, 0.2, 0.4}
After migrating a VM of least CPU utilization from the host H , A = 0.6
Iterative Step 3 :
Check { T > A^ } True
Stop
Repeat Step 1 to 3 until all the hosts are processed.
Step 4: Underloading detection Find minimum utilized host.
Migrate all the VMs from minimum utilized host.
Table 3. Simulation Results of MADRS and MADLVF heuristics
|
Workload |
Policy |
Energy (kWh) |
SLAV |
VM migrations |
|
|
03/03/2011 |
MADRS |
69.46 |
0.58 |
12,465 |
|
|
MADLVF |
56.76 |
0.88 |
9,757 |
||
|
Difference |
12.70 |
- 0.30 |
2,708 |
||
|
03/04/2011 |
MADRS |
94.29 |
0.58 |
15,591 |
|
|
MADLVF |
81.63 |
0.80 |
12,645 |
||
|
Difference |
12.66 |
- 0.22 |
2,946 |
||
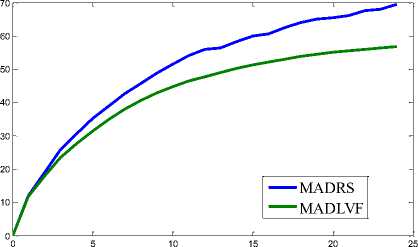
SLAV SLAV Energy Consumption (kWh) Energy Consumption (kWh)
Time (Hours)
consumption for workload traces of 03/03/2011
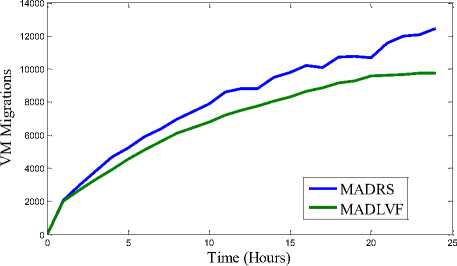
(e) VM Migrations for workload traces of 03/03/2011
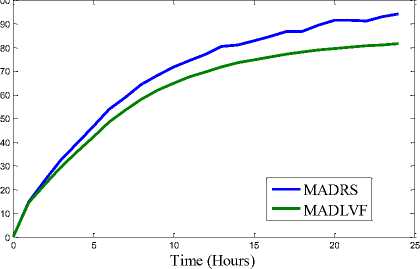
consumption for workload traces of 03/04/2011
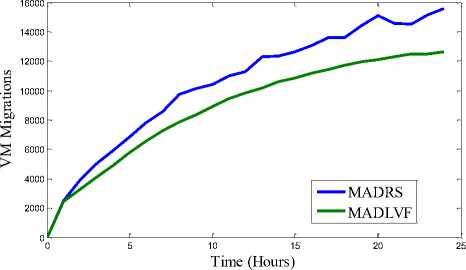
(f) VM Migrations for workload traces of 03/04/2011
Fig. 3. Results of Simulation
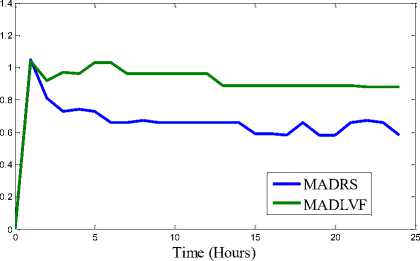
(c) SLAV for workload traces of 03/03/2011
Step 5: VM Placement
Placement of all the migrated VMs from overloaded and underloaded hosts is according PABFD algorithm [9].
-
E. Simulation Results
We have performed extensive simulation on the two algorithms: MADRS and MADLVF. To capture variation pattern of performance metrics (viz. Energy consumption, SLAV, VM Migrations) we performed simulation for 1, 2, 3, …..upto 24 hours for each algorithm with respect to each of the workload traces. These combinations have resulted into total 96 iterations. Results shown in Table 3 are obtained through simulation period of 24 hours followed by graphs for performance metrics in Fig.3.
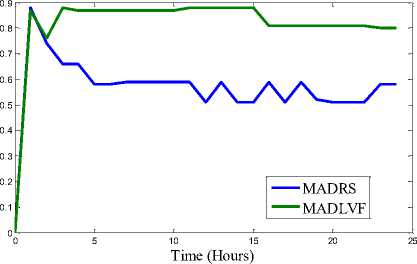
(d) SLAV for workload traces of 03/04/2011
-
VI. Conclusion
Energy efficient resource management techniques such as dynamic VM consolidation can cut-down CO2 emission and increase RoI for Cloud providers by switching-off the idle servers in order to eliminate idle power consumption. However, dynamic VM consolidation can result into SLA violation due to workload variability. In this paper, we proposed MADLVF algorithm based on dynamic VM consolidation strategy for auto adjustment of threshold value. We have evaluated the proposed algorithm for a large-scale IaaS environment through extensive simulation on CloudSim simulation toolkit using workload traces from CoMon project of PlanetLab VMs. The results of comparative study between MADLVF and MADRS have shown that the proposed algorithm significantly outperforms over MADRS in regard to the energy consumption and VM migrations metrics. However, MADLVF results into slightly higher SLA violations as compared to MADRS but it is within tolerable limits.
SLA is an important criterion for the reputation of a Cloud provider and best optimized methodologies should be adopted to improve SLA. Meanwhile, bio-inspired phenomena are the best optimized methods by the nature itself and, therefore, we propose to investigate various methodologies based on bio-inspired phenomena to improve SLA as a future direction of work.
Список литературы MADLVF: An Energy Efficient Resource Utilization Approach for Cloud Computing
- C. Belady, In the data center, power and cooling costs more than the IT equipment it supports, Electronics Cooling, Feb. 1, 2007, Accessed Dec. 10, 2013, http://www.electronicscooling.com/ articles/ 2007/feb/a3
- P. Barham et al., “Xen and the art of virtualization,” ACM SIGOPS Operating Systems Review, vol. 37, no. 5, Dec. 2003, pp. 164-177.
- C. Clark et al., “Live migration of virtual machines,” Proc. ACM/USENIX Symp. on Netw. Syst. Design & Implementation, Berkeley, CA, USA, pp. 273-286, May 02-05, 2005.
- R. Nathuji, and K.Schwan, “Virtualpower: Coordinated power management in virtualized enterprise systems”, ACM SIGOPS Operating Systems Review, vol. 41, no. 6, Dec. 2007, pp. 265–278.
- D. Kusic, J.O. Kephart, J.E. Hanson, N. Kandasamy, and G. Jiang, “Power and performance management of virtualized computing environments via lookahead control”, Cluster Computing, vol. 12, no. 1, Mar. 2009, pp. 1-15.
- A. Verma, P. Ahuja, and A. Neogi, “pMapper: Power and migration cost aware application placement in virtualized systems,” Proc. 9th ACM/IFIP/USENIX Int’l Conf. Middleware (Middleware 2008), Leuven, Belgium, pp. 243–264, Dec. 01-05, 2008.
- D. Gmach, J. Rolia, L. Cherkasova, and A. Kemper,“Resource pool management: Reactive versus proactive or let’s be friends,” Computer Networks, vol. 53, no. 17, Dec. 2009, pp. 2905-2922.
- A. Beloglazov and R. Buyya, “Energy efficient allocation of virtual machines in cloud data centers,” Proc. of the 10th IEEE/ACM Int’l. Symp. Cluster, Cloud and Grid Computing, Melbourne, Australia, pp. 577-578, May 17-20, 2010.
- A. Beloglazov and R. Buyya, “Optimal online deterministic algorithms and adaptive heuristics for energy and performance efficient dynamic consolidation of virtual machines in Cloud data centers”. Concurrency and Computation: Practice and Experience, Vol. 24, issue 13, Sept. 2012, pp. 1397-1420.
- L. Minas and B. Ellison, Energy Efficiency for Information Technology: How to Reduce Power Consumption in Servers and Data Centers, USA: Intel Press, 2009.
- Standard Performance Evaluation Corporation, SPEC Benchmark Suites, Accessed Sep 27, 2013. http://www.spec.org/power_ssj2008/
- W. Voorsluys, J. Broberg, S. Venugopal, and R. Buyya, “Cost of virtual machine live migration in clouds: A performance evaluation”, Porc. 1st Inte’l. Conf. on Cloud Comput., Beijing, China, pp. 254-265, Dec. 1-4, 2009.
- A. Beloglazov, J. Abawajy, and R. Buyya, “Energy-aware resource allocation heuristics for efficient management of data centers for cloud computing,” Future Generation Computer Systems, vol. 28, no. 5, May 2012, pp. 755-768.
- P.J. Huber, and E.M. Ronchetti, Robust statistics, 2nd ed., Hoboken, NJ, USA: John Wiley & Sons, 2009.
- N. Bobroff, A. Kochut, and K. Beaty, “Dynamic placement of virtual machines for managing SLA violations,” Proc. 10th IEEE Symp. Integrated Network Management, Munich, Bavaria, Germany, pp. 119-128, May 21-25, 2007.
- M. Yue, “A simple proof of the inequality for the FFD bin-packing algorithm”, Acta Mathematicae Applicatae Sinica, vol. 7, no. 4, Oct. 1991, pp. 321–331.
- K.S. Park, and V.S. Pai, “CoMon: A mostly-scalable monitoring system for PlanetLab”, ACM SIGOPS Operating Systems Review, vol. 40, no. 1, Jan 2006, pp. 65-74.
- X. Fan, W.D. Weber, and L.A. Barroso, “Power provisioning for a warehouse-sized computer”, ACM SIGARCH Computer Architecture News, vol. 35, no. 2, May 2007, pp. 13–23.
- A. Beloglezov, Energy-Efficient Management of Virtual Machines in Data Centers for Cloud Computing, doctoral dissertation, The University of Melbourne, Feb 2013.
- R.N. Calheiros et al., “CloudSim: A toolkit for modeling and simulation of cloud computing environments and evaluation of resource provisioning algorithms”, Software: Practice and Experience, vol. 41, no. 1, Jan. 2011, pp. 23–50.
- CloudSim Simulation Toolkit, Accessed on Dec. 11, 2013.https://code.google.com/p/cloudsim/downloads/detail?name =cloudsim-3.0.3.tar.gz
- Amazon Web Service, Amazon EC2 Instances, Accessed Oct 12, 2013. http://aws.amazon.com/ec2/ instance-types/.
