Measuring Complexity, Development Time and Understandability of a Program: A Cognitive Approach

Автор: Amit Kumar Jakhar, Kumar Rajnish
Журнал: International Journal of Information Technology and Computer Science(IJITCS) @ijitcs
Статья в выпуске: 12 Vol. 6, 2014 года.
Бесплатный доступ
One of the central problems in software engineering is the inherent complexity. Since software is the result of human creative activity and cognitive informatics plays an important role in understanding its fundamental characteristics. This paper models one of the fundamental characteristics of software complexity by examining the cognitive weights of basic software control structures. Cognitive weights are the degree of the difficulty or relative time and effort required for comprehending a given piece of software, which satisfy the definition of complexity. Based on this approach a new concept of New Weighted Method Complexity (NWMC) of software is developed. Twenty programs are distributed among 5 PG students and development time is noted of all of them and mean is considered as the actual time needed time to develop the programs and Understandability (UA) is also measured of all the programs means how much time needed to understand the code. This paper considers Jingqiu Shao et al Cognitive Functional Size (CFS) of software for study. In order to validate the new complexity metrics we have calculated the correlation between proposed metric and CFS with respect to actual development time and performed analysis of NWMC with CFS with Mean Relative Error (MRE) and Standard Deviation (Std.). Finally, the authors found that the accuracy to estimate the development time with proposed measure is far better than CFS.
Program Complexity, Development Time, Understandability, Cognitive Weight, Basic Control Structures, Cognitive Functional Size, Lines of Code
Короткий адрес: https://sciup.org/15012206
IDR: 15012206
Текст научной статьи Measuring Complexity, Development Time and Understandability of a Program: A Cognitive Approach
Published Online November 2014 in MECS DOI: 10.5815/ijitcs.2014.12.07
With the growth in technology most of the businesses are now being controlled by software’s, making the cost, schedule and quality estimation are critical concerns of businesses. Thus, the development of software has also become increasingly sophisticated over the years. With the intension of finding the most appropriate attributes such as control flow [1], operator and operand count [2], information flow [3], data flow [4-5], identifier density [6], spatial complexity [7-8] and cognitive complexity [9-11] that measure the development and maintenance cost associated with developing software. Although, each of these proposed complexity metrics have their advantages and disadvantages, most of them are useful only in a limited environment. Thus, in addition to proposing new complexity metrics, some computer scientists and researchers have attempted to identify metrics that addresses most of the characteristics of a software programs. However, only a few studies have been conducted to test the relationship between the proposed complexity metrics and their applicability in the real world. To identify the effectiveness and the practicality of a metric a number of evaluation frameworks have been proposed in the past [12-15].
The complexity measures based on cognitive informatics is in development phase. Cognitive complexity measures represent the human effort needed to perform a task or difficulty in understanding the software code. In cognitive informatics, it is found that the functional complexity of software in design and comprehension is dependent on three fundamental factors: internal processing, input and output [16-17]. NWMC is the new measure for measuring software complexity presented in this paper. It is a measure of the cognitive and psychological complexity of software as a human intelligence artefact. Cognitive complexity takes into account both internal structures of software and I/Os it processes.
The main aim of this paper is to measure the cognitive complexity with NWMC, analyzing the development time of programs and the measure the understandability of a program. To accomplish this work, the authors compared the proposed cognitive complexity ( NWMC) and Cognitive Functional Size ( CFS ). The development time of NWMC and CFS is analyzed with actual development time and calculate their MRE and Standard Deviation. At last, understandability of a program is also measured, that can help to reduce difficulty which is tackled at the maintenance phase.
The rest of the paper is organized as follows: Section 2 deals with CFS presented by Shao et al., the basic control structure of a program and their corresponding weight is also shown in this section. Section 3 present a new complexity measure based on cognitive informatics and finding development time and Understandability of programs. The comparison of proposed measure with CFS and LOC has been done in Section 4. Section 5 deals with conclusion and the future works of this research paper.
-
II. Cfs of Shao and Wang
Over the years the term software complexity has been defined in several ways by a number of authors and researchers. The IEEE definition of software complexity is “the degree to which a system or component has a design or implementation that is difficult to understand and verify [18]”. Basili defined software complexity as “a measure of the resources expended by a system while interacting with a piece of software to perform a given task. If the interacting system is a computer, then complexity is defined by the execution time and storage required to perform the computation. If the interacting system is a programmer, then complexity is defined by the difficulty of performing tasks such as coding, debugging, testing or modifying the software [19].
The cognitive weight of software is defined “as the extent of difficulty or relative time and effort for comprehending given software modelled by a number of Basic Control Structures (BCS) [9].” A BCS is the basic building b loc k of any software regardless of the underline technology. According to C.A.R. Hoare et al., there are five types of BCSs: sequential, branch, iteration, recursion and parallel [20]. In 2002, Y. Wang proposed two more BCSs: function call and interr up t [17]. Each BCS has been al loc ated with a unique cognitive weight [9]. The cognitive weights for BCS are as under:
Table 1. Basic Control Structures and their weights
|
Category |
BCS |
Weight |
|
Sequence |
Sequence (SEQ) |
1 |
|
Branch |
If-Then-Else (ITE) |
2 |
|
Case |
3 |
|
|
Iteration |
For-do |
3 |
|
Repeat-until |
3 |
|
|
While-do |
3 |
|
|
Embedded |
Function Call (FC) |
2 |
|
Recursion (REC) |
3 |
|
|
Concurrency |
Parallel (PAR) |
4 |
|
Interr up t (INT) |
4 |
Calculation of cognitive weight of a b loc k changes depending on the existence of layers. If the BSCs are not nested and is in same layer, i.e., if there are no nested ‘if’ conditions, ‘for’ or ‘while’ loops, the cognitive weight is calculated by taking the sum of all the BSCs within that b loc k. However, in the case of existence of nesting, the cognitive weight is calculated by multiplying the cognitive weight of the inner BSCs with cognitive weight of outer BCSs. Hence, for a component with q linear b loc ks which consist of m layers of nesting BCSs with each layer having n linear BCSs, the total cognitive weight (Wc) is defined as [9]:
q mn
W = ППЕ W c ( j , k , i )] (1)
j =1 k =1 i =1
If the q b loc ks do not contain any embedded BCSs, then the above equation can be simplified as follows [9]:
qm
Wc = ЕЁ (j,k)
j =1 k =1
The CFS of software with N i inputs, N o outputs and a single method is defined as [9]:
Sf= Ni/o * Wc qmn
= N, + NoГ !H^ Wc (j•k • i)]
j =1 k =1 i =1
where, CWU is the unit of cognitive weight of software.
If the software consists of n c methods, then CFS of the cth method is defined as [9]:
n c
S f ( c ) = E S f ( c ) [CWU] (4)
c =1
Thus, for a component-based software system with p components, CFS is defined as [9]:
n p
/?, = Y Sf(p > p=1
n p n
= E £ Sf ( p , c ) (5)
p =1 c = 1 f
-
III. New Weighted Method Complexity (NWMC)
-
3.1 Definition
By considering the above theories of CFS presented by Shao et al [9], the authors had incorporated additional parameters in proposed cognitive weight measurement for measuring the complexity of program. In fact, cognitive weights correspond to the number of executed instructions and using this complexity number the authors make a relation to calculate the development time of the program, and compare the calculated time with the experimental developmental time which was observed when five users are trying to develop the code and mean of the five is consider as the actual development time. MRE is calculated for the both the proposed technique and CFS . Standard Deviation is also calculated of all 20 programs. At last, the understandability of a program is measured empirically with the help of NWMC that can be used to decrease the difficulty level and increase the quality, because UA is the quality indicator.
The NWMC metric may be defined as:
NWMC = N parameters * W c (6)
where,
N parameters = (N i + N o + N lp + N fp ) (7)
where,
N i : individual number of inputs of the main program and other program which is called from the main program and some other program.
N o : individual number of outputs of the main program and other program which is called from the main program and some other program.
N lp : number of loc al parameters other than N i used in a main program and other program which is called from the main program and some other program
N fp : number of formal parameters during function call and recursive call from the main program and other program which is called from the main program and some other program
W c : calculated from equation (1).
After calculating the complexity, the authors measure the development time which is observed from experiments with five different students in the institute lab. The time has taken by the students to develop the program was calculated and the average of all five students development time is considered as actual development time. The proposed work is incorporated with a new formula i.e.
Development Time = a + b * (Cognitive Complexity number) (8)
where the value of a and b are calculated with the help of regression. The same formula is also applied to calculate the development time with the help of CFS .
The value of a, b for NWMC are given below:
a=0.9793
b=0.0964
and the value of a, b for CFS are:
a=0.0004
b=0.7454
Development time is calculated with these constant putting into the Development Time formula for NWMC and CFS . Then compare the result with actual time refer Table 3, 4 and Fig. 5, 6, 7.
Understandability is a quality factor that is very important to understand the code before test and maintain. It finds the relationship between the NWMC and difficulty i.e. level of understandability. The authors proposed an empirical formula to calculate the Understandability (UA) of a program.
(UA) = (NWMC a) * b (9)
where a and b are constant that are derived empirically. a = 0.48
b = 0.62
By using the above formula the understandability can be measured through proposed approach. Ultimate goal of this formula is to increase the quality of software, i.e. higher the UA means more difficulty to test and maintain than smaller number. So, the developer has a chance to reduce it at the early phase of the software life cycle if they have some knowledge about this factor. More detail discussion is given in the next section.
-
3.2 Example for Illustration
A program to sort an array using selection sort is shown in Fig. 1. An algorithm contains 3 program bodies: one main program (P1), another program P2 (called from P1), and another program P3 (directly called from P2 and indirect call to P1). CFS and NWMC of Fig. 1 is calculated as follows:
Calculation of CFS
The cognitive weights for the three programs (P1, P2, and P3) are as follows:
It is seen from Fig. 1. For program P3, there are three internal structures: a sequential, iteration and a branch BCS. The cognitive weights for these three BCSs are determined as under:
BCS31.1 (sequence): W 1 = 1,
BCS31.2 (Iteration): W 2 = 3 * 2 = 6
Total cognitive weight for program P3 is: 1 + 6 = 7.
For program P2, there are two internal structures: iteration BCS and embedded component. The cognitive weight for Program P2 is determined as under:
BCS31 (iteration): W 1 = 3 + 7 = 10
For program P1, there are four internal structures: a sequence, two iterations and a function call BCS.
The cognitive weights and CFS for program P1 is calculated as under:
BCS1 (sequence): W 1 = 1,
BCS2 (iteration): W2 = 3,
BCS3 (function call): W3 = 2 +10 = 12,
BCS4 (iteration): W 4 = 3,
Total cognitive weight for program P1 is=
-
1 + 3 + 12 + 3 = 19.
CFS = (N i + N o ) * 19 = (2 + 1) * 19
= 3 * 19 = 57 [CWU]
The above result of CFS shows that when both the internal architectural complexity and I/O turnover are considered, this program’s complexity is equivalent to 57 CWU.
Calculation of NWMC
For Program P3, N lp = 3, N FP = 3,
Nparameters = 3 + 3 = 6
NWMC (P3) = 6 * W c = 6 * 7 = 42 [CWU]
For Program P2, N lp = 3, N FP = 2,
Nparameters = 3 + 2 = 5
NWMC (P2) = 5 * W c = 5 * 45 = 225 [CWU]
For Program P1, N i = 2, N o = 1, N lp = 4
N parameters = 7
NWMC (P1) = 7 * (1 + 3 + 227 + 3)
= 7 * 234 = 1872 [CWU]
The above result of NWMC shows that when both the internal architectural complexity and Nparameters turnover are considered, this program’s complexity is equivalent to 1872 CWU.
It is observed from above solved example that NWMC gives better prediction for the program’s complexity as compared to CFS . Because the CFS considered only input, output and BCS, but internal complexity is more than this. So, in proposed metric different internal parameters are considered. That’s why the value of both measures are different. Now the development time of this example is calculated by the constant a, b.
Development time of Fig. 1 with NWMC :
DT=0.9793 + (0.0964*1872) = 181 Minutes
Development time of Fig. 1 with CFS :
DT=0.0004 + (0.7454*57) = 42 Minutes
The development time of Fig. 1 with NWMC and CFS is shown above, it is clearly indicated that the difference is around 5 times greater than CFS . So to understand the problem, design, code, and test the program, the 42 minutes are very less for the beginners who do not have any knowledge about problem, but they have programming skills. So to develop the code like Fig. 1 takes three hours approximately. But the 42 minutes are very less to develop such complex code, since the NWMC predict the development time better than CFS .
The UA factor of Fig. 1 is calculated as follows:
UA = (1872 0.48) * 0.62 = 23 minutes
So, according to the observation 23 minutes has been required to understand the code.
Table 2. Analysis of theNWMC, CFS and LOC
|
Program No. |
CFS |
NWMC |
LOC |
|
1 |
33 |
44 |
15 |
|
2 |
24 |
24 |
16 |
|
3 |
8 |
28 |
23 |
|
4 |
18 |
88 |
24 |
|
5 |
75 |
200 |
31 |
|
6 |
65 |
169 |
33 |
|
7 |
50 |
200 |
34 |
|
8 |
32 |
120 |
35 |
|
9 |
57 |
413 |
36 |
|
10 |
76 |
190 |
37 |
|
11 |
34 |
205 |
40 |
|
12 |
40 |
140 |
44 |
|
13 |
66 |
420 |
46 |
|
14 |
280 |
520 |
60 |
|
15 |
44 |
728 |
60 |
|
16 |
136 |
708 |
61 |
|
17 |
369 |
697 |
65 |
|
18 |
174 |
5859 |
66 |
|
19 |
99 |
704 |
71 |
|
20 |
312 |
4664 |
159 |
// Program P1 (main Program)
#include
#include
void selection_sort(int arr[ ], int n);
void main()
{ int arr[10], i, n, j, k;
clrscr();
printf(“\n Enter the number of elements in the array”);
scanf(“%d”, &n); //BCS1
printf(“\n Enter the elements of the array”);
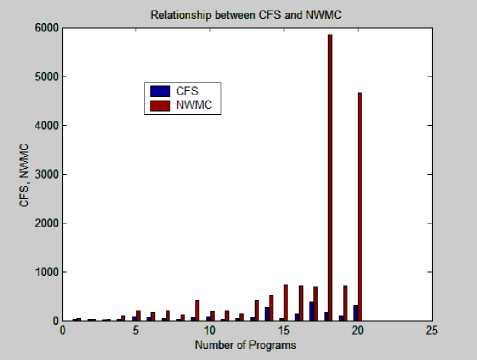
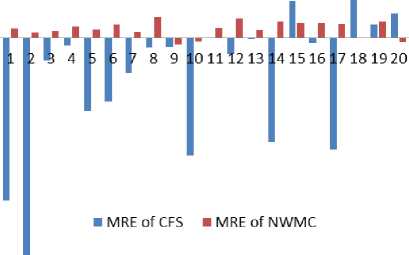
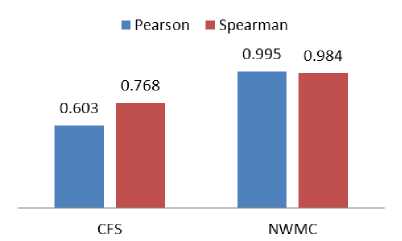
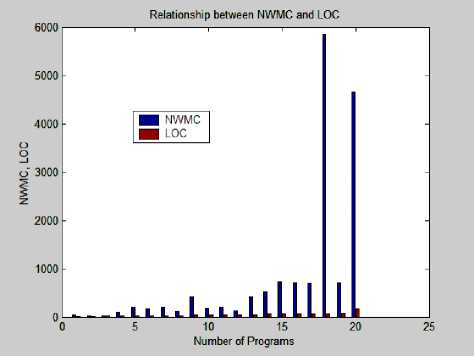
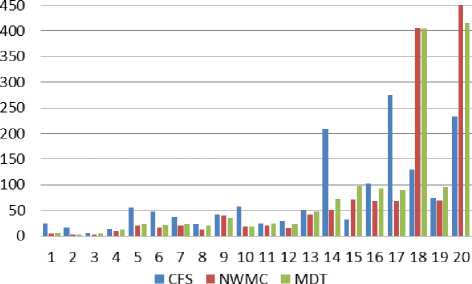
for(i=0; i { printf(“\n arr[%d]=”, i); scanf(“%d”, &arr[i]); } selection_sort(arr, n); //BCS3 printf(“Sorted Array is:\n”); for(i=0; i getch(); }======================================= // Program P3 (called from Program P2) int smallest(int arr[ ], int k, int n) { int pos = k, small = arr[k], i; //BCS31.1 for(i=k+1; i { if (arr[i] < small) { small = arr[i]; pos = i; } } return pos; }=================================== //Program P2 (called from P1) void selection_sort(int arr[ ], int n) { int k, pos, temp; for (k=0;k { pos = smallest (arr, k, n); temp = arr[k]; arr [k] = arr [pos]; arr [pos] = temp; }} Fig. 1. A Program to sort an array using selection sort Fig. 3. Analysis of CFS with LOC for 20 Programs Fig. 2 Analysis of NWMC and CFS for 20 Programs Mean Relative Error Table 3. Average development time of 20 programs in Minutes Program No. U 1 U 2 U 3 U 4 U 5 Avg. Time (Min) 1 7 9 6 5 4 6.2 2 4 5 4 3 2 3.6 3 5 6 3 4 3 4.2 4 14 16 9 12 8 11.8 5 25 28 22 21 23 23.8 6 23 25 22 19 23 22.4 7 25 26 22 19 21 22.6 8 22 24 19 18 17 20 9 42 44 32 33 30 36.2 10 19 25 17 14 15 18 11 28 31 25 20 21 25 12 26 28 22 21 18 23 13 61 56 43 41 38 47.8 14 80 92 64 66 58 72 15 124 136 84 79 63 97.2 16 119 122 88 77 58 92.8 17 108 112 76 75 80 90.2 18 448 489 386 342 358 404.6 19 117 126 85 82 72 96.4 20 480 435 423 380 358 415.2 80.0 40.0 0.0 -40.0 -80.0 120.0 -160.0 -200.0 -240.0 -280.0 320.0 -360.0 -400.0 Fig. 6. MRE of CFS and NWMC with Actual time Fig. 7. Correlation of CFS and NWMC with actual time Fig. 4. Analysis of NWMC with LOC for 20 Programs Table 4. Comparison of development time of CFS and NWMC with actual time Development time Fig. 5. A plot of actual and calculated development time S. No CFS NWMC AE UA MRE of CFS MRE of NWMC 1 25 5 6 3.8 -297 15.8 2 18 3 4 2.9 -397 8.5 3 6 4 4 3.1 -42 12.4 4 13 9 12 5.3 -13.7 19.8 5 56 20 24 7.9 -135 14.9 6 48 17 22 7.3 -116 22.9 7 37 20 23 7.9 -64.9 10.4 8 24 13 20 6.2 -19.3 37.3 9 42 41 36 11.2 -17.4 -12.7 10 57 19 18 7.7 -215 -7.2 11 25 21 25 8 -1.4 17 12 30 15 23 6.7 -29.6 35.4 13 49 41 48 11.3 -2.9 13.2 14 209 51 72 12.5 -190 29 15 33 71 97 14.7 66.3 26.8 16 101 69 93 14.4 -9.2 25.9 17 275 68 90 14.4 -205 24.4 18 130 407 405 39.9 67.9 -0.5 19 74 69 96 14.4 23.4 28.6 20 233 451 415 35.8 44 -8.5 Mean (abs) 74.25 70.7 76.65 --- 77.69 15.67 Std. Dev. 77.62 214.95 118.45 --- 125.74 24.23 IV. Comparative Study of NWMC and CFS This section presents the analysis of NWMC, CFS, lines of codes (LOC) of 20 programs and also focus on measuring the development time of 20 programs and correlates with actual development time and find the MRE and Standard Deviation of all programs. An attempt has also been made to calculate the UA of a program with the help of proposed measure by using an empirical formula. The actual development time is observed from five student of the institute and their mean is considered as actual time because the experience of five students is different with programming language. Each program is analysed in terms of unit known as lines of code (LOC), CFS and NWMC (with the unit of cognitive weight or CWU) as shown in Table 2 and illustrated in Fig. 2, Fig. 3 and Fig. 4. The LOC of software, or program length, can be used as a predictor of program characteristics such as effort and difficulty of maintenance. However, it characterizes only one specific aspect of size, namely the static length, because it takes no account of functionality. The CFS and NWMC is concerned with functional and cognitive complexity. Following observations made from Table 2, Table 3, Table 4, Fig. 2, Fig. 3 and Fig. 4, Fig. 5, Fig. 6, Fig. 7 which are as follows: ❖ From Fig. 2, it is observed that for each program NWMC gives better cognitive weight measurement for complexity value calculation than CFS. Because CFS has only takes input, output and weight of BCS in account, but the internal data elements are also part of complexity that are excluded by the CFS, but the proposed metric consider these factors. ❖ Certain interesting observation made from Table 2, Fig. 3 and Fig. 4. From Table 2 it is observed that, the trends for LOC, CFS and NWMC follow basically the same pattern. As the LOC increases, so does the corresponding CFS and NWMC. It is noteworthy that there are four points for which the CFS and NWMC grows-up sharply (see bold italic mentioned for CFS, NWMC and LOC in Table 2). This indicates that these four programs have higher code cognitive complexity, using fewer lines of code to implement more complex program. As indicated in Fig. 3 and Fig. 4, LOC is not a good measure for predicting program complexity. As mentioned in Table 2, there are two cases with similar LOC first case is around 60/61 LOC (painted with Gray) but one has CFS = 44 CWU below, NWMC =728 CWU above, while other is CFS= 136 CWU above, NWMC = 708 CWU below and in the second case is around 65/66 LOC (painted with Dark Yellow) but one has CFS = 369 CWU above, NWMC =697 CWU below, while other is CFS= 174 CWU below, NWMC = 5859 CWU above. Hence the proposed metric shows the accurate complexity of programs than others measures. ❖ Table 3 shows the development time of 20 programs with time taken by five different students of our institute. The development time of all five students is mostly different from others, this is due to their programming skills. Some students are very experienced and some are less experienced. The average time of all five students are calculated in the last column that is considered as the actual time in minutes that is required to develop the given program. The unit of the measuring developing time is in Minutes. ❖ The Table 4 describes the development time of 20 programs which is calculated with the help of NWMC and CFS and a comparison is also done with the actual time which is measured from 5 PG students. The development time of all 20 programs are calculated with the regression, the authors found the two constant a, b and the cognitive weight of individual. The value of a, and b are shown in the section 3.1 for both of measures. The MRE of both the techniques NWMC and CFS are calculated that is shown in the last two column of the Table 4. The MRE of the NWMC is very close to 0, means that the difference between the actual development time and the calculated time in very less, but MRE of CFS shown very large value in both the sides (in +ve side and –ve side) means the calculation is not much accurate. The result of this table shows that the development time is measured by the NWMC is very close to the actual development time than the CFS, this can be observed from mean of MRE (indicated in yellow colour) of both measures, CFS overestimate the development time that’s why the mean of MRE is greater than proposed measure. The standard deviation of both the measure is shown in the last row of the Table 4, CFS also does not do well with standard deviation the average standard deviation is 125.74 with the smallest error being 2.9. But the standard deviation of proposed measure has 24.23 with 0.5 smallest error (indicated in green colour) and the small value is desirable. So the proposed measure the development time better than CFS. UA is also calculated that is very important factor to test and maintain the software. The UA is helpful when the code is need to understand, because the maintaining the code is difficult than developing. Clock Time required to understand the code, but how much, this is question is solved by the understandability factor shown in Table 4. By using the Table 4 the Fig. 5 and Fig. 6 are generated. ❖ Fig. 7 represents the Pearson and Spearman's rho Correlation of NWMC and CFS with actual time of 20 Programs. (** Correlation is significant at the 0.01 level (2-tailed).). It can be seen that NWMC has a better correlation with actual time than CFS. These firmly believe that NWMC is better cognitive complexity metric that can be used in the real world. Therefore, the NWMC and cognitive weights provide an objective, logical, and comparative measure for quantitatively analyzing and predicting program complexity and development time and understandability of software in software engineering. V. Conclusion and Future Work A complexity measure based on cognitive weight and a formula to calculate the development time and understandability of programs is proposed. It is found that cognitive weight complexity measure is the most suitable measure, when it is compared with other similar measures. Software complexity measures serve both as an analyzer and a predictor in quantitative software engineering. This paper has developed the New Weighted Method Complexity (NWMC) on the basis of cognitive weights, permitting determination of program complexity from cognitive aspects. Cognitive weights for basic control structures (BCSs) have been introduced to measure the complexity of logical structures of program. A large set of case studies has been carried out to analyze the relationship between NWMC with CFS and LOC of a program. The NWMC has been shown to be a fundamental measure of program complexity based on the cognitive weight. The development time of a program is calculated with the help of cognitive complexity that is measured by NWMC and CFS. The result shows that the proposed technique has better capability to measure the complexity and development time of a program than the CFS. This work has produced four substantial findings: (a) The NWMC of software in design and comprehension is dependent on five factors: internal processing structures, as well as the number of inputs, number of local parameters, number of formal parameters used during call and number of outputs. (b) The NWMC is more robust than the CFS and LOC measure and independent of language/implementation. (c) The development time help to better estimate the cost and the deadline required for releasing the software and ensuring that the risk has been reduced. (d) Understandability factor help to maintain and test the software, and can also be used at early stage of the software life cycle to reduce the complexity that increase the Understandability ratio. The future work includes on some fundamental issues: (1) Programs used for the study were very small as compared to large system. The same work will be carried out with large system along with some other cognitive measures to see the effect on program complexity. (2) The proposed measure needs further verification with some software engineering measurement (as for example, Weyuker Properties, Briand’s Property) for analyzing the nature of the metric. (3) Furthermore, the time required to find and fix the bugs can be observed with the help of UA factor.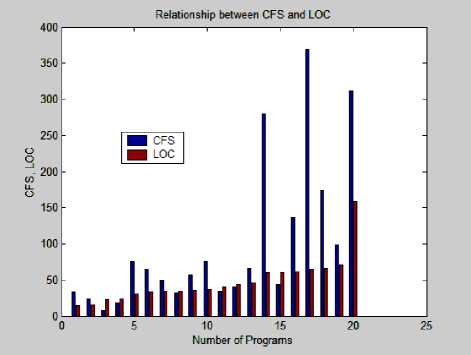
Список литературы Measuring Complexity, Development Time and Understandability of a Program: A Cognitive Approach
- T.J. McCabe, “A complexity measure”, IEEE Transactions on Software Engineering, Vol. 2, No.4, December 1976, pp.308-320.
- M.H. Halstead, “Elements of Software Science”, Elsevier North- Holland, New York, 1997.
- S. Henry, and D. Kafura, “Software structure metrics based on information flow”, IEEE Transaction on Software Engineering, SE-7, Sept. 1981, pp.510-518.
- E. I. Oviedo, “Control flow, data flow and program complexity”, Proc. COMPSAC, Chicago, 1980, pp. 146-152.
- K.C. Tai, “A program complexity metric based on data flow information in control graphs”, Proceedings of the 7th international conference on software engineering (ICSE 84), NJ, USA, 1984, ISBN: 0-8186-0528-6.
- W. Harrison, “An Entropy-based Measure of Software Complexity”, IEEE Transactions on Software Engineering, Vol. 18, No. 11, 1992, pp. 1025-1029.
- J.K. Chhabra and V. GUPta, “Evaluation of Object-Oriented Spatial Complexity Measures”, ACM SIGSOFT Software Engineering Notes, Vol. 34, No. 3, May 2009, pp. 1-5.
- C. R. Douce, P. J. Layzell, and J. Buckley, “Spatial measures of software complexity”, Proc. 11th Annual Workshop of Psychology of Programming Interest GroUP, University of Leeds, UK, Jan. 1999, pp. 36-45.
- J. Shao and Y. Wang, “A new measure of software complexity based on cognitive weights”, Canadian Journal of Electrical and Computer Engineering, Vol.28, No.2, April 2003, pp. 1-6.
- D.S. Kushwaha and A.K. Misra, “A modified cognitive information complexity measure of software”, ACM SIGSOFT Software Engineering Notes, Vol. 31, No.1, January 2006, pp.1-4.
- S. Misra, “Complexity measure based on cognitive weights”, International Journal of Theoretical and Applied Computer Sciences,Vol.1, No. 1, 2006, pp.1-10.
- Briand, L.C., S. Morasca, and V.R. Basili, “Property based Software Engineering Measurement,” IEEE Transactions on Software Engineering, vol. 22, 1996, pp. 68-86.
- Lakshmanian, K.B., S. Jayaprakash, P.K. Sinha, “Properties of Control-Flow Complexity Measures,” IEEE Transaction on Software Engineering, vol. 17, 1991, pp. 1289-1295.
- Tian, J., and M.V. Zelkowitz, “A Formal Program Complexity Model and its Application,” J. Systems Software, vol. 17, 1992, pp. 253-266.
- E. J. Weyuker, “Evaluating Software Complexity Measure.” IEEE Transaction on Software Engineering, vol. 14, 1988, pp. 1357-1365.
- Y. Wang, “On cognitive informatics: Keynote lecture,” in Proc. 1st IEEE Int. Conf. Cognitive Informatics (ICCI’02), Calgary, Alta., Aug. 2002, pp. 34–42.
- Y. Wang, “Component-based software measurement,” chap. 14 in Business Compo-nent-Based Software Engineering, ed. F. Barbier, Boston: Kluwer Academic Publish-ers, 2002, pp. 247–262.
- E. Da-wei, “The software complexity model and metrics for object-oriented”, School of Computer Engineering, Jimei University, Xiamen, China, April 2007, pp. 464-469.
- J. K. Kearney, “Software complexity measurement”, Communications of the ACM, Vol. 29, No. 11, November 1986, pp. 1044-1050.
- C.A.R. Hoare, “Laws of programming”, Communications of the ACM, Vol. 30, No. 8, Aug. 1987, pp. 672–686.
