Measuring the information security maturity of enterprises under uncertainty using fuzzy AHP

Author: Adel A. Nasser, Abdualmajed A. Al-Khulaidi, Mijahed N. Aljober
Journal: International Journal of Information Technology and Computer Science @ijitcs
Article in issue: 4 Vol. 10, 2018.
Free access
Generally, measuring the Information Security maturity(ISM) is the first step to build a new knowledge information security management system in an organization. Knowing the ISM level helps organizations decide the type of protection strategies and policies will be taken and their priorities to strengthen their competitive ability. One of the possible ways to solve the problem is a using multiple criteria decision-making (MCDM) methodology. Analytic hierarchy process (AHP) is one of the most commonly used MCDM methods, which combines subjective and personal preferences in the information security assessment process. However, the AHP involves human subjectivity, which introduces vagueness type of uncertainty and requires the use of decision-making under those uncertainties. In this paper, the IS maturity is based on hierarchical multilevel information security gap analysis model for ISO 27001:2013 security standard. The concept of fuzzy set is applied to Analytic Hierarchical Process (AHP) to propose a model for measuring organizations IS maturity under uncertain environment. Using fuzzy AHP approach helps determine more efficiently importance weights of factors and indicators, especially deal with imprecise and uncertain expert comparison judgments. A case study is used to illustrate the better new method for IS evaluation.
Gap Analysis, Fuzzy Logic, ISO 27001:2013, Maturity level, Fuzzy Analytical Hierarchy process, IS assessment, Maturity model
Short address: https://sciup.org/15016250
IDR: 15016250 | DOI: 10.5815/ijitcs.2018.04.02
Text of the scientific article Measuring the information security maturity of enterprises under uncertainty using fuzzy AHP
Published Online April 2018 in MECS
The Information is becoming one of the most important assets in the 21st century for almost every organization to manage effectively to get their competitive advantage, information technology and systems are a heart of their business. Organizations are increasingly reliant on information and information technology and systems to support their core activities and business operations, and services. Yet Organizations worldwide face Increasing security threats that can undermine the operations of this technology and systems.
Considering today's threats, most enterprises wonder what kind of protection strategies is suitable for them and how to apply effective policies, and procedures in order to ensure or guarantee business continuity, minimize business risk and maximize or accelerate return on investment and business opportunities. Only Knowing their current state of actual information security operations, the organization could decide this question.
To measure the Information Security Maturity, we have to know the importance weights of each factor, subfactor and their indicators. Therefore, An Analytic Network Process is one of the methods, that has been widely used in dealing with various kinds of complex MCDM, and can assist in identifying and weighing criteria, analyzing the data collected and expediting the decision-making process. In addition, in the MCDM processes of IS evolution, have an uncertainty on judgments of decision makers, the human thinking style should be reflected. However the traditional AHP cannot deal with this doubt situation, thus, the Fuzzy AHP approach is presented to make up for that inadequacy in determination this weights[1,2]. The AHP is accepted to be a powerful and flexible method for ranking and evaluation of decision information security factors[3-5], as a basic step for information security evaluation processes.
The main goal of this paper is to quantify the effect of multiple factors in the information security assessment process. Aiming at archiving this goal, the fuzzy analytic hierarchy process (FAHP) is applied. Using this method as an example, the hierarchical multilevel information security gap analysis model is established, and then the maturity index and the maturity level comprehensively assessed. Also, the weights of various factors are defined to find the most influential factors on the total information security level. The rest of paper is organized as follows, Section I contains Introduction, Section II contains the review of previous related work in various resent security analysis standards, maturity models, hierarchical multilevel gap analysis models and measurement for information security maturity, Section III describes concept of Analytic Hierarchy Process(AHP), Section IV describes concept of Fuzzy AHP as a methodology of research, Section V describes the proposed model for measuring information security maturity index, contains results, discussion, and recommendation to improving the information security management in the uncertain organizations using FAHP, Section VI contains conclusions of research work. The last section contains the references.
-
II. Related Works
-
A. Information Security Assessment: Standards and Models
Information security systems are of great importance for business organizations as they become the main key to planning and management in modern enterprises to endure the safety, availability, and confidentiality of information[6,7]. The internal and external security threats made the international organizations seek to adopt specific security policy standards that draw up an integrated policy to put the concept of information security into practice at institutions, from analysis of risks to the application of security controls to minimize these risks[8,9].
Assessment of information security risks applicable to any organization depends heavily on the nature of its business and its technical structure. Therefore, identifying information security risks and areas of related policy that apply to any organization requires an understanding of the practical and technical aspects of these institutions, and the categorization of policies is done depending on a set of their own controls such as access control and continuity of work and compliance with international standards.
IS Maturity of an organization is the state of an organization when it achieves the full development state in using information security operations controls in order to ensure or guarantee business continuity, minimize business risk and maximize or accelerate return on investment and business opportunities. It is a part of the system of information security management, It is the first step in the management of information security risks to identify vulnerabilities in the information security systems at the enterprise, it helps determine the type of protection strategies and policies to be taken and their priorities, and it must be based on an appropriate international standard[8,9]. In order to determine the current maturity state of IS in an organization, it is required to carry out measuring the IS maturity of that organization using international ISM legal, regulatory, and internal requirements relevant to the organization, In this case, it is a reference to the standards and laws related to information security
Many of the best practices for information security management have been developed. Most important of these are Developed several best practices for information security management, the most important of which is the ISO 7799 standard, the updated version of the ISO 27000 standard, Control Objectives for Information and Related Technologies (COBIT), Information Technology Infrastructure Library (ITIL), national guidelines for information security such as (NIST 800-53), etc. Studies [10-13] have shown that the application of these standards and guidelines is constantly increasing worldwide for the sake of improving the level of information security in the institutions and, in particular, to meet the requirements imposed on these institutions by legal and auditing institutions, national or international. It revolves around the need to follow a set of security compliance regulations during the implementation of the structure of information security management in the organizations business [14].
ISO/IEC 27001 is the international standard for information security management which defines a set of controls and requirements to establish, implement, operate, monitor, review, maintain and improve an information security management system (ISMS). ISO/IEC 27001-2005 has been prepared to reemphasize the code of practice of ISO 17799 with few Amendments and additions of controls that will enhance and improve the ISMS further [14,15]. The ISO/IEC 27001:2013 Standard is the second edition of the standard and replaces the first edition ISO/IEC 27001:2005 Standard.
The idea of information security standards that have models with measurable effects on the business becomes more present in practice and more respected by experts [16]. Maturity models defined as a structured collection of elements that describe the characteristics of effective processes or products [17], It also defines the order in which security elements must be implemented, encourages the use of standards of best practices and provides a means to compare security programs[12], used regularly in the field of Information Systems as an approach for organizational assessment [12,18] as a benchmark comparison tool to evaluate the ability of organizations to meet the objectives of security [19]. Any systematic framework for carrying out benchmarking and performance enhancement that has continuous improvement processes can be considered a Maturity Model [12]. in the constituent literature, a maturity model used to describe, explain and evaluate growth life cycles, can be used for assessing and/or achieving compliance since they allow the measurement of a maturity level and, by identifying the gap between the current and pursued level, helps to understand the effects that are expected from the organization [16], allows the planning of efforts, priorities and objectives in order to achieve the goals proposed, and identifies project or organizational strengths, weaknesses and benchmarking information [20]. Thus, Maturity implies perfect or explicitly defined, managed, measured, and controlled systems. In general, maturity models have the following properties [21]:
-
• The development of a single entity is simplified and described with a limited number of maturity levels (usually four to six);
-
• Levels are characterized by certain requirements, which the entity has to achieve on that level;
-
• Levels are ordered sequentially, from an initial level up to an ending level (the latter is the level of perfection).
There are common maturity models available and these are NIST, GISM, ISM3, CITI-ISEM, COBiT, OISM3, SSE/CM, and CERT/CSO. The COBIT maturity model is widely used for IT governance, and for the purpose of this study, it was decided to use the COBiT model, because it is focused toward auditing specific procedural awareness and adaptation [12] and presents a set of indicators, which are more focused on the controls of activities than in their execution. These controls assist in optimizing the IT investment, provided measures to ensure servicing and administering standards of measurement to assess when there is an error in its use , help management full its IT governance responsibilities[12] and allows the organization to measure its current maturity level against a specific standard[22], in this case, ISO27001.
Nasser, in his paper[8], concluded that the assessment of the security situation is part of the system of information security management. It is the first step in the management of information security risks to identify vulnerabilities in the information security systems at the enterprise, it helps determine the type of protection strategies and policies to be taken and their priorities, and it must be based on an appropriate international standard, Farther more, in his work author described in detailed the following:
-
• The Importance of the information security assessment ;
-
• The Gap analysis concepts as a tool to compare actual performance of organization's with the standards;
-
• The key characteristic and the reasons behind the selecting of the of ISO27001standard;
-
• The role and benefits of using a maturity model in the information security assessment processes;
-
• The main reasons behind the selecting of the COBiT model to measure the current maturity level in the YAGS against an ISO 27001 standard.
Also, Authors in [11,12] suggested the COBiT maturity 6-stage roadmap of IS develop to determine the level of IS maturity. the list of agreed COBiT maturity values, their descriptions and maturity levels assessment criteria represented in the tables 1 and 2 [11,12]. This model has its measurement basis supported by the maturity scale of COBiT. [11].
Table 1. Maturity Values And Their Description
|
Maturity value-level |
Description |
|
0 – Non Existent |
There is no recognition of the need for internal control. |
|
1– Initial / Adhoc |
There is some recognition of the need for internal control. |
|
2 – RepeaTable But Intuitive |
Controls are in place but are not documented. |
|
3 – Defined Process |
Controls are in place and are adequately documented. |
|
4 – Managed and Measurable |
There are an effective internal control and risk management environment |
|
5 - Optimized |
An organization-wide risk and control program provides continuous and effective control and risk mitigation. |
Table 2...Maturity Level Assessment Criteria
|
Maturity Index |
Maturity Level |
|
0 – 0.50 |
0 – Non Existent |
|
0.51 -1.50 |
1 – Initial / Adhoc |
|
1.51 – 2.50 |
2 – RepeaTable But Intuitive |
|
2.51 – 3.50 |
3 – Defined Process |
|
3.51 – 4.50 |
4 – Managed and Measurable |
|
4.51-5.00 |
5 - Optimized |
B. Hierarchical Multileve IS Gap Analysis Models
A common challenge for many organizations has been to operationalize the ISMS requirements and decide in which processes they should embed measurement controls in order to ensure that deviations in relation to the ISMS processes are detected and addressed as part of the on-going improvement.
Alison Anderson and Dennis Langley developed a security management system [23] based on the security studies of different organizations and proposed three groups for monitoring the internal security policy implementation: Information system, Information system assets, and Information system environment. According to [12], the ISO27001 security domains do not provide insight into which group in the organization is responsible for an activity. And management, technical and operational model (MTO) was introduced by them, This approach is based on ISO 17799:2005 for evaluating and continuously improving ISMS. In this model, the ISO 27001:2005 controls were grouped into three categories management, technical and operational controls.
In 2006, STOPE Model (Strategy, Technology, Organization, People, and Environment) was introduced by [24]. This approach is based on “six sigma” by using ISO 17799:2005 for evaluating and continuously improving ISMS. In 2017, Another framework assessment was introduced by [25], this framework is based on SANS Critical controls and/or ISO27032 ) as guidance for the scoring of the maturity levels, with a mapping to ISO 27001:2005, COBiT 4.1 and COBiT 5.0. For evaluating and continuously improving ISMS, the ISO 27001:2005 controls in this framework, was grouped into six responsibility categories: (Strategy and Policies, Organization, People, Processes, technology and facilities controls).
In 2017, hierarchical multilevel information security gap analysis models were introduced by [9]. This approach is based on “integrating MTO, Responsibility, role-based, and organizational structure models ” by using ISO 27001:2013 for evaluating and continuously improving ISMS. The benefits of this categorizations are fully described by the [9], the main of them, an organization can identify which part of their organization needs more attention regarding relevant threats, vulnerabilities provides a common language for all to view and manage information security activities. His research aimed to improve the information security practices at the Yemeni Academy for Graduate Studies by classification of security controls using a multilevel hierarchical model and assessing the information security level in each dimension of this models, assessed the extent of their compliance in them. It, also, attempted to measure the gap between the actual level of information security practices at the academy and the level it seeks to achieve in compliance by using proposed models with the requirements of ISO / IEC: 27001.
Following is one of the hierarchical multilevel models to measure IS maturity of an enterprise proposed by Nasser[9].
Table 3 illustrates the following relationships: the ISO/IEC 27001: 2013, domain requirements and security controls. Security controls have 14 security control clauses, 35 Control Objectives and Controls have 114. Each security clause (A5-A18) covers one or more objective, each of them has a number of security controls. Each clause addressed to one of organizational information security architecture framework classes: (Compliance, Organization / Infrastructure, Security Baselines/ Risk Assessments, User Awareness and Training and Policies, Standard, and Procedures), TUDOR (2006)”:
Table 3. Hierarchical Multilevel Gap Analysis Model
|
Level 1 |
Level 2 |
Level 3 |
Level 4 |
Indicators |
Indicators |
|
Management |
PSP |
A5 |
A5.1 |
2 |
A5.1.1, A5.1.2 |
|
O |
A6 |
A6.1 |
5 |
A6.1.1, …, A6.1.5 |
|
|
A6.2 |
2 |
A6.2.1, A6.2.2 |
|||
|
AT |
A15 |
A15.1 |
3 |
A15.1.1, …, A15.1.3 |
|
|
A15.2 |
2 |
A15.2.1, A15.2.2 |
|||
|
C |
A18 |
A18.1 |
5 |
A18.1.1, …, A18.1.5 |
|
|
A18.2 |
3 |
A18.2.1, …, A18.2.3 |
|||
|
Technical |
PSP |
A8 |
A8.1 |
4 |
A8.1.1, …, A8.1.4 |
|
A8.2 |
3 |
A8.2.1, …, A8.2.3 |
|||
|
A8.3 |
3 |
A8.3.1, …, A8.3.3 |
|||
|
SR |
A11 |
A11.1 |
6 |
A11.1.1, …, A11.1.3 |
|
|
A11.2 |
9 |
A11.2.1, A11.2.2 |
|||
|
A12 |
A12.1 |
4 |
A12.1.1, …, A12.1.4 |
||
|
A12.2 |
1 |
A12.2.1 |
|||
|
A12.3 |
1 |
A12.2.1 |
|||
|
A12.4 |
4 |
A12.4.1, …, A12.4.4 |
|||
|
A12.5 |
1 |
A12.2.1 |
|||
|
A12.6 |
2 |
A12.6.1, A12.6.2 |
|||
|
A12.7 |
1 |
A12.7.1 |
|||
|
A13 |
A13.1 |
3 |
A13.1.1, …, A12.1.3 |
||
|
A13.2 |
4 |
A13.2.1, …, A13.2.4 |
|||
|
Operational |
AT |
A7 |
A7.1 |
2 |
A7.1.1, A7.1.2 |
|
A7.2 |
3 |
A7.2.1, …, A7.2.3 |
|||
|
A7.3 |
1 |
A7.3.1, …, A7.3.3 |
|||
|
PSP |
A9 |
A9.1 |
2 |
A9.1.1, A9.1.2 |
|
|
A9.2 |
6 |
A9.2.1, …, A9.2.6 |
|||
|
A9.3 |
1 |
A9.3.1 |
|||
|
A9.4 |
5 |
A9.4.1,…, A9.4.5 |
|||
|
A10 |
A10.1 |
2 |
A10.1.1, A10.1.2 |
||
|
SR |
A14 |
A14.1 |
3 |
A14.1.1, A14.1.3 |
|
|
A14.2 |
9 |
A14.2.1, …, A14.2.9 |
|||
|
A14.3 |
1 |
A14.3.1 |
|||
|
A16 |
A16.1 |
7 |
A16.1.1, A16.1.7 |
||
|
A17 |
A17.1 |
3 |
A17.1.1, A17.1.3 |
||
|
A17.2 |
1 |
A17.2.1 |
-
• Compliance Controls (C): Compliance
-
• Organization / Infrastructure Controls (O):
Organization of information security)
-
• Security Baselines/ Risk Assessments
Controls(SR):
-
• (Physical and environment security/ Operations management/ communications management/
-
• Information systems acquisition & development &maintenance/ Information security incident management/ Information security aspects of BCM),
-
• User Awareness and Training Controls (AT): (Human resource security/ Supplier relationships),
-
• Policies, Standard, and Procedures Controls (PSP): (Information security policy/ Access Control/ Asset management/ Cryptography).
Also, each of listed domains or classes is directly addressed to one of MTO domains (management, technical and operational):
-
• Management clauses: Information security policies; Organization of information security; Supplier relationships and Compliance.
-
• Technical controls: Asset management; Physical and environmental security; Operations security and Communications security.
-
• Operational controls: Human resource security; Access control; Cryptography; System acquisition, development, and maintenance; Information security incident management and Information security aspects of business continuity management.
The Information security assessment proses in studied works are comprised of three main elements: A security control matrix, a set of security performance metrics and a measurement model. For example, Nasser [9], in his work describes these elements as follows: The security control matrix is a compilation of security controls from security best practices, regulations, standards (such as ISO 27001:2013).
The controls are categorized into groups, classes or domains as proposed in [9]. The evaluation used as a benchmark what we call perfect security. Perfect security is defined as the desired level of security for the entity under evaluation, in this case, is a level 5. Once the security goals are defined, the stakeholders can select and prioritize from the security controls listed in the hierarchical model that they believe is needed to comply with the desired level of security. After determining the desired level of security (the security controls that are going to be evaluated), the stakeholders are required to select the security performance metrics. The measurement model receives as inputs the desired level of security (benchmark), the results of the security evaluation and the values of the SPM. Then, it determines the gap based on the level of compliance and considers priorities for the information criteria and controls to deliver different levels of security for each information criteria under technical, operational and organizational perspectives. the last element is the measurement model. It takes into consideration the priorities for each aspect of security, namely, confidentiality, integrity, availability (i.e. information criteria) and security controls to deliver levels of security from different perspectives: MTO (Management, Technical and Operational), responsibility and role perspectives and for each information criteria.
-
C. Measurement of IS Maturity
The method described above and most of the other methods for the assessment of information security do not deal with the subjectivity aspect of information security assessments based on people’s perceptions, and they also do not describe measures of the consistency among evaluators and the authors did not mention group of decision-makers as well as uncertainty in their judgments. To deal with these issues, this research uses the Fuzzy AHP approach to develop a method for information security assessment. The method is based on hierarchical multilevel information security gap analysis model and on leading security performance indicators, defined according to the ISO 27001:2013 security standard.
FAHP method includes the important procedures of the determination of weights of various information security gap analysis factors, the qualitative analysis, and the establishment of the comprehensive calculation model.
This paper will use the measurement proposed by Nasser [8,9].Also, This paper will use one of Hierarchical multilevel information security gap analysis model proposed by Nasser [9] as a hierarchy multilevel information security gap analysis model. see table 4. The columns (level1- level4) illustrates the hierarchical multilevel factors, while the column "Maturity Index for each security indicator (controls)" combines indicators (controls) with development maturity index "stages".
The IS maturity index (ISMl) will be calculated by following formula[1]:
ISMI = ∑ n W ( Ci ). ISMI ( Ci ), ∑ n W ( Ci ). = 1, (1) i = 1 i = 1
In their papers, authors etc. [8-13] did not mention a group of decision-makers as well as uncertainty in their judgments. Nasser let the weights of controls as:
W(C1) = W(C2) =…= W(Cn) = 1/n.
This paper will use the measures proposed above to identify the maturity index with more attention to determine the relative importance weights of decision criteria in each level of the hierarchy using pair-wise comparisons and with mention group of decision-makers as well as uncertainty in our judgments. This paper will use the fuzzy AHP approach to determine more appropriate coefficients in an uncertain environment to get a better IS maturity index.
Table 4. The MI For All ISO 27001 Indicators
|
L 1 |
L 2 |
L 3 |
L 4 |
Maturity Index for each I security indicator ( controls) |
||||||||
|
1 |
2 |
3 |
4 |
5 |
6 |
7 |
8 |
9 |
||||
|
Management |
PSP |
A5 |
1(2) |
0 |
0 |
|||||||
|
O |
A6 |
1(5) |
2 |
2 |
0 |
1 |
0 |
|||||
|
2(2) |
2 |
1 |
||||||||||
|
AT |
A15 |
1(3) |
0 |
2 |
3 |
|||||||
|
2(2) |
5 |
2 |
||||||||||
|
C |
A18 |
1(5) |
2 |
1 |
4 |
3 |
1 |
|||||
|
2(3) |
2 |
0 |
1 |
|||||||||
|
Technical |
PSP |
A8 |
1(4) |
2 |
2 |
2 |
3 |
|||||
|
2(3) |
2 |
1 |
1 |
|||||||||
|
3(3) |
2 |
2 |
2 |
|||||||||
|
SR |
A11 |
1(6) |
3 |
4 |
4 |
2 |
4 |
4 |
||||
|
2(9) |
4 |
4 |
3 |
4 |
4 |
2 |
2 |
3 |
3 |
|||
|
A12 |
1(4) |
2 |
2 |
1 |
1 |
|||||||
|
2(1) |
2 |
|||||||||||
|
3(1) |
5 |
|||||||||||
|
4(4) |
5 |
5 |
5 |
0 |
||||||||
|
5(1) |
4 |
|||||||||||
|
6(2) |
2 |
2 |
||||||||||
|
7(1) |
1 |
|||||||||||
|
A13 |
1(3) |
2 |
2 |
2 |
||||||||
|
2(4) |
0 |
2 |
1 |
1 |
||||||||
|
Operational |
AT |
A7 |
1(2) |
1 |
3 |
|||||||
|
2(3) |
2 |
1 |
3 |
|||||||||
|
3(1) |
2 |
|||||||||||
|
PSP |
A9 |
1(2) |
1 |
4 |
||||||||
|
2(6) |
5 |
4 |
4 |
2 |
2 |
4 |
||||||
|
3(1) |
5 |
|||||||||||
|
4(5) |
2 |
2 |
2 |
0 |
2 |
|||||||
|
A10 |
1(2) |
0 |
1 |
|||||||||
|
SR |
A14 |
1(3) |
2 |
3 |
1 |
|||||||
|
2(9) |
0 |
1 |
2 |
1 |
2 |
3 |
1 |
1 |
1 |
|||
|
3(1) |
3 |
|||||||||||
|
A16 |
1(7) |
0 |
1 |
2 |
2 |
1 |
1 |
1 |
||||
|
A17 |
1(3) |
2 |
2 |
3 |
||||||||
|
2(1) |
3 |
|||||||||||
-
III. Concept of Analytic Hierarchy Process
Analytic Hierarchy Process (AHP) [26, 27] was first proposed in the 1970s by T. L. Saaty, an American expert in the field of operational analysis, AHP is a traditional powerful decision-making methodology in order to determine the priorities among different criteria, comparing alternatives for each criterion, and determining an overall ranking of the alternatives. The basic procedure to carry out the AHP consists of the following steps:
Step 1: Decomposing the decision problem into a hierarchy. The top level of the hierarchy represents the overall goal of the decision problem, the second level represents the criteria and sub-criteria affecting the decision[28].
Step 2: Calculating the relative importance weights of decision criteria in each level of the hierarchy using pairwise comparisons. In this step, the decision maker uses the fundamental scale or weight between 1 (equal importance) and 9 (extreme importance) defined by Saaty [29] to assess the priority score for each pair of criteria in the same level. That is, the pair-wise comparison matrix is constructed in which the elements in an inside the matrix can be interpreted as the degree of the precedence of the ith criterion over the jth criterion. Then, the average weight for each normalized criterion is computed[28].
Step 3: Evaluating the IS taking into account the weights of decision criteria.
The AHP provides a consistency rate (CR) to measure the consistency of judgment of the decision maker that will be presented in the section of fuzzy AHP.
-
IV. Fuzzy Ahp
The conventional AHP is inadequate for dealing with the imprecise or vague nature of linguistic assessment. In fuzzy AHP, common sense linguistic statements have been used in the pair-wise comparison which can be represented by the triangular fuzzy numbers [28,30]. Afterwards, the step of aggregating the pair-wise comparison and the synthesis of the priorities to determine the overall priorities of the IS factors, subfactors and Indicators will be done. The concept of FAHP described by [28] as follows:
-
A. Triangular Fuzzy Numbers (TFNs)
The TFNs used in the pair-wise comparison are defined by three real numbers expressed as a triple (l, m, u) where 1 - m - u . for describing a fuzzy event. From a number of TFNs that have been proposed in the literature, the one that seems to correspond better to the preferences scale of the AHP is summarized in table 5.
Table 5. Triangular Fuzzy Conversion Scale
|
Fuzzy number |
Linguistic |
Scale of fuzzy number |
|
9 |
Perfect |
(8, 9,10) |
|
8 |
Absolute |
(7, 8,9) |
|
7 |
Very good |
(6, 7,8) |
|
6 |
Fairly good |
(5, 6,7) |
|
5 |
Good |
(4, 5,6) |
|
4 |
Preferable |
(3, 4,5) |
|
3 |
Not bad |
(2, 3,4) |
|
2 |
Weak advantage |
(1, 2,3) |
|
1 |
Equal |
(1, 1,1) |
B. Construct the Fuzzy Pair-Wise Comparison Matrix
To Construct pairwise comparison fuzzy judgment matrix A = {a j } of n criteria or alternatives via pair-wise comparison, the TFNs are used as follows.
1 a12 "" a 1 n a 21 1 • •• a 2 n
_ an 1 an 2 - 1
where aij is a fuzzy triangular number, ay = (iij, mj, ujj ) and a ...■ = 1 / a^,. For each TFN, a^ or M = (i;, mh■, u,7) , ji iji ij ij ij ij
It is a membership function ^ a ( x ) or ц т ( x ) is a continuous mapping from real number ^ - X - ^ to the closed interval [0, 1] and can be defined by (2).
( x - l ) / ( m - l ), l - x - m
^~A ( X ) = < ( u - x ) / ( u - m ), m - x - u
0, otherwise
From (2), l and u mean the lower and upper bounds of the fuzzy number A ~ and m is the modal value for A ~ . The TFN can be denoted by A ~( l , m , u ) .
The operations on TFNs can be addition, multiplication, and inverse. Consider two triangular fuzzy numbers are displayed as A1 = (i1, m1, u1) and A = (i2, m2, u 2) , then the basic equations:
~~ addition : A1 © A2 = (l 1 +12, U 1 + U2, m1 + m2 )
multiplication : Av ® A = (lvl2, U,U2, mm )
inverse: A 1 = (1, —,1)(5)
uml
-
C. Aggregate the Group Decisions
After collecting the fuzzy judgment matrices from all decision makers, these matrices can be aggregated by using the fuzzy geometric mean method of Buckley [31,32]. The aggregated TFN of n decision makers’ judgment in a certain case ~ у = ( i j , m j , u jj ) is
n uj= (П ajk )1/n i=1
where a ~ ijk is the relative importance in form of TFN of the kth decision maker’s view, and n is the total number of decision-makers
-
D. Compute the Value of Fuzzy Synthetic Extent
Based on the aggregated pair-wise comparison matrix, U = ~ j , the value of fuzzy synthetic extent S with respect to the ith criterion can be computed as (7) by making use of the algebraic operations on TFNs as described in (3)–(5).
mnm
Si=Yuj® ££u„ j=1 L i=1 j=1
Where
nm
l i = 1 j = 1
m mmm
Zuj=|Zij, Zmj, Zuj j=1 V j=1 j=1
mmm
= | Z i i , Z m; , Z u i I
V j=1 j=1 j=1
and
-
E. Approximate the Fuzzy Priorities
Based on the fuzzy synthetic extent values, the non-fuzzy values that represent the relative preference or weight of one criterion over others are needed. Therefore, this paper firstly uses Chang’s method [29] to find the degree of possibility that S b - Sa as follows:
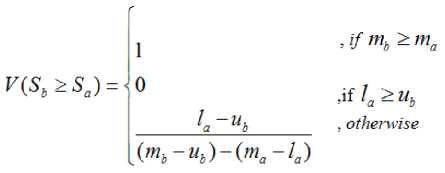
where d is the ordinate of the highest intersection between µ and µ . That is, it can be expressed that V ( S b ≥ S a ) = hight ( S a ∩ S b ) = µ s ( d ).
It is noted that both values of V ( S ≥ S ) and V ( Sa ≥ Sb ) are required. The degree of possibility for a TFN Si to be greater than the number of n TFN Sk can be given by the use of operation min proposed by Dubois and Prade[26].
V ( S 1 ≥ S 2 , S 3 ,...., S n ) = min V ( S 1 ≥ S k ), = w '( S i ) (9)
where k= 1, 2, …, n and k ≠ i, and n is the number of criteria described previously. Each w '( Si ) value represents the relative preference or weight, a non-fuzzy number, of one criterion over others. However, these weights have to be normalized in order to allow it to be analogous to weights defined from the AHP method. Then, the normalized weight w ( S ) will be formed in terms of a weight vector as follows:
W = ( w ( S 1 ), w ( S 2 ), w ( S 3 ),...., w ( S n )) τ (10)
-
F. Consistency Test of the Comparison Matrix
To assure a certain quality level of a decision, we have to analyze the consistency of an evaluation. In order to test the value of consistency of the comparison matrix depended on n, the consistency rate (CR) has to be computed. The CR is defined in (11) as a ration between the consistency of a consistency index (CI) and the consistency of a random consistency index (RI). Its value should not exceed 0.1 for a matrix larger than 4x4. For pair-wise comparison matrix being compatible, upperbound of CR should be like what is shown in Table 6 [26, 27].
CR = CI / RI (11)
Table 6. Upper Bound For Pair-Wise Comparison Matrix To Be Compatible
|
N |
3x3 |
4x4 |
n>4 |
|
CR ≤ |
0.58 |
0.90 |
1.12 |
The CI is used to measure the inconsistency pair-wise comparison as shown in () where the eigenvalue λ Can be computed by averaging all eigenvalues of the pair-wise comparison matrix (12). Table 7 shows values of RI in different values of n.
CR=(λmax-n)/(n-1)(12)
mW
λmax = aij j =n, i,j=1,2,...,n(13)
W j =1
Table 7. Values Of Random Consistency Index (Ri) Per Different Number Of Criteria
|
n |
RI |
n |
RI |
n |
RI |
|
3 |
0.58 |
7 |
1.32 |
11 |
1.51 |
|
4 |
0.90 |
8 |
1.41 |
12 |
1.48 |
|
5 |
1.12 |
9 |
1.45 |
13 |
1.56 |
|
6 |
1.24 |
10 |
1.49 |
14 |
1.59 |
-
V. The Proposed Model for Measuring Ismi
The fuzzy AHP method is applied in this model to measure enterprises IS maturity. The process of measurement includes following steps:
Step 1: Define measuring factors and linguistic variables.
Firstly, define measuring factors. As presented above, the measurement of IST maturity consists of 4 levels with 3 main factors. The factors, their sub-factors and sub factor's indicators can be seen in table 1.
Then, define the appropriate linguistic variables for the importance weight of factors and indicators. This paper suggests linguistic terms that can be expressed in positive triangular fuzzy numbers. See Table 5.
Step 2: Determine the weight vector of factors, Subfactors, and indicators. Firstly, collect judgments in term of a linguistic variable from a group of experts then create pairwise comparison matrices. Calculate consistency index (CI) and consistency ratio (CR) to determine the consistency level from each expert. Aggregate the pairwise comparison matrices of experts by using the fuzzy geometric mean method of Buckley (6) to take the average values to obtain the combined comparison matrix for the whole group of experts. The local weight vector of factors is determined by using formulas (7) to (9). Then it is normalized by using formula (10). Next, develop the dependent matrix of factors and sub-factors from inner dependent matrices with respect to each factor. The interdependent weight is derived from local weight vector and a dependent matrix of a factor. The importance weights of indicators can be calculated in the same method above.
Step 3: Calculate the ISMI.
Use formula (1) to calculate the ISMI.
-
VI. Illustrative Example (Case Study)
The following example demonstrates the applying proposed method to calculate the ISMI. A group of 4 experts had convened to measure the ISMI of an enterprise. They used a questionnaire based on indicators (Table 8) to collect data. To measure ISMI, they must have importance weights of main factors, their subfactors, and indicators.
Table 8. Tool for collecting data
|
Factor/Sub -factor 1 |
Factor/Sub-factor 2 |
.. |
Factor/Sub -factor n |
|
|
Factor/ Sub-factor 1 |
1 |
|||
|
Factor/ Sub-factor 2 |
1 |
|||
|
. . |
||||
|
Factor/ Sub-factor n |
1 |
Table 9 shows an example of the pairwise comparison matrix of management sub-factors made from 4 experts judgments using linguistic terms in Table 5.
Firstly, it is necessary to test the consistency of each expert judgment. We have 4 different experts. The consistency test results for presented example are as shown in table 10:
The consistency of each expert judgment <0.1, and all of 4 experts judgments successfully pass the consistency test. After collecting the fuzzy judgment matrices from all decision makers, these matrices aggregated by using the fuzzy geometric mean method of Buckley using formula (6). The integration comparison matrix (with geometric mean)of selected example can be seen in table 11.
Table 9. Pairwise comparison matrix of management sub-factor
|
Ex |
PSP |
O |
AT |
C |
|
|
PSP |
1 |
1 |
1/3 |
1/2 |
1/2 |
|
2 |
1 |
1/3 |
1 |
1/3 |
|
|
3 |
1 |
1/4 |
1/3 |
1/5 |
|
|
4 |
1 |
1/2 |
1/2 |
1/3 |
|
|
O |
1 |
3 |
1 |
2 |
1 |
|
2 |
3 |
1 |
2 |
1 |
|
|
3 |
4 |
1 |
2 |
1 |
|
|
4 |
2 |
1 |
2 |
1/2 |
|
|
AT |
1 |
2 |
1/2 |
1 |
1/2 |
|
2 |
1 |
1/2 |
1 |
1/2 |
|
|
3 |
3 |
1/2 |
1 |
1/2 |
|
|
4 |
2 |
1/2 |
1 |
1/2 |
|
|
C |
1 |
4 |
1 |
2 |
1 |
|
2 |
3 |
1 |
2 |
1 |
|
|
3 |
5 |
1 |
2 |
1 |
|
|
4 |
3 |
2 |
2 |
1 |
Table 10. The consistency test
|
Expert |
CI |
CR |
|
1 |
0.0034 |
0.0038 |
|
2 |
0.0068 |
0.0076 |
|
3 |
0.0051 |
0.0057 |
|
4 |
0.0236 |
0.0262 |
Table 11. Integrated Fuzzy Comparison Matrices
|
PSP |
O |
AT |
C |
|||||||||
|
PSP |
1 |
1 |
1 |
0.25 |
0.343 |
0.537 |
0.759 |
1.0 |
1.3 |
0.24 |
0.32 |
0.5 |
|
O |
1.86 |
2.91 |
3.936 |
1 |
1 |
1 |
1.000 |
2.0 |
3.0 |
0.75 |
0.84 |
1.0 |
|
AT |
0.79 |
1.00 |
1.316 |
0.33 |
0.500 |
1.000 |
1 |
1 |
1 |
0.33 |
0.50 |
1.0 |
|
C |
2.00 |
3.08 |
4.119 |
1.00 |
1.189 |
1.316 |
1.000 |
2.00 |
3.0 |
1 |
1 |
1 |
Then apply formula (7) to calculate the fuzzy synthetic extent values and use formula (8) to calculate the degree of possibility that S b > S a . The synthetic extent values and the degree of possibility can be seen in the next table 12 for selected example.
Then, use (9), (10) to calculate the local weight vector of factors, subfactors, and indicators. Via normalization, we obtain the local weight vector of them. Therefore, the weight vector and normalized weight vector of provided example sub-factors are:
W’ = (0.154,0.943,0.336,1) T ,
W = (0.0632,0.3876,0.1381,0.4111/
Similarly, Applying the same way, we also can calculate the local weights vectors and normalized weights vector of all other sub-factors and indicators. The normalized weight vectors of the Information security assessment sub-factors and indicators In the ISMI evaluation process are obtained as shown in tables 13 and 14.
Table 12. The synthetic extent values and the degree of possibility
|
Example 2( S b > S a ) |
|||||
|
.S b |
Synth. extent values |
.S a |
|||
|
~ S PSP |
~ SO |
~ S AT |
S ~ C |
||
|
~ S PSP |
0.0867, 0.1355, 0.2344 |
0.215 |
0.893 |
0.154 |
|
|
~ SO |
0.1775, 0.343, 0.6247 |
1.000 |
1.000 |
0.943 |
|
|
~ S AT |
0.0932, 0.1524, 0.3017 |
1.000 |
0.395 |
0.336 |
|
|
~ SC |
0.192, 0.3692, 0.6596 |
1.000 |
1.000 |
1.000 |
|
As a result, tables 14 and 15 show the importance local, global and overall weights of ISM Infrastructure factors, sub-factors, and its indicators. The global weights are calculated by multiplying the local weight of the criteria or sub-criteria with the importance weight of the related parent perspective
After the weights of the IS factors, sub-factors and their indicators in the ISM assessment process, the comprehensive maturity assessment can be carried out, and the overall maturity index and the overall maturity level can be obtained through calculation. The ISM assessment is done by formula (1) and the overall maturity index and the maturity level can be seen in tables 16 and 17.
The results obtained from the measurement of the level of Maturity for information security is level 2 (repeatable but intuitive). Results of the questionnaire management to obtain an average value for all of the indicators is 1.94 range of 0 to 5. And the value of the gap between current security conditions and the condition of the expected(5) is 3.06. From this value can be concluded that the security information on the second level, is repetitive but intuitive. The comprehensive IS assessment result is helpful for the decision maker to understand wholly the information security features of the process being analyzed. Because of the outstanding feature proposed evolution method, it can be taken as the basis for the effectiveness analysis of the information security improving measures. Through the comparison of the maturity level before and after taking improving measures, the effectiveness of the improvement measures can be measured by the amount of the information security maturity level changes.
Table 13. The local weights of is indicators
|
L 4 |
Local weight |
||||||||
|
1 |
2 |
3 |
4 |
5 |
6 |
7 |
8 |
9 |
|
|
A5.1 |
0.444 |
0.556 |
|||||||
|
A6.1 |
0.1211 |
0.1637 |
0.203 |
0.2393 |
0.273 |
||||
|
A6.2 |
0.524 |
0.476 |
|||||||
|
A15.1 |
0.266 |
0.425 |
0.309 |
||||||
|
A15.2 |
0.424 |
0.576 |
|||||||
|
A18.1 |
0.1223 |
0.154 |
0.2028 |
0.2449 |
0.276 |
||||
|
A18.2 |
0.3814 |
0.3725 |
0.2461 |
||||||
|
A8.1 |
0.2256 |
0.3282 |
0.247 |
0.1992 |
|||||
|
A8.2 |
0.379 |
0.263 |
0.358 |
||||||
|
A8.3 |
0.425 |
0.309 |
0.266 |
||||||
|
A11.1 |
0.1006 |
0.1292 |
0.1559 |
0.1837 |
0.2043 |
0.2263 |
|||
|
A11.2 |
0.0677 |
0.078 |
0.088 |
0.057 |
0.1013 |
0.1073 |
0.1166 |
0.1854 |
0.1987 |
|
A12.1 |
0.247 |
0.1992 |
0.2256 |
0.3282 |
|||||
|
A12.2 |
1 |
||||||||
|
A12.3 |
1 |
||||||||
|
A12.4 |
0.2201 |
0.2201 |
0.2201 |
0.3398 |
|||||
|
A12.5 |
1 |
||||||||
|
A12.6 |
0.535 |
0.465 |
|||||||
|
A12.7 |
1 |
||||||||
|
A13.1 |
0.2463 |
0.3724 |
0.3813 |
||||||
|
A13.2 |
0.2528 |
0.2289 |
0.1908 |
0.3275 |
|||||
|
A7.1 |
0.522 |
0.478 |
|||||||
|
A7.2 |
0.425 |
0.266 |
0.309 |
||||||
|
A7.3 |
1 |
||||||||
|
A9.1 |
0.523 |
0.477 |
|||||||
|
A9.2 |
0.1004 |
0.1366 |
0.1415 |
0.1893 |
0.2009 |
0.2313 |
|||
|
A9.3 |
1 |
||||||||
|
A9.4 |
0.1223 |
0.154 |
0.2028 |
0.2449 |
0.276 |
||||
|
A10.1 |
0.424 |
0.576 |
|||||||
|
A14.1 |
0.246 |
0.373 |
0.381 |
||||||
|
A14.2 |
0.057 |
0.0677 |
0.078 |
0.1987 |
0.1013 |
0.1166 |
0.1073 |
0.1854 |
0.088 |
|
A14.3 |
1 |
||||||||
|
A16.1 |
0.0863 |
0.107 |
0.1265 |
0.1448 |
0.1623 |
0.1787 |
0.1944 |
||
|
A17.1 |
0.372 |
0.246 |
0.382 |
||||||
|
A17.2 |
1 |
||||||||
Table 14. The local and global weights of is factors and sub-factors
|
Level 1 |
Local weight |
Level 2 |
Local weight |
Global weight |
Level 3 |
Local weight |
Global weight |
Level 4 |
Local weight |
Global weight |
|
Management |
0.382 |
PSP |
0.0632 |
0.024 |
A5 |
1 |
0.0241 |
A5.1 |
1.0000 |
0.02414 |
|
O |
0.3876 |
0.148 |
A6 |
1 |
0.1481 |
A6.1 |
0.2900 |
0.04294 |
||
|
A6.2 |
0.7100 |
0.10512 |
||||||||
|
AT |
0.1381 |
0.053 |
A15 |
1 |
0.0528 |
A15.1 |
0.4780 |
0.02522 |
||
|
A15.2 |
0.5220 |
0.02754 |
||||||||
|
C |
0.4111 |
0.157 |
A18 |
1 |
0.1570 |
A18.1 |
0.2800 |
0.04397 |
||
|
A18.2 |
0.7200 |
0.11307 |
||||||||
|
Technical |
0.39 |
PSP |
0.156 |
0.061 |
A8 |
1 |
0.0608 |
A8.1 |
0.4250 |
0.02586 |
|
A8.2 |
0.2660 |
0.01618 |
||||||||
|
A8.3 |
0.3090 |
0.01880 |
||||||||
|
0.844 |
0.329 |
A11 |
0.372 |
0.1224 |
A11.1 |
0.4770 |
0.05841 |
|||
|
A11.2 |
0.5230 |
0.06404 |
||||||||
|
A12 |
0.382 |
0.1257 |
A12.1 |
0.2060 |
0.02590 |
|||||
|
A12.2 |
0.0602 |
0.00757 |
||||||||
|
A12.3 |
0.0805 |
0.01012 |
||||||||
|
SR |
A12.4 |
0.2241 |
0.02818 |
|||||||
|
A12.5 |
0.1910 |
0.02402 |
||||||||
|
A12.6 |
0.0932 |
0.01172 |
||||||||
|
A12.7 |
0.1450 |
0.01823 |
||||||||
|
A13 |
0.246 |
0.0810 |
A13.1 |
0.4780 |
0.03871 |
|||||
|
A13.2 |
0.5220 |
0.04227 |
||||||||
|
Operational |
0.228 |
AT |
0.174 |
0.040 |
A7 |
1 |
0.0397 |
A7.1 |
0.3580 |
0.01420 |
|
A7.2 |
0.3790 |
0.01504 |
||||||||
|
A7.3 |
0.2630 |
0.01043 |
||||||||
|
0.328 |
0.075 |
A9 |
0.923 |
0.0690 |
A9.1 |
0.0425 |
0.00293 |
|||
|
A9.2 |
0.4984 |
0.03440 |
||||||||
|
PSP |
A9.3 |
0.0462 |
0.00319 |
|||||||
|
A9.4 |
0.4129 |
0.02850 |
||||||||
|
A10 |
0.077 |
0.0058 |
A10.1 |
1.0000 |
0.00576 |
|||||
|
0.498 |
0.114 |
A14 |
0.56 |
0.0636 |
A14.1 |
0.1900 |
0.01208 |
|||
|
SR |
A14.2 |
0.6500 |
0.04133 |
|||||||
|
A14.3 |
0.1600 |
0.01017 |
||||||||
|
A16 |
0.272 |
0.0309 |
A16.1 |
1.0000 |
0.03088 |
|||||
|
A17 |
0.168 |
0.0191 |
A17.1 |
0.5760 |
0.01099 |
|||||
|
A17.2 |
0.4240 |
0.00809 |
Table 15. The overall weights of is indicators
|
L 4 |
Indicator (Overall weight ) |
||||||||
|
1 |
2 |
3 |
4 |
5 |
6 |
7 |
8 |
9 |
|
|
A5.1 |
0.0107 |
0.0134 |
|||||||
|
A6.1 |
0.0052 |
0.0070 |
0.0087 |
0.0103 |
0.0117 |
||||
|
A6.2 |
0.0551 |
0.0500 |
|||||||
|
A15.1 |
0.0067 |
0.0107 |
0.0078 |
||||||
|
A15.2 |
0.0117 |
0.0159 |
|||||||
|
A18.1 |
0.0054 |
0.0068 |
0.0089 |
0.0108 |
0.0121 |
||||
|
A18.2 |
0.0431 |
0.0421 |
0.0278 |
||||||
|
A8.1 |
0.0058 |
0.0085 |
0.0064 |
0.0052 |
|||||
|
A8.2 |
0.0061 |
0.0043 |
0.0058 |
||||||
|
A8.3 |
0.0080 |
0.0058 |
0.0050 |
||||||
|
A11.1 |
0.0059 |
0.0075 |
0.0091 |
0.0107 |
0.0119 |
0.0132 |
|||
|
A11.2 |
0.0043 |
0.0050 |
0.0056 |
0.0037 |
0.0065 |
0.0069 |
0.0075 |
0.0119 |
0.0127 |
|
A12.1 |
0.0064 |
0.0052 |
0.0058 |
0.0085 |
|||||
|
A12.2 |
0.0076 |
||||||||
|
A12.3 |
0.0101 |
||||||||
|
A12.4 |
0.0062 |
0.0062 |
0.0062 |
0.0096 |
|||||
|
A12.5 |
0.0240 |
||||||||
|
A12.6 |
0.0063 |
0.0054 |
|||||||
|
A12.7 |
0.0182 |
||||||||
|
A13.1 |
0.0095 |
0.0144 |
0.0148 |
||||||
|
A13.2 |
0.0107 |
0.0097 |
0.0081 |
0.0138 |
|||||
|
A7.1 |
0.0074 |
0.0068 |
|||||||
|
A7.2 |
0.0064 |
0.0040 |
0.0046 |
||||||
|
A7.3 |
0.0104 |
||||||||
|
A9.1 |
0.0015 |
0.0014 |
|||||||
|
A9.2 |
0.0035 |
0.0047 |
0.0049 |
0.0065 |
0.0069 |
0.0080 |
|||
|
A9.3 |
0.0032 |
||||||||
|
A9.4 |
0.0035 |
0.0044 |
0.0058 |
0.0070 |
0.0079 |
||||
|
A10.1 |
0.0024 |
0.0033 |
|||||||
|
A14.1 |
0.0030 |
0.0045 |
0.0046 |
||||||
|
A14.2 |
0.0024 |
0.0028 |
0.0032 |
0.0036 |
0.0042 |
0.0044 |
0.0048 |
0.0077 |
0.0082 |
|
A14.3 |
0.0102 |
||||||||
|
A16.1 |
0.0027 |
0.0033 |
0.0039 |
0.0045 |
0.0050 |
0.0055 |
0.0060 |
||
|
A17.1 |
0.0041 |
0.0027 |
0.0042 |
||||||
|
A17.2 |
0.0081 |
||||||||
Table 16. The overall ismi for all indicators
|
L 4 |
) |
||||||||
|
1 |
2 |
3 |
4 |
5 |
6 |
7 |
8 |
9 |
|
|
A5.1 |
0 |
0 |
|||||||
|
A6.1 |
0.0104 |
0.0141 |
0 |
0.0103 |
0 |
||||
|
A6.2 |
0.1102 |
0.0500 |
|||||||
|
A15.1 |
0 |
0.0214 |
0.0234 |
||||||
|
A15.2 |
0.0584 |
0.0317 |
|||||||
|
A18.1 |
0.0108 |
0.0068 |
0.0357 |
0.0323 |
0.0121 |
||||
|
A18.2 |
0.0862 |
0 |
0.0278 |
||||||
|
A8.1 |
0.0117 |
0.0170 |
0.0128 |
0.0155 |
|||||
|
A8.2 |
0.0123 |
0.0043 |
0.0058 |
||||||
|
A8.3 |
0.0160 |
0.0116 |
0.0100 |
||||||
|
A11.1 |
0.0176 |
0.0302 |
0.0364 |
0.0215 |
0.0477 |
0.0529 |
|||
|
A11.2 |
0.0173 |
0.0200 |
0.0169 |
0.0146 |
0.0259 |
0.0137 |
0.0149 |
0.0356 |
0.0382 |
|
A12.1 |
0.0128 |
0.0103 |
0.0058 |
0.0085 |
|||||
|
A12.2 |
0.0151 |
||||||||
|
A12.3 |
0.0506 |
||||||||
|
A12.4 |
0.0310 |
0.0310 |
0.0310 |
0 |
|||||
|
A12.5 |
0.0961 |
||||||||
|
A12.6 |
0.0125 |
0.0109 |
|||||||
|
A12.7 |
0.0182 |
||||||||
|
A13.1 |
0.0191 |
0.0288 |
0.0295 |
||||||
|
A13.2 |
0 |
0.0194 |
0.0081 |
0.0138 |
|||||
|
A7.1 |
0.0074 |
0.0204 |
|||||||
|
A7.2 |
0.0128 |
0.0040 |
0.0139 |
||||||
|
A7.3 |
0.0209 |
||||||||
|
A9.1 |
0.0015 |
0.0056 |
|||||||
|
A9.2 |
0.0173 |
0.0188 |
0.0195 |
0.0130 |
0.0138 |
0.0318 |
|||
|
A9.3 |
0.0159 |
||||||||
|
A9.4 |
0.0070 |
0.0088 |
0.0116 |
0 |
0.0157 |
||||
|
A10.1 |
0 |
0.0033 |
|||||||
|
A14.1 |
0.0059 |
0.0135 |
0.0046 |
||||||
|
A14.2 |
0 |
0.0028 |
0.0064 |
0.0036 |
0.0084 |
0.0133 |
0.0048 |
0.0077 |
0.0082 |
|
A14.3 |
0.0305 |
||||||||
|
A16.1 |
0 |
0.0033 |
0.0078 |
0.0089 |
0.0050 |
0.0055 |
0.0060 |
||
|
A17.1 |
0.0082 |
0.0054 |
0.0126 |
||||||
|
A17.2 |
0.0243 |
||||||||
Table 17. The overall ismi and isml for all is infrastructure
|
Level 4 |
MI |
MI |
ML |
Level 3 |
MI |
MI |
ML |
Level 2 |
MI |
MI |
ML |
Level 1 |
MI |
MI |
ML |
Level 0 |
Overall MI |
Overall MI |
Overall ML |
|
A5.1 |
0.0000 |
0.00 |
0 |
A5 |
0.0000 |
0.00 |
0 |
PSP |
0.0000 |
0.00 |
0 |
s ё Co № В |
0.5416 |
1.42 |
1 |
IS |
1.9744 |
1.94 |
2 |
|
A6.1 |
0.0347 |
0.81 |
1 |
A6 |
0.1949 |
1.32 |
1 |
O |
0.1949 |
1.32 |
1 |
||||||||
|
A6.2 |
0.1602 |
1.52 |
2 |
||||||||||||||||
|
A15.1 |
0.0448 |
1.78 |
2 |
A15 |
0.1349 |
2.56 |
3 |
AT |
0.1349 |
2.56 |
3 |
||||||||
|
A15.2 |
0.0901 |
3.27 |
3 |
||||||||||||||||
|
A18.1 |
0.0976 |
2.22 |
2 |
A18 |
0.2117 |
1.35 |
1 |
C |
0.2117 |
1.35 |
1 |
||||||||
|
A18.2 |
0.1141 |
1.01 |
1 |
||||||||||||||||
|
A8.1 |
0.0569 |
2.20 |
2 |
A8 |
0.1168 |
1.92 |
2 |
PSP |
0.1168 |
1.92 |
2 |
1 |
0.9730 |
2.49 |
2 |
||||
|
A8.2 |
0.0223 |
1.38 |
1 |
||||||||||||||||
|
A8.3 |
0.0376 |
2.00 |
2 |
||||||||||||||||
|
A11.1 |
0.2063 |
3.53 |
4 |
A11 |
0.4035 |
3.30 |
3 |
SR |
0.8562 |
2.60 |
3 |
||||||||
|
A11.2 |
0.1972 |
3.08 |
3 |
||||||||||||||||
|
A12.1 |
0.0375 |
1.45 |
1 |
A12 |
0.3340 |
2.66 |
3 |
||||||||||||
|
A12.2 |
0.0151 |
2.00 |
2 |
||||||||||||||||
|
A12.3 |
0.0506 |
5.00 |
5 |
||||||||||||||||
|
A12.4 |
0.0930 |
3.30 |
3 |
||||||||||||||||
|
A12.5 |
0.0961 |
4.00 |
4 |
||||||||||||||||
|
A12.6 |
0.0234 |
2.00 |
2 |
||||||||||||||||
|
A12.7 |
0.0182 |
1.00 |
1 |
||||||||||||||||
|
A13.1 |
0.0774 |
2.00 |
2 |
A13 |
0.1187 |
1.47 |
1 |
||||||||||||
|
A13.2 |
0.0413 |
0.98 |
1 |
||||||||||||||||
|
A7.1 |
0.0278 |
1.96 |
2 |
A7 |
0.0794 |
2.00 |
2 |
AT |
0.0794 |
2.00 |
2 |
о ■о со о' |
0.4599 |
2.02 |
2 |
||||
|
A7.2 |
0.0307 |
2.04 |
2 |
||||||||||||||||
|
A7.3 |
0.0209 |
2.00 |
2 |
||||||||||||||||
|
A9.1 |
0.0071 |
2.43 |
2 |
A9 |
0.1803 |
2.61 |
3 |
PSP |
0.1837 |
2.46 |
2 |
||||||||
|
A9.2 |
0.1142 |
3.32 |
3 |
||||||||||||||||
|
A9.3 |
0.0159 |
5.00 |
5 |
||||||||||||||||
|
A9.4 |
0.0430 |
1.51 |
2 |
||||||||||||||||
|
A10.1 |
0.0033 |
0.58 |
1 |
A10 |
0.0033 |
0.58 |
1 |
||||||||||||
|
A14.1 |
0.0241 |
1.99 |
2 |
A14 |
0.1098 |
1.73 |
2 |
S |
0.1969 |
1.73 |
2 |
||||||||
|
A14.2 |
0.0553 |
1.34 |
1 |
||||||||||||||||
|
A14.3 |
0.0305 |
3.00 |
3 |
||||||||||||||||
|
A16.1 |
0.0366 |
1.19 |
1 |
A16 |
0.0366 |
1.19 |
1 |
||||||||||||
|
A17.1 |
0.0262 |
2.38 |
2 |
A17 |
0.0504 |
2.64 |
3 |
||||||||||||
|
A17.2 |
0.0243 |
3.00 |
3 |
-
VII. Conclusion
References Measuring the information security maturity of enterprises under uncertainty using fuzzy AHP
- Renuka Nagpal, Deepti Mehrotra, Pradeep Kumar Bhatia and Arun Sharma, "Rank University Websites Using Fuzzy AHP and Fuzzy TOPSIS: Approach on Usability", International Journal of Information Engineering and Electronic Business, Vol.7, No.1, pp.29-36, 2015.
- Essaid EL HAJI , Abdellah Azmani, and Mohamed El Harzli, "Using AHP Method for Educational and Vocational Guidance", International Journal of Information Technology and Computer Science, Vol.9, No.1, pp.9-17, 2017
- Rodney Alexander, "Using the Analytical Hierarchy Process Model in the Prioritization of Information Assurance Defense-In-Depth Measures?—A Quantitative Study,"Journal of Information Security, 2017, 8, 166-173
- Kanyarat Phudphad, Bunthit Watanapa, Worarat Krathu and Suree Funilkul,"Rankings of the security factors of human resources information system (HRIS) influencing the open climate of work: using analytic hierarchy process (AHP)," 8th International Conference on Advances in Information Technology, IAIT2016, 19-22 December 2016, Macau, China
- Juhyeon Lee, Youngin You, Kyungho Lee,"A study on the priority decision making of IT goals in COBIT 5 goals cascade", in pros.. of the 9th international conference of information management and engineering, ICIME 2017, 221-225, October 2017, Barcelona, Spain.
- Zhengbing Hu, Vadym Mukhin, Yaroslav Kornaga,Yaroslav Lavrenko, Oleg Barabash, OksanaHerasymenko, "Analytical Assessment of Security Level of Distributed and Scalable Computer Systems", International Journal of Intelligent Systems and Applications (IJISA), Vol.8, No.12, pp.57-64, 2016.
- Zhengbing Hu, Yulia Khokhlachova, Viktoriia Sydorenko and Ivan Opirskyy,"Method for Optimization of Information Security Systems Behavior under Conditions of Influences, "International Journal of Intelligent Systems and Applications, Vol.9, No.12, pp.46-58, 2017.
- A. A. Nasser, “Information security gap analysis based on ISO 27001: 2013 standard: A case study of the Yemeni Academy for Graduate Studies, Sana'a, Yemen, ” International Journal of scientific research in Multidisciplinary Studies, Vol. 3, Issues 11, pp. 5 – 14, DEC. 2017
- A. A. Nasser, “Hierarchical Multilevel Information security gap analysis models based on ISO 27001: 2013, ” International Journal of scientific research in Multidisciplinary Studies, Vol. 3, Issues 11, pp. 15 – 24, DEC. 2017
- A. Itrada , S. Sultan , M. Al-Junaidi , R. Qaffaf , F. Mashal, and F. Daas, “Developing an ISO27001 Information Security Management System for an Educational Institute: Hashemite University as a case study, ” Jordan Journal of Mechanical and Industrial Engineering, Vol. 8, no. 2, pp.102 – 118, April. 2014
- C Candiwan, "Analysis of ISO27001 Implementation for Enterprises and SMEs in Indonesia". In: Proceedings of the International Conference on Cyber-Crime Investigation and Cyber Security (ICCICS2014), pp. 50-58, Nov.2014, Kuala Lumpur, Malaysia.
- I Al-Mayahi and S. P. Mansoor, " ISO 27001 gap analysis – case study ". In: Proceedings of the International Conference on Security and Management (SAM ’12), Las Vegas, 2012.
- B. Karabacak and I. A Sogukainar, “quantitative method for iso 17799 gap analysis, ” Computers and Security Journal, Elsevier, vol. 25(6), pp. 413–419, 2006
- M. Dey, " Information security management - a practical approach, " In Proceedings of AFRICAN 2007, Member, IEEE
- ISO/IEC 17799:2000, Information technology – Security techniques – Code of practice for information security management, Geneva, Switzerland: International Organization for Standardization, 2000
- B. Stevanović, “Maturity Models in Information Security, ” International Journal of Information and Communication Technology Research, vol.1,no.2,2011
- Project Management Institute (PMI), “Organizational project management maturity model knowledge foundation(OPM3)”, Newtown Square, Pennsylvania USA,.2003
- T. Mettler and P. Rohner," Situational Maturity Models as Instrumental Artifacts for Organizational Design, " In Proceedings of the 4th International Conference on Design Science Research in Information Systems and Technology, Bew York, 2009.
- M. F. Saleh," Information Security Maturity Model," International Journal of Computer Science and Security (IJCSS), Vol.5, Issue 3, pp: 316-337
- K. Judev, J. Thomas, "Project management maturity models: The milver bullets of competitive advantage?" Project Management Journal, vol. 33, 2002.
- G. Klimko, "Knowledge management and maturity models: Building common understanding," In Proc. of the 2nd European Conference on Knowledge Management, 2001.
- S. E. Chang and C. S. Lin, "Exploring organizational culture for information security management," Industrial Management & Data Systems, vol.107, issue 3, pp. 438 – 458, 2007
- A. Anderson, D. Longley and L.F. "Kwok, Security modeling for organizations, " In Proceedings of the 2nd ACM Conference on Computer and communications security, p. 241- 250, New York, 1994.
- M. S. Saleh, A. Alrabiah, and S. H. Bakry, "Using ISO 17799:2005 information security management: a STOPE view with six sigma approach, " International Journal of network management, v. 17, 2007, pp.85- 97.
- DNB Framework Information Security, point to consider: Available from http://www.toezicht.dnb.nl/en/binaries/51-230769.XLSX
- T. L. Saaty, The analytical hierarchy process.Pittsburg: PWS Publications, 1990.
- T. L. Saaty, "How to Make a Decision: The Analytic Hierarchy Process," Interfaces, vol. 24, no. 6, pp. 19-43, Nov.-Dec. 1994.
- S. t. Phanaru and T.Wannasiri," Applying Fuzzy Analytic Hierarchy Process to Evaluate and Select Product of Notebook Computers, " International Journal of Modeling and Optimization, Vol. 2, No. 2, April 2012
- T. L. Saaty, The Analytic Hierarchy Process, Planning, Priority Setting, Resource Allocation. McGraw-Hill, New York, 1980.
- Y. C. Erensal, T. Oncan, and M. L. Dernircan. " Determining Key Capabilities in Technology Management using Fuzzy Analytic Hierarchy Process: A Case Study of Turke, " In Proceedings of Information Science, vol. 176, no. 18, pp. 2755-2770, Sep. 2006
- J. J. Buckley, "Ranking Alternatives using Fuzzy Numbers, " FuzzySets and Systems, vol. 15, no. 1, pp. 21-31, Feb. 1985.
- J. J. Buckley, "Fuzzy Hierarchical Analysis, "Fuzzy Sets and Systems, vol. 17, no. 3, pp. 233-247, Dec. 1985.
- D. Dubois and H. Prade, Fuzzy Sets and Systems: Theory and Applications, New York: Academic Press, 1980.
