Medical Image Segmentation through Bat-Active Contour Algorithm

Author: Rabiu O. Isah, Aliyu D. Usman, A. M. S. Tekanyi
Journal: International Journal of Intelligent Systems and Applications(IJISA) @ijisa
Article in issue: 1 vol.9, 2017.
Free access
In this research work, an improved active contour method called Bat-Active Contour Method (BA-ACM) using bat algorithm has been developed. The bat algorithm is incorporated in order to escape local minima entrapped into by the classical active contour method, stabilize contour (snake) movement and accurately, reach boundary concavity. Then, the developed Bat-Active Contour Method was applied to a dataset of medical images of the human heart, bone of knee and vertebra which were obtained from Auckland MRI Research Group (Cardiac Atlas Website), University of Auckland. Set of similarity metrics, including Jaccard index and Dice similarity measures were adopted to evaluate the performance of the developed algorithm. Jaccard index values of 0.9310, 0.9234 and 0.8947 and Dice similarity values of 0.8341, 0.8616 and 0.9138 were obtained from the human heart, vertebra and bone of knee images respectively. The results obtained show high similarity measures between BA-ACM algorithm and expert segmented images. Moreso, traditional ACM produced Jaccard index values 0.5873, 0.5601, 0.6009 and Dice similarity values of 0.5974, 0.6079, 0.6102 in the human heart, vertebra and bone of knee images respectively. The results obtained for traditional ACM show low similarity measures between it and expertly segmented images. It is evident from the results obtained that the developed algorithm performed better compared to the traditional ACM.
Active Contour Method, Bat Algorithm, Jaccard Index, Dice Similarity
Short address: https://sciup.org/15010890
IDR: 15010890
Text of the scientific article Medical Image Segmentation through Bat-Active Contour Algorithm
Published Online January 2017 in MECS
Image segmentation plays a significant role in image processing and computer vision techniques [1]. It has a myriad of application of space technology, medical imaging, video surveillance and military systems. Image segmentation methods such as Otsu’s global thresholding, watershed segmentation, clustering techniques, region growing and active contour model has been implemented over the years [1]. This latter technique also known as a snake model was first introduced by [2]. The technique is based on energy minimization of a contour under the influence of an internal and external force. The snake model has a myriad of applications in medical image segmentation such as breast tumor, ultrasound images, breast lesion and liver cirrhosis segmentation.
Bat algorithm is a recent metaheuristic approach developed by [3] based on the echolocation behavior of bat [4]. Echolocation involves emission of a very loud sound pulse and listens to the echo that returns from the objects [5]. Bat use this echo information to avoid obstacles and detect its prey [5]. This algorithm incorporates the advantages of the existing algorithm such as Particle Swarm Optimization (PSO), Genetic Algorithm (GA), Firefly Algorithm (FA), Harmonic Search (HS) etc. [6]. It has been established that the BA is more powerful and superior in terms of accuracy, efficiency and stability compared to FA, PSO, GA and HS [6].
The main limitations of the classical snake method include the initialization of the evolving contour, the entrapment of the contour convergence on the local minima and manual selection of weight parameters of the external energy. These result in the inaccurate delineation of the region of interest leading to wrong segmentation of the resultant image. In this research, BA has been used to solve some of the problems of the active contour model.
The paper is organized as follows: section one is an introduction about the paper, limitations, aims and structure. The section two is a literature review about the research work, while section three and four discuss traditional active contour method and bat algorithm respectively. Then, section five discusses the materials used and the methods employed to achieve the research objectives. Section six analyzes and discusses the results obtained from the proposed method. The last section is a conclusion about the developed algorithm.
-
II. R ELATED W ORKS
This section gives a brief review of various approaches that have been employed to solve some of the limitations of the active contour:
-
[7] Employed Differential Evolution (DE) to improve the classical active contour method. This technique was termed Multiple Active Contours Differential Evolution (MACDE). The developed algorithm experimented on Computed Tomography (CT) and Magnetic Resonance Imaging (MRI) images of the human heart and human left ventricle. The results obtained outperformed the classical active contour in terms of efficiency and robustness, but with high computational time.
-
[8] Presented a hybrid algorithm that incorporated L’evy Flight Firefly Algorithm (LFA) into Active Contours Model (ACM). The hybrid method was tested on real Computed Tomography (CT) of the abdomen and it outperformed traditional ACM but the problem of manual selection of control parameters was not addressed.
-
[9] Developed a region-based active contour method to provide a solution to the problem of intensity inhomogeneity in images. This method employed both region and gradient information in contrast to traditional active contour. The new technique experimented on 2D synthetic and brain Magnetic Resonance (MR) images. The results were better compared to the state-of-art of active contour method.
-
[10] Integrated a new regularization function to solve the problem of contour evolutionary irregularities in the presence of inhomogeneity and noise. The new method was tested on MRI images and the results were promising. The drawback was that the new method had higher computational complexity.
-
III. A CTIVE C ONTOUR M ETHOD
Active contours also known as snakes are deformable splines under the influence of internal and external forces [11]. The internal force controls the smoothness of the contour while the external force pulls the contour towards the object boundaries based on the image features such as line and image gradient [12].
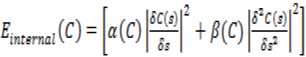
The deformation is based on the minimization of the total energy of the contour given as [13]:
^total M = internal (^) + External (Q (1)
where,
C represents the contour
E is the total energy of the contour
E is the internal energy of the contour
E is the external energy of the contour
where,
Cl and s are the weights to the energy terms
C is the contour s represents the control point of the contour
The external energy is given as:
^external M ~ Wline^line + ^sdgs ^edge "^ Wterm^tsrm (3)
where,
^line , ^ edge, ^term are the weights of the energy term.
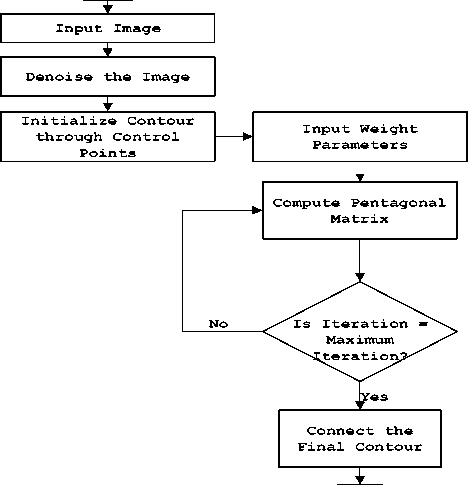
The ACM implementation is carried out using the following steps:
-
a) Inputting the image
-
b) Preprocessing the image
-
c) Inputting discrete points
-
d) Defining a contour through the sample points on the curve
-
e) Inputting parameter values for snake computation
-
f) Defining pentagonal matrix where α, β are the coefficient values and checking the condition, Iterations = Maximum Iterations
-
g) Ending and fitting spline to the final contour.
This ACM algorithm’s execution is depicted in Fig.1:
The internal energy is expressed in terms of first and second derivatives of the contour and is given as [13]:
Г Start )
( Stop J
Fig.1. Flowchart of ACM Algorithm
-
IV. B AT A LGORITHM
Bat algorithm is a new meta-heuristic method developed by Xin-She Yang in 2010 based on the echolocation property of natural bats [14]. Bat utilized this salient characteristic to detect their prey and avoid any obstacles in their way [15]. Bats have the capability to emit a large sound and listen to the reflection of the echo that reflects back from the surrounding objects to detect their preys [15]. This pulse reflection can be converted to frequency and turned into useful information.
The movement of the bat in a search space is associated with velocity t^ , a frequency f and a particular position ^r at iteration t [16]. The frequency, velocity and bat position equations are given as [16]:
ft — /min "^ ^fmax fmin)P’(4)
-
< = <Ч^-х^,(5)
x^x^+v^,(6)
where, and fmin are the minimum and maximum frequency respectively
-
3 is a random vector between 0 and 1
-
v- is the initial velocity of the bat
-
V- is the current velocity of the bat
-
F, is the initial location of the bat
^i is the current location of the bat
^s is the current global best location (solution)
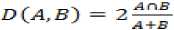
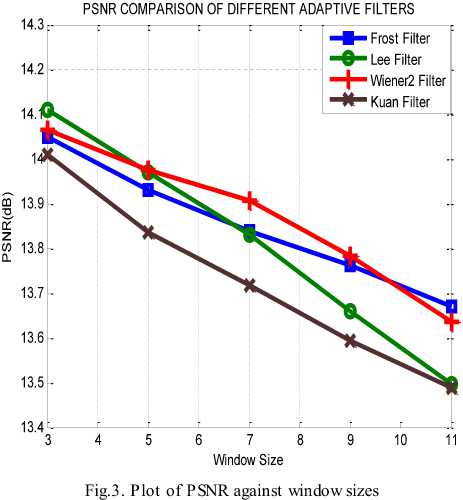
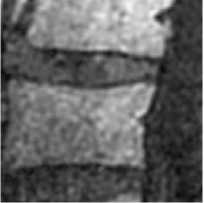
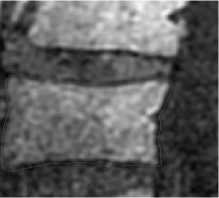
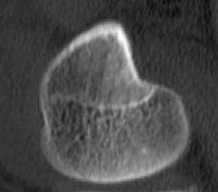
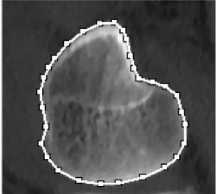
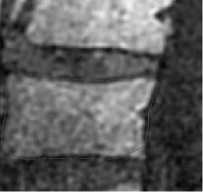
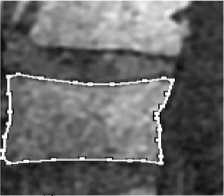
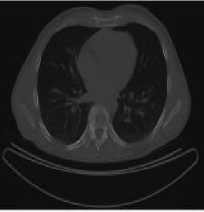
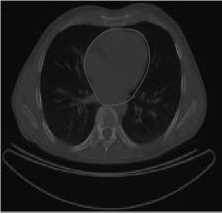
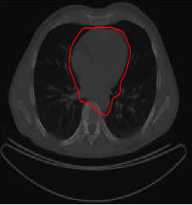
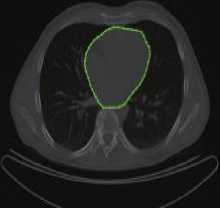
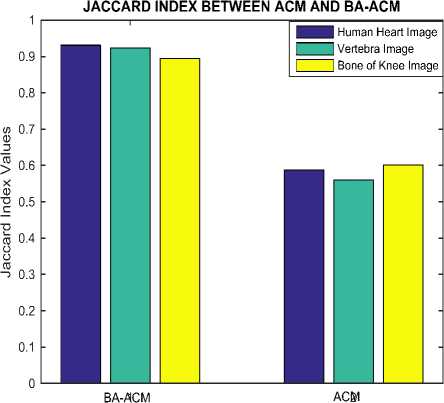
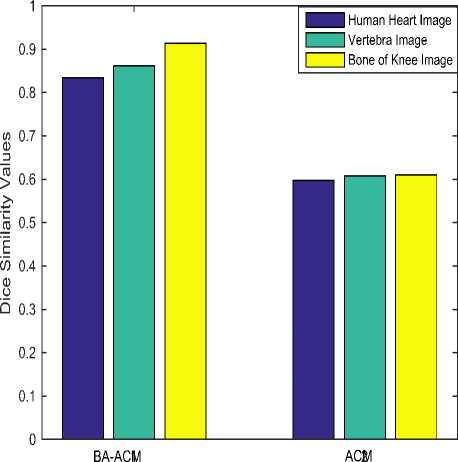
Initialize pulse rates Г| and the loudness ^L while (t Generate new solutions by adjusting the frequency, and updating velocities and locations/solutions if (rand > Fj ) Select a solution among the best solutions Generate a local solution around the selected best solution end if Accept the new solutions Increase Г| and reduce ^L end if Rank the bats and find the current best end while Post-process results and visualization V. MATERIALS AND METHODS This section describes procedures undertaken to achieve better segmentation results. A. Image Filtering In this research, an adaptive filter (Lee Filter) was employed to effectively remove speckle noise from the medical images. Speckle noise is a multiplicative noise known to affect medical images. This research compared four different types of adaptive filters including, Wiener2, Lee, Frost and Kuan filters. B. Bat-Active Contour Algorithm Bat algorithm is incorporated into traditional ACM to adaptively select external energy weights and escape local minima entrapped into by the classical snake method. This is shown in the flowchart in Fig.2: C. Parameters for the Developed Algorithm The following bat algorithm parameters were adopted (Yang, 2013): i. Maximum frequency = 2 ii. Minimum frequency = 0 iii. Number of Population = 20 iv. Number of Generation = 1000 v. Loudness,Л = 0.5 vi. Pulse rate, r = 0.5 The following active contour parameters were used: α = 0.4; β =0.2. γ =1.0. D. Evaluation Metrics Metrics including Peak Signal-to-Noise Ratio (PSNR), Jaccard Index and Dice Similarity are employed to evaluate the performance of the developed algorithm: 1. Peak Signal-to-Noise Ratio (PSNR): PSNR is expressed in decibel and is commonly used as a measure of quality reconstruction of image [17]. The high value of PSNR indicates the high quality of image [17]. PSNR is given as [18]: 2. Jaccard Index and Dice Similarity Measure are similarity measures located in the range [0, 1] used to compare images and binary variables [19]. They are computed using equations (8) and (9): PSNR= 101og10P‘,Qk*,ai“‘,:i (7) MSE 7QA, a) = ^^- , (8) Stop Fig.2. Flow Chart of BA-ACM Algorithm where, A is the segmented region using the algorithm B is the segmented region by an expert VI. RESULTS AND DISCUSSION This section discussed results obtained using the developed algorithm. Table1 shows different values of PSNR for different adaptive filters. It is observed that at the lowest window level, the adaptive filters have highest PSNR values. Table 1. PSNR Comparison Of Different Adaptive Filters Window Size Frost Filter Lee Filter Wiener2 Filter Kuan Filter 3i3 14.0484 14.1101 14.0655 14.0088 5x5 13.9310 13.9690 13.9750 13.8366 ■x? 13.8372 13.8297 13.9068 13.7160 9x9 13.7619 13.6593 13.7816 13.5937 11x11 13.6701 13.4965 13.6353 13.4871 Consequently, the images have the highest quality at the lowest window size. Also, Table1 depicts that Lee filter with the PSNR value of 14.1101 decibels produced the highest quality of the image. In addition, Fig.3 is a plot of the comparison of different adaptive filters based on the PSNR. The green, red, blue and purple lines represent Lee, Wiener2, Frost and Kuan filters respectively. In Fig.3, it is also observed that the Lee filter has the highest value of PSNR. This implies that the Lee filter has the most effective despeckling effect on the images. Moreso, Fig.4 shows Computer Tomography (CT) images of the bone of the knee. ЕЯ ЕЯ (a) Original Image (b) BA-ACM Image (a) Original Image (b) BA-ACM Image (c) ACM Image (d) Expert Image (c) ACM Image Expert Image Fig.6. X-ray image of vertebra: (a) original image, (b) BAT -ACM image (c) ACM image, (d) Expert Segmentation. Fig.4. CT image of a bone of knee: (a) original image, (b) BAT-ACM image (c) ACM image, (d) Expert Segmentation. (a) Original Image Fig.4a is the original image, Fig.4b represents the output of the developed algorithm, Fig.4c is the result of traditional ACM and Fig.4d is the segmented image by an expert. Moreso, Fig.5 shows Computer Tomography (CT) images of the Human Heart. (b) BA-ACM Image Fig.6a is the original image, Fig.6b represents the output of the developed algorithm, Fig.6c is the result of traditional ACM and Fig.6d is the segmented image by an expert. Table2 shows that Jaccard index values of 0.9310, 0.9234 and 0.8947 and Dice similarity values of 0.8341, 0.8616 and 0.9138 were obtained from the human heart, vertebra and bone of knee images respectively. The results obtained show high similarity measures between BA-ACM algorithm and expert segmented images. Moreso, traditional ACM produced Jaccard index values of 0.5873, 0.5601 and 0.6009 and Dice similarity values of 0.5974, 0.6079 and 0.6102 in the human heart, vertebra and bone of knee images respectively. (c) ACM Image xpert Image Fig.5. CT image of Human Heart: (a) Original Image, (b) BAT -ACM image, (c) ACM image, (d) Expert Segmentation Table 2. Results of Similarity Measures for the developed algorithm and the traditional ACM Algorithm S/N Images Jaccard Index for BA-ACM Similarity for BA- ACM Jaccard Index for ACM Similarity for ACM 1 Heart 0.9310 0.8341 0.5873 0.5974 2 Vertebra 0.9234 0.8616 0.5601 0.6079 3 Bone of Knee 0 8947 0 9138 0 6009 0.6102 The results obtained for the traditional ACM show low similarity measures between it and expertly segmented images. It is evident from the results obtained that the developed algorithm performed better compared to the traditional ACM. This is because the values obtained for the developed algorithm are closer to one (1) co mpared to the traditional ACM. Consequently, better delineation of a region of interest was achieved. Fig.5a is the original image, Fig.5b represents the output of the developed algorithm, Fig.5c is the result of traditional ACM and Fig.5d is the segmented image by an expert. Fig.7. Jaccard Index Bar Chart for the ACM and BA-ACM DICE SIMILARITY MEASURES BETWEEN BA-ACM AND ACM Fig.8. Dice Similarity Bar Chart for the ACM and BA-ACM Fig.7 and 8 show the bar chart for the ACM and BA-ACM results. The three columns to the left in Fig.7 and 8 represent Jaccard index and dice similarity measures of the BA-ACM and are closer to one compared to the three columns to the right which represent Jaccard index and dice similarity measures of the ACM. Therefore, Fig.7 shows significant improvements of 0.3437, 0.3633, 0.2938 Jaccard index values and Fig.8 shows improvements of 0.2367, 0.2537, 0.3036 dice similarity measures of BA-ACM over ACM for the human heart, vertebra and bone of knee images respectively. The reason for the significant improvement was that the bat algorithm is robust and contains frequency-tuning technique that increases the diversity of solution for the population. This makes the developed algorithm to adaptively choose suitable weight values for the external energy of the evolving contour in order to reach boundary concavity more accurately compared to the traditional ACM. Furthermore, the incorporation of the bat algorithm into the traditional ACM improves the convergence rate of the evolving contour. VII. CONCLUSION In this work, an improved active contour segmentation method guided by bat algorithm has been developed. The developed algorithm was able to achieve good segmentation of test medical images by adaptive selection of weight parameters, escaping entrapment into local minima and reaching the boundary concavity. Metrics such as Jaccard index and Dice similarity measures were employed to evaluate the performance of the algorithm. The results obtained show high similarity measures between BA-ACM algorithm and expert segmented images. Also, the traditional ACM algorithm exhibits low similarity measures in terms of Jaccard index and Dice similarity measures. The developed algorithm shows higher performances in terms of similarity measures and achieves accurate delineation of regions of interest compared to the traditional method. This implies that the developed algorithm is suitable to be employed for routine segmentation by medical experts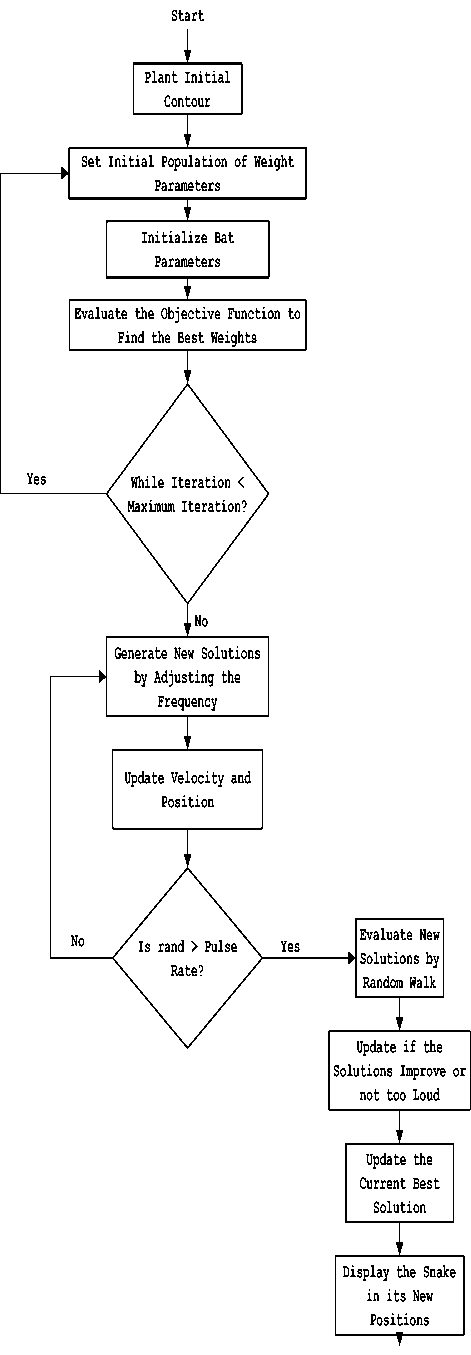
References Medical Image Segmentation through Bat-Active Contour Algorithm
- O. R. Vincent and O. Folorunso, ‘‘A Descriptive Algorithm for Sobel Image Edge Detection,’’ Proceedings of Informing Science & IT Education Conference, 2009, pp. 97-107.
- M, Kass, A, Witkin, and D. Terzopoulos, ‘‘Snakes: Active contour models,’’ International journal of computer vision, 1988, 1(4):321-331.
- X.-S, Yang, ‘‘A New Metaheuristic Bat-Inspired Algorithm, in: Nature Inspired Cooperative Strategies for Optimization (NISCO 2010) (Eds. J. R. Gonzalez et al.)’’, Studies in Computational Intelligence, Springer Berlin, 284, Springer, 2010, 65-74.
- A. Alihodzic, and M. Tuba, ‘‘Improved bat algorithm applied to multilevel image thresholding,’’ Hindawi Publishing Corporation the Scientific World Journal, 2014, 1-16. DOI:10.1155/2014/176718.
- V. Rajinikanth, J.P. Aashiha, and A. Atchaya, ‘‘Gray-level histogram based multilevel threshold selection with bat algorithm,’’ International Journal of Computer Applications, 2014, 93(16):1-8.
- X-S. Yang, and X. He, ‘‘Firefly algorithm: Recent advances and applications,’’ International Journal of Swarm Intelligence, 2013, 1(1):36–50. DOI: 10.1504/IJSI.2013.055801.
- I. Cruz-Aceves, J. G, Aviña-Cervantes, J. M, López-Hernández, and S. E. González-Reyna, ‘‘Multiple active contours driven by particle swarm optimization for cardiac medical image segmentation,’’ Computational and Mathematical Methods in Medicine, 2013a, 1-13.
- A. Sahoo, and S. Chandra, ‘‘L´evy-flight firefly algorithm based active contour model for medical image segmentation,’’ Sixth IEEE Conference on Contemporary Computing (IC3), 2014, 162, 159-164.
- F. Akram, J. H. Kim, H. U. Lim, and K. N. Choi, ‘‘Segmentation of intensity inhomogeneous brain MR images using active contours,’’ Computational and Mathematical Methods in Medicine, 2014, 1-14.
- S. Chack, and P. Sharma, ‘‘An improved region based active contour model for medical image segmentation,’’ International Journal of Signal Processing, Image Processing and Pattern Recognition, 2015, 8(1):115-124.
- H. Akbar, N. Suryana, and S. Sahib, ‘‘Controlling B-spline snake behaviour using particle swarm optimization’’. International Journal of Bioautomation, 2012, 16(3):179-186.
- A. Kumar, A. Wong, A. Mishra, D. A. Clausi, and, P. Fieguth, ‘‘Tensor vector field based active contours,’’ 2011.
- M. Talebi, A. Ayatollahi, and A. Kermani, ‘‘Medical ultrasound image segmentation using genetic active contour’’ Journal of Biomedical Science and Engineering, 2011, 4, 105-109.
- X-S. Yang, ‘‘Bat algorithm: Literature review and applications,’’ International Journal of Bio-Inspired Computation, 2013a, 5(3):141–149.
- I. Fister, D. Fister, and X-S. Yang, ‘‘A hybrid bat algorithm,’’ Elektrotehniˇski Vestnik, 2013, 80(1-2):1–7.
- X-S. Yang, ‘‘A new metaheuristic bat-inspired algorithm, in: Nature inspired cooperative strategies for optimization (NISCO 2013) (Eds. J. R. Gonzalez et al.),’’ Studies in Computational Intelligence, Springer Berlin, 284, Springer, 2013b, 65-74.
- P. Kaushik, and Y. Sharma, ‘‘Comparison of different image enhancement techniques based upon PSNR & MSE’’. International Journal of Applied Engineering Research, 2012, 7(11): 2010-2014.
- C. Ece, and M. U. Mullana, ‘‘Image quality assessment techniques pn spatial domain,’’ International Journal of Computer Science and Technology, 2011, 2(3):177-184.
- I. Cruz-Aceves, J. G. Avina-Cervantes, J. M. Lopez-Hernandez, H. Rostro-Gonzalez, C. H. Garcia-Capulin, M. Torres-Cisneros, and R. Guzman-Cabrera, ‘‘Multiple active contours guided by differential evolution for medical image segmentation,’’ Computational and Mathematical Methods in Medicine, 2013b, 1-14.
