Meta-Population Modelling and Simulation of the Dynamic of Malaria Transmission with Influence of Climatic Factors

Author: Justin-Herve NOUBISSI, Jean Claude Kamgang, Eric Ramat, Januarius Asongu, Christophe Cambier
Journal: International Journal of Information Technology and Computer Science(IJITCS) @ijitcs
Article in issue: 7 Vol. 9, 2017.
Free access
We model the dynamic of malaria transmission taking into account climatic factors and the migration between Douala and Yaounde´, Yaounde´ and Ngaounde´re´, three cities of Cameroon country. We show how variations of climatic factors such as temperature and relative humidity affect the malaria spread. We propose a meta-population model of the dynamic transmission of malaria that evolves in space and time and that takes into account temperature and relative humidity and the migration between Douala and Yaounde´, Yaounde´ and Ngaounde´re´. More, we integrate the variation of environmental factors as events also called mathematical impulsion that can disrupt the model evolution at any time. Our modelling has been done using the Discrete EVents System Specification (DEVS) formalism. Our implementation has been done on Virtual Laboratory Environment (VLE) that uses DEVS formalism and abstract simulators for coupling models by integrating the concept of DEVS.
Modelling, Simulation, Compartmental models, DEVS, Meta-population model, VLE
Short address: https://sciup.org/15012659
IDR: 15012659
Text of the scientific article Meta-Population Modelling and Simulation of the Dynamic of Malaria Transmission with Influence of Climatic Factors
Published Online July 2017 in MECS
Malaria is one of the most important issues in almost all countries of the tropical area. Despite the efforts of various cross disciplines involved, malaria continues to be a major problem of public health. In Cameroon, a country located in the red zone climate with maximum suitability for malaria transmission, health statistics reveal that it is responsible for 35-40% of all deaths in health facilities: 50% of morbidity in children under 5 years old, 40 to 45% of medical consultations and 30% of hospitalizations. Malaria is also the cause of 26% of absences in the workplace and 40% of household health expenditure [1]. Developing countries such as Cameroon are reduced to fight against vector through the use of insecticide-treated bed nets, which means if efficient, to limit the parasite load below critical thresholds in host, rapid detection of cases of sick to reduce contact infesting for vectors. The dynamic of transmission and seasonality of malaria remain research preoccupation not solved. If levels of malaria prevalence in urban areas are lower compared to rural areas, the population growth and the spatial heterogeneity of parts are such that the risk of malaria infection and consequences (disease, mortality), differs among epidemiological status and periods of the year. Considering spatial and climatic heterogeneity of the world in general and Cameroon specifically, take into account spatial and temporal variations is important for vector-borne diseases, where the underlying factors of epidemiology observed can be confused by some large heterogeneities in the host and vector densities across space and time, as in the case of malaria. In this context, we will focus on the modeling of dynamic of malaria including spatial and temporal consideration between respectively Douala and Yaounde´ (respectively Yaounde´ and Ngaounde´re´) cities and the influence of climatic factors (temperature influences the life cycle of the mosquito, relative humidity plays a role in the life of the mosquito and malaria transmission) on the spread of that disease.
-
II. Survey
Knowledge of what we want to model is essential for an effective modelling. Modelling in epidemiology depends heavily on knowledge of biology. Malaria is transmitted by the female anopheles mosquito genus. In humans, the causative agent of malaria is a single-celled parasite called plasmodium. The understanding of mosquito transmission mechanism to the human has been highlighted in 1897 by Ronald Ross. Many years before the beginning of the nineteenth century, the medical com- munity has long focused on treating patients, not on mosquitoes. The assumption being that it was impossible to completely eradicate mosquitoes in a given area, so there will be always mosquitoes. Ronald Ross in ”Prevention of malaria” [2] states that eradication of malaria is possible in an area. Ross proposed a model in which he calculated the number of new infections per month as a product of factors; he deduced that there is a critical density of mosquitoes. In 1952, George MacDonald, based on the work of Ross, introduced the concept of reproduction. The basic reproductive number (R0) of malaria is defined as the number of infection distributed in a community resulting from the presence within it of a single primary infected. In epidemiology, models predict the dynamics of the epidemic inside populations from knowledge at the individual level between epidemiological factors, the long-term behaviour of the dynamic early invasion, or the impact of vaccination on the spread of infection [3]. [4] consider the world as a network where individuals are nodes with sensor. They proposed a Susceptible-Exposed-Infectious-Quarantine-Recovered-Susceptible with Vaccination (SEIRS-V) model that describes the spatial and temporal dynamic of worm spread. The spread of an infectious agent within a population is a dynamic phenomenon: the numbers of healthy and diseased individuals change over time, depending on the contacts during which the agent passes from an infected individual to a healthy individual immunized, infecting turn. This kind of phenomenon can be studied by modelling by differential equations and determining their behaviour through numerical solution of these equations [3], we call them compartmental models. Heterogeneities and structure of the space where a disease evolves is very important in understanding how epidemics spread [5]. Humans and mosquitoes here are organized in well-defined units such as families, villages, cities, countries or regions that constitute what we call patches. Based on the model of Ross-MacDonald, Tsanou [6] provides a metapopulation model of many patches, and shows that there
is a threshold below which the disease disappears and above which the disease remains within the metapopulation. In the Tsanou model, demography is neglected (populations sizes are assumed constant), epidemiological parameters are the same for all patches. More, Tsanou does not take into account climatic factors while Lourenco [7], through a study on the dengue disease, shows that spatial-temporal variations are sufficient to destabilize the balance of a system. Almost all insects have a moisture tolerance and temperature beyond which it becomes impossible for them to survive. Mosquitoes do not escape this rule. [8] compared to a given temperature, the survival of female anopheles pharoensis at 20 ° , 26 ° , 30 ° C and a slight difference in terms of longevity in conditions of relative humidity taken between 50% and 90%. Whereas the probability of survival was independent of age, [9] measured the longevity of Anopheles gambiae s.s by considering the relative humidity at 40%, 60%, 80% and 100%, and a temperature between 5 ° C and 40 ° C. There is a slight difference in survival with a relative humidity between 60% and 100%. Furthermore, molecular biology techniques applied to Anopheles gambiae s.s tested with relative humidity at 42% [10] and 30% [11] have shown that mosquitoes held without food or water survived an average of 15.6 hours at 30% relative humidity compared to 26.2 hours at 70% relative humidity [11]. [12] with a study in sub-saharian Africa region, show that mortality of mosquitoes, especially Anophele gambia s.s , depends on temperature and the mosquito age at different stages (Egg, Larvae, Pupa, Adult). [13] through a study in Eastern Africa, have showed that there is a strong and significant cross-coherence between malaria cases and average rainfall and vegetation. Recent studies on desiccation mosquitoes showed an extremely low relative humidity ( < 10%) is fatal to mosquitoes who spend a few hours [14]. Several studies show that the Anopheles gambiae s.s and Anopheles arabiensis female survive a whole day for a relative humidity below 10% [15] or less than 20% [16]. Only a few mosquitoes survive beyond 30 hours at a relative humidity below 10%. It thus appears that a relative humidity greater than 60%, Anopheles gambiae is not significantly affected, but a relative humidity below 10% is fatal to the Anopheles gambiae [14]. There are, however, very little information for a relative humidity between 10% and 40%. The commonly used survival equation is the equation of Marterns [17] defined
- 1
by p ( T ) = exp(------------------) , where T is the mean
-
- 4.4 + 1.31 T - 0.03 T 2
daily temperature in Celsius degrees. This function provides maximum durability for a temperature between 20-25 ° C and severe mortality for temperatures below 10 ° C and above 35 ° C [18].
For taking into account climatic factors, some models have been developed. [18] proposed a SIRS-type model using a deterministic approach. Their model was built on the MacDonald equations, specifying states for infected-not-contagious and contagious children. Human part of the cycle was modelled by SIGRS, where S is defined as the proportion of susceptible children, the state I represents the proportion of infected but not contagious children, G is the production of contagious children and R is the proportion of children resistant to infection. The transition from state S to state I depends on vectorial and climatic factors. Vectorial part was modelled with a two-state model: the state of Susceptible anopheles (S) and the state of Contagious anopheles (I). They showed that the transmission increases (respectively decreases) when the vegetation index increases (respectively decreases). Nevertheless, [18] has neglected the natality and mortality rates. In their model, climatic factors involve at the infection level (contact Human-Vector), not at the complete mosquito life cycle with/without contact between Human and Vector. More, they don’t take into account migration; their model is not meta-population.
-
A. Plasmodium species and malaria vector in Cameroon
The surveys published in recent years by the Cameroon National Program against Malaria presented the Plasmodium falciparum parasite species as the most common in Cameroon, followed by Plasmodium malariae and Plasmodium ovale. In Cameroon, a country with one of the richest faunas anopheles in Africa, and it houses 48 species of Anopheles from the work of [19]. Among these, the sporozoites of Plasmodium have been identified in 13 of them. These are Anopheles gambiae ss, the anopholes funes- tus ss, the moucheti Anopheles, Anopheles arabiensis, Anopheles nili, Anopheles hancocki, the paludis Anopheles, Anopheles marshallli, Anopheles coustani, the Anopheles ovengensis, Anopheles pharonensis, wellcomei Anopheles, Anopheles ziemani. Anopheles gambiae ss and Anopheles arabensis are the main infected species found in Cameroon. The more one leaves the forest for the savannah and the Sahel, the more effective Anopheles gambiae s.s decreases and that of arabensis increases and vice versa.
Table 1. Spatial distribution of anopheles in the complex ecological facies of Cameroon [20] .
|
Facies |
Anophele gambiae s.s |
Anophele arabensis |
Total |
|
Forest |
796 (99,7%) |
2 (0,3%) |
798 |
|
Savannah |
146 (25,0%) |
439 (75,0%) |
585 |
|
Sahel |
14 (4,5%) |
299 (95,5%) |
313 |
|
Total |
956 (56,4%) |
740 (43,6%) |
1696 |
As we note, the mosquito density varies with region (Forest, Savannah and Sahel) in Cameroon. These three identified geographical areas with different weather and climatic conditions, point to the fact that rainfall, temperature and/or humidity influence the mosquito type and density.
-
B. Influence of Climatic factors
We focus here on Douala and Yaounde´, two cities located in the Forest area of Cameroon, but with some different climatic variables. Fig. 1 and Fig. 2 show average temperature, rainfall and humidity of Douala and Yaounde´ cities.
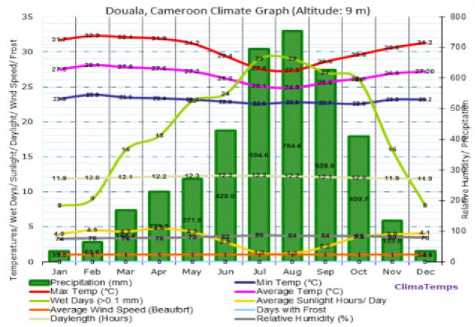
Fig.1. Temperature, rainfall and relative humidity of Douala city. Source:
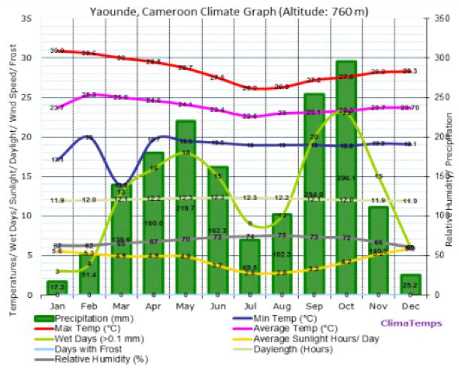
Fig.2. Temperature, rainfall and relative humidity of Yaounde´ city. Source:
Table 2 shows the quantities of anopheles breeding sites in Douala and Yaounde´ cities depending the seasons (rainy and dry). This is the result of a study conducted from October 2009 to December 2010 by [21]. We mark that Douala and Yaounde´ cities, although belonging to the same ecological facies (Forest), demonstrate a significant difference in term of number of breeding sites during the rainy season October to November (416 for Douala and 201 for Yaounde´) and reproduction of sites with Anopheles (102 for Douala against 58 for Yaoundé´) during the same period. This difference can be explained by the high humidity in Douala during that period (about 85) compared to Yaounde´ (about 70), while temperatures of the two cities is approximately similar over that period, as presented in Fig. 1 and Fig. 2.
Table 2. Characteristics of breeding sites sampled in Douala and Yaoundé from October 2009 to December 2010.
|
Douala and Yaounde´ sea sons |
Number of breeding sites |
Breeding site housing the Anopheles |
Breeding site housing the Anopheles and Culex |
|
Douala - Rainy season (October-November 2009) |
416 |
102 (24,5%) |
12 (3%) |
|
Douala - Dry season (February-March 2010) |
100 |
29 (29%) |
24 (24%) |
|
Douala - Rainy season (May-June 2010) |
126 |
79 (63%) |
28(22.2%) |
|
Douala - Dry season (August-September 2010) |
146 |
95 (65%) |
27 (18.5%) |
|
Douala - Dry season (December 2010) |
68 |
33 (48.5%) |
18 (47.4%) |
|
Yaounde´ - Rainy season (October-November 2009) |
201 |
58 (28.9%) |
18 (9%) |
|
Yaounde´ - Dry season (February-March 2010) |
115 |
40 (34.8%) |
34 (29.6%) |
|
Yaounde´ - Rainy season (May-June 2010) |
173 |
81 (46.8%) |
26 (15%) |
|
Yaounde´ - Dry season (August-September 2010) |
117 |
40 (34%) |
13 (11.1%) |
|
Yaounde´ - Dry season (December 2010) |
84 |
38 (45.2%) |
14 (42.4%) |
Concerning Ngaounde´re´, the city is located in the transition area between Forest and Savannah area of Cameroon and the vegetation is of the sudano-guinea type [22].
в 0 = 0.00113*RH 2 -0.158*RH-6.61
< в 1 = -2.32*10 -4 *RH 2 + 0.0515*RH + 6.61
в = 4*10 -6 *RH 2 -1.09*10 -3 *RH-0.0255
-
III. Our Modelling
Inspired by the model developed by [23] who work on diseases with direct transmission between individuals of the same nature, we model malaria where transmission between humans is done via a vector (mosquito). Moreover, our model considers meta- population between respectively Douala and Yaounde´ (Yaounde´ and Ngaounde´re´) cities that evolves different epidemiological faces in the city (SEIR model for Douala, SEIRS model for Yaounde´ and SEIS for Ngaounde´re´). Moreover, we consider births and also take into account the climatic and meteorological factors using the survival function proposed by [24] (inspired by the Martens equation presented above) defined as:
P(T,RH) = e(
-1
T 2 * в 2 + T * в 1 + в 0
) , where
p is the probability of survival and the mortality rate is giving by - ln( p ( T, RH )) [25].
We assume that there is no cross-infection and that infectious humans do not travel (they are quarantined). We also assume that only humans move between patches (voluntary moving of mosquitoes in space is limited over the patches considered are remote) and the mortality rate of these travellers in a city is the same as that of the residents of the host city.
Let N (respectively NVi ) be the total human population (respectively vectors) patch i . We also denote by ϕij SH the Susceptible residents of patch i that are travelling in the patch. ϕij EHi is the infected residents of patch i who are travelling in the patch j , ϕij RHi the Recovered and Immunized residents of patch i that are moving in the patch j , SVi represents the Susceptible mosquitoes residents in the patch, EV the Infected mosquitoes residents in the patch, and I t Infectious mosquitoes residents in the patch i .
Table 3. Parameters and description.
|
Parameters |
Description |
|
n |
number of patches |
|
ϕ j ≥ 0 , |
proportionofmigrationofhumansfromthepatch to the patch j |
|
d H |
naturalmortalityrateofhumansofthepatch |
|
d V |
naturalmortalityrateofmosquitoesofthepatch |
|
β |
Proportion of contact inside the patch between Susceptible humans and infectious mosquitoes. k is the average number of such contacts. b = k β |
|
ω |
Proportion of contact inside the patch i between Infectious humans and Susceptible mosquitoes. f is the average number of such contacts |
|
δH |
rate of Infected humans that become Infectious inside thepatch |
|
ρH |
rate of Infectious humans that become Susceptible insidethepatch |
|
δ V |
rate of Infected mosquitoes that become Infectious inside the patch |
|
α H |
recoveryrateofInfectioushumansinsidethepatch |
|
γ H |
death-rate of Infectious humans due to the disease |
|
µ H |
humanbirth ratein thepatch |
|
µ V |
mosquitobirthrateinthepatch |
|
ε H |
recovery rate of recovered humans (eventually immunised) become Susceptible later |
|
p ( T, RH ) |
survivalprobabilityforamosquito insidethepatch with a temperature T and a relative humidity RH |
A. SEIR model: Case of Douala
Malaria transmission there is continuous throughout the year [20], we model Douala city by a SEIR model. We distinguish three cases: Model without climatic factors, Model taking into account climatic factors only during human-mosquito contact, Model taking into account climatic factors throughout all the mosquito evolution cycle ( S → E → I ). With the notation presented earlier, our modelling of humans present in Douala ( i denotes Douala and j Yaounde´) model is as follows:
A.1 Model without climatic factors
. nn
S H . = ^ H N Hi + У V ji S H j ~У V ij S H - kiPi^T^ I V; - d H SH j = 1 j = 1
j *.j
.n n
EH. = £ФjlEнj "£ФуЕн, + k.P.^Iv, -5heh_ -dH EH j=1 j=i j *ij
I H = ^ H E H, a H I H T Hi I Hi
.
j=1
jj
.
S y, = M v N v.- P m^ I h, " d v S v, N H i
„ „ Sv. _ _ ._
Evi = fi'™i M IH, SvEv
N H
.
IVj = 5y Ey. - dyIy
A.2 Model tak ng nto account cl mat c factors only dur ng human-mosqu to contact
. nn
Sh, = ^h.Nh. +У Ф^н. - У^ jSH - Pi (T, RH )* k. в. ^^-1- - dHSH i i j=1 j t1 i NH ii i j *ij
.n n
Eh. =1 ФрЕн, "УФцЕн, + P.(T,RH)*k.в.-H -5h Eh, -d^E^ j=1 j=i j«
.
Ih, = dH EH, - йн . / н . - У н^н, - d H^H ,
.nn
RH, =У Ф,^Н, + aHIH, -У фijRH, -dH,RH, j=1
j«
.
S v , " Pv N v - f ^i I H^ d. i - d V S V V V NH H V V
.
E v , = f i®i I^^V "VvEv, "dV, E V, NH .
Iv, = VvEVy - d V I V
A.3 Model tak ng nto account cl mat c factors throughout all the mosqu to l fe cycle
SHi = + 2 Ф^ н, "2 Ф^ и. - k A А',, -
J = 1 J = 1 N H.
j*ij n n
E H i = 2 ф ^Ен, ~2 ф уЕн1 + k i P i TT^ I v- - 5r E H - dH E h.
j = 1 j = 1
j *
IH , = ^ HEHi - aH^H -t - YHtIHt - dHtIHt
. n n(3)
-
- RH, = 2 Ф^и , + « H . IH, " 2 Ф yRH. - dH,RH,
j=1
j *1j
. S
S v , = M v , N v , "f A^ H, + ln( P . ( T , RH ))* S v , NH,
. S
Ev, = /A^h, -s Е , + ln( P , ( T , RH ))* Ev,
NH,
I v , = 8 v E v + ln( p , ( T , RH ))* I v
I
Remark III.1 An mmun zed human n h s home-c ty can lose h s mmun ty n the c ty that hosts h m. So, f we con- s der a m grat on from a c ty A (modelled by SEIR) to another c ty B (modelled by SEIRS), nd v dual R com ng from A may lose h s mmun ty n B and become S.
-
B. SEIRS model: Case of Yaoundé
Malaria transmission is continuous [20].
-
B.1 model w thout cl mat c factors
. n n
S Hi = Ф и N H 1 £H,RH, + 2 фJi S H: -2 ФАн - ‘ 1'PiTAIV, - dH,SH,
-
j = 1 J = 1
-
j*i
Еh, = 2 Ф^Еи. -£ ф,Ен_ + ‘.Р^А, - Sr Er, - dR Er j=1 j=1
J *iJ
.
Ih, = S h ,E h , - a H , IH , - ^ R I H , - d H I H
.nn
-
- Rh, = 2, ф Ji R H j 1 “ HpH, -2, ф ijRH, - £ H ,RH, - dH ,RH,
J=1
j *i
.
S V i = H v NV t - f i '^TV^IH, - d V,SV, N H
. S
E v, = f ®i T^ I H - 8 v, E v, - d v E v.
NH,
.
-
I V , = S V1EV1 d v I v,
-
B.2 Model tak ng nto account cl mat c factors only dur ng human-mosqu to contact
. n n
SHi = Mh,nh, + £h,rh, +2ФJ1SHJ "2Фм8н, -p>(T,RH)*‘P^IV, -dHSH, j=1 j=1
j*,j
.n n
J = 1 J = 1
j *.j
.nn
RH, =2ФJ^RнJ + “H.IH, "2Ф^JRн.-eH,RH, -dH RH, j=1
J *'J
V
S V = P v N v, - f A^^ I H, - dv, S v, V V NH H V V
Ev, = fATT^IH, - SvEv, - d v E v
NH H V V V V
Iv. = S vEv - dvpv,
-
B.3 Model tak ng nto account cl mat c factor throughout all the mosqu to l fe cycle
. nn
SH, = UHNH + ErRr, +2 ф.)'Рн1 -2 ФЕн, - ‘iPi "A^-v, - dH,SH, j=1 j=1
j * j*
.n n
Eh. =2ФjlEHJ "2ФЧЕН, + ‘1 Pi -. ‘ iv "Sh ,EH, "dH ,Eh, j=1 j=1
j *1j
Ih. = Sh ,EH, -aHIH, -Ун IH, -dHIH, .nn
RH, =2ФjiRH, + aH IH -2ф1jRH, -eH,RH, -dH,RH, j=1
j*
. S
S v, = M v N v, - f A i ^-Ih, + ln( P i ( T , RH ))* S v N H
. S
E v, = fAi -^-!H, - 5v_ E v, + ln( p, ( T , RH ))* Е^ NH H V V V
I v , = 8v, E v_ + ln( p , ( T , RH ))* I v,
-
C. SEIS model: Case of Ngaoundéré
Malaria is seasonal, about 6 months per year [20], we model the transmission in Ngaounde´re´ by a SEIS model.
C.1 model w thout cl mat c factors
. nn
SH = Mh NH, + pH ^H, + ^ ^jiSH. "^ ^ijSH, - kift^XIV, - dH SH, j=1 j=1
j *j
.n n
E H , = ^ ^ ji E H , "^ ^ ij E H, + kt /iT^ Ir, - d H E H, ~ dH, E H, j = 1 j = 1
j *ij
I H, = d H, E H, - Y H, I H , - d H , I H, - p H, I H ,
.
SV, = HyNV -ftAi — IH
V V NH HV V
.
EV, = fHIH - ivEv - dyEy NH H V VV V
I V , = V^Vy, - dV, I V,
C.2 Model tak ng nto account cl mat c factors only dur ng human-mosqu to contact
S
. nn
SH, = pH,NH, + pH,IH, +^VjiSH, ^.pgSH, j=1
j Яj«
.n n
Eh, = £'h, ~£Ф.Ен, + p,(T,RH)*k^.-^ly, -HhEh, -dH Eh, j= j *i H(8)
.
.
SV, = MV NV , ~ fl®l~IH, ~dV,SV, NH
.
E V , = J A I H^ S H, ~ S V , EV , "dV, E V, NH
i
l Vt = Sy^Ey — - d V l V.
C.3 Model tak ng nto account cl mat c factor throughout all the mosqu to l fe cycle
. n n
Sh, = Ph,NH, + pH,IH, +^VjiSH, -^^'SH, -k'Pi"^1'', -dH,SH, j=1 j=i j *
.n n
EH, = £ Ф.Ен , - ^ VijEH, + ktPtV"1', -H h,Hh, -dH,EH, j = 1 j = 1
j *ij
.
I H, = 5 h , Eh , - 7 hJh , - dH, I H, - p H , 1H ,
. S
S v , = M ' N v, - J At^ I h, + ln( P i ( T , RH ))* S V NH
. S
EV = J.At -^IH - HEy + ln( p, ( T , RH ))* Ev NH H V V V
ly, = H y E y + ln( p i ( T , RH ))* 1 V
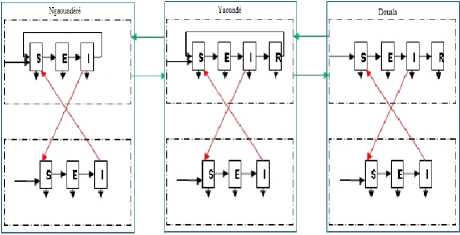
Fig.3. Representation of Douala (at the right) and Yaoundé (at the middle) and Ngaoundéré (at the left) compartments.
-
D. DEVS formal sm
The meta-population models of previous works that we have presented do not take into account the spatial and temporal heterogeneity of patches considered. Nevertheless, consideration of this important factor for modelling the dynamic transmission can lead to different models depending on the city considered. This would imply that there could be in a city, several migrations that come from several cities with different modelling. In this case, it would be important to make what we call the model coupling, which is far ignored by previous works on modelling the dynamic of malaria transmission. The geographical areas in which people live may be considered remote and scattered from each other (case of Douala and Yaounde´ cities, which are not border), the space is the considered to be discreet. To take into account the models coupling, space discretization, and also integrate the variation of environmental factors (call events) that can disrupt the model evolution at any time, we rely on DEVS (Discrete Event System Specification) formalism, developed by [26]. There are two layers DEVS formalism: atomic DEVS and coupled DEVS.
The structure of an atomic DEVS model is:
DEVS atom te= ^X , Y , S , eiext , H int , H con , X , t a} where
^ Xss the set of portsand inputt values Ythesetof portsand outputvalues Sthesetof system states e>ext the external transiiion functo)n 5 int the internal transtiunn function H con the conflict transztzon function X the output function v t a the advance time function
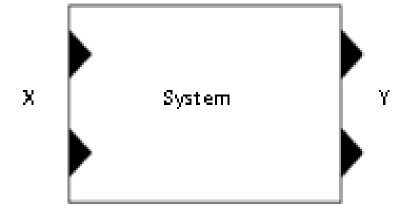
Fig.4. Representation of atomic model by DEVS.
A coupled model is defined as:
DEVS coupled= X , Y , C , EIC , EOC , IC where
^ X is the setof input ports
Ythesetof output ports
Cthelistof mod e ls that comprise thecoupled mod el
EICthe set of input links that connect the coupled mod el
EOCthe set of output links that connect components of coupled mod el v ICthe set of links that connect components together
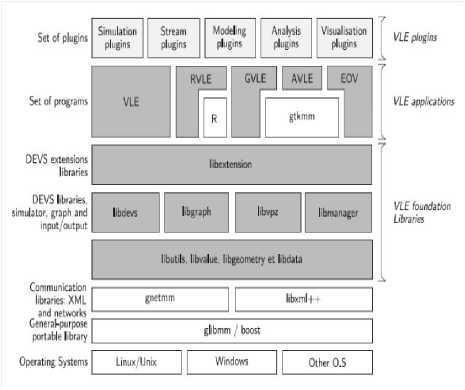
Fig.6. Representation of the VLE framework Application Programming Interface (API). Clear grey boxes are plug-in or components developed by users to extends VLE API (simulations plug-in, etc.) and white boxes are external libraries coming from the open sources projects to increase the portability (glibmm, boost, etc.) or extends VLE [27] .
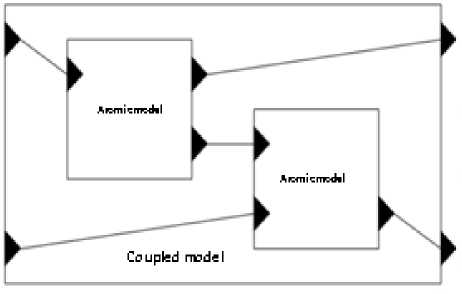
Fig.5. Representation of coupled model by DEVS.
The external transition represents the system responses to external events and the internal transition, the autonomous developments. The advance time is the time during which the model is in state S (not disruption by external events).
-
E. VLE framework
VLE is the framework that we used to implement and simulate our model. VLE is based on DEVS concept and can integrate most different programming languages into one single multi-model. So, VLE is oriented towards the integration of heterogeneous formalisms. It is written in C++ programming language. The VLE architecture is defined as follow:
GVLE is a graphical user interface. It provides tools to visually construct a hierarchy of coupled models. A modelling plug-in can be used to define and to modify the behaviour of atomic models displaying a text editor where DEVS functions can be coded. Moreover, GVLE enables the definition of experimental frames.
EOV, the Eyes Of VLE, is a graphical application which displays the values of states during simulation. EOV is a set of visualization plug-ins. A particular plugin defines the type of visualization like coloured gridded surfaces or curves for instance.
VLE is the core of the environment. The four other applications depend on VLE (that is why the name of this application is the same as the general framework). VLE implements the DEVS abstracts simulators and the extensions cited in the previous section. To perform simulations, VLE records the experimental frame generated by GVLE and then dynamically loads simulation and visualization components of EOV and finally connect them to the DEVS-Bus. The Simulation plugins simulates the behaviours of the DEVS atomic models and VLE coordinates the simulation.
AVLE (Analysis for VLE) is a graphical interface binding the experimental frame defined by GVLE and the R statistical tool [28].
RVLE (R for VLE) is a R-Package to build experimental frames, to launch the simulation and to get the results of the simulation within the R environment.
VLE has two particular types of port in addition to input and output ports in DEVS models: the initialization and state ports. Initialization ports receive initial values of parameters. State ports are connected to one or several measure objects which receive the state values under observation. After that, the measure object sent values to a specialized component [27]. VLE implements the abstract simulators of DEVS extensions. All atomic models inherit the Dynamics class to build simulation component. Dynamic’s functions that can be overloaded by the user are:
Time init();
void internalTransition(const Time& time); //represents the internal transition function defined by DEVS formalism void externalTransition(const ExternalEventList& events);
//represents the external transition function defined by DEVS
Time timeAdvance() const; //this is the advance time defined by DEVS void output(const Time& time, EventList& out) const;
//this is the output function defined by DEVS void finish();
We also have confluent transition defined as:
type confluentTransitions(const Time& time, const ExternalEventList& e) const;
That last one is called when events occur at the same time. It can be defined to choose the order of treatment for events between internal and external event. Is the conflict function defined by DEVS formalism.
-
F. Perturbation of the model by unforeseen weather (events)
Considering weather changes that may occur over time, we introduce in our model what we call events, which can be considered as weather disturbances during the year. So at time t, we can introduce a disturbance that corresponds to the values of temperature and relative humidity at the time t. The architecture of our new model becomes as shown in Fig. 7.
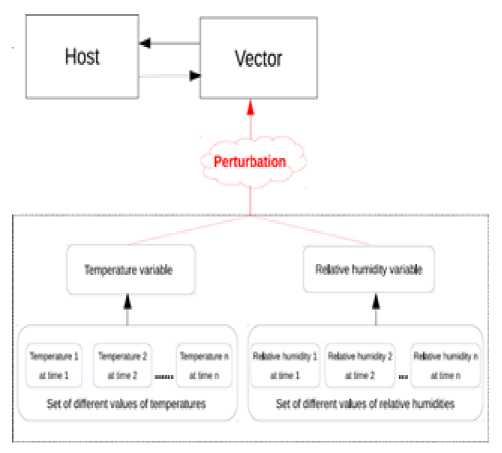
Fig.7. Architecture of our model with perturbation taken into account.
Using VLE environment, our dynamics functions used for disturbing our model are defined as:
-
{ mstate = BEFORE PERTURBATION;
return sendTime; }
Time timeAdvance() const
{ switch(mstate){ case BEFORE PERTURBATION: return sendTime; break; case
DURING PERTURBATION: return 0; break;
case BEFORE PERTURBATION: { if(nbBags == 0) { mstate= AFTER
PERTURBATION;} else {mstate = DURING PERTURBATION;} break; } case DURING PERTURBATION: { currentBag++;
{ switch(mstate){ case BEFORE PERTURBATION: { if(nbBags == 0){ vd::ExternalEvent* ee = new vd::ExternalEvent(”p”);
¿putAttributes(message);
{throw vu::ArgError(vle::fmt(( ”[%1%] Model that does not handle external events ”)) % getModelName()); } message represents the value of temperature or relative humidity to send; sendtime is the time to send the message and nbBags (default = 0) is the number of bags to wait at sendTime before sending the message.
-
IV. Simulation
As mosquitoes are usually active at night, we consider minimum daily temperatures and maximum daily relative humidity for the years 2013 and 2014; we summarize the monthly averages in Table 4.
Table 4. Annual temperatures (minimum) and relative humidities (maximum) for Douala, Yaoundé and Ngaoundéré for the years 2013 and 2014.
Source:
|
Climatic factors |
January |
February |
March |
April |
May |
June |
|
Temperature (min) of Douala |
25(2013) 24(2014) |
24(2013) 24(2014) |
24(2013) 23(2014) |
24(2013) 24(2014) |
24(2013) 24(2014) |
23(2013) 23(2014) |
|
Relative humidity (max) of Douala |
99(2013) 99(2014) |
98(2013) 97(2014) |
98(2013) 97(2014) |
98(2013) 98(2014) |
99(2013) 99(2014) |
100(2013) 99(2014) |
|
Temperature (min) of Yaounde´ |
21(2013) 20(2014) |
21(2013) 20(2014) |
20(2013) 21(2014) |
20(2013) 20(2014) |
20(2013) 20(2014) |
20(2013) 21(2014) |
|
Relative humidity (max) of Yaounde´ |
94(2013) 95(2014) |
93(2013) 95(2014) |
94(2013) 94(2014) |
94(2013) 95(2014) |
95(2013) 97(2014) |
94(2013) 96(2014) |
|
Temperature (min) of Ngaounde´re´ |
14(2013) 10(2014) |
17(2013) 12(2014) |
20(2013) 16(2014) |
20(2013) 19(2014) |
19(2013) 18(2014) |
19(2013) 18(2014) |
|
Relativehumidity (max) of Ngaounde´re´ |
58(2013) 71(2014) |
45(2013) 65(2014) |
76(2013) 77(2014) |
87(2013) 94(2014) |
93(2013) 99(2014) |
94(2013) 98(2014) |
|
Climatic factors |
July |
August |
September |
October |
November |
December |
|
Temperature (min) of Douala |
24(2013) 23(2014) |
23(2013) 22(2014) |
23(2013) 23(2014) |
23(2013) 23(2014) |
23(2013) 24(2014) |
21(2013) 24(2014) |
|
Relative humidity (max) of Douala |
100(2013) 100(2014) |
99(2013) 100(2014) |
100(2013) 100(2014) |
100(2013) 100(2014) |
99(2013) 100(2014) |
100(2013) 99(2014) |
|
Temperature (min) of Yaounde´ |
20(2013) 20(2014) |
20(2013) 20(2014) |
20(2013) 20(2014) |
20(2013) 20(2014) |
20(2013) 20(2014) |
19(2013) 20(2014) |
|
Relative humidity (max) of Yaounde´ |
94(2013) 95(2014) |
94(2013) 94(2014) |
94(2013) 97(2014) |
96(2013) 97(2014) |
96(2013) 98(2014) |
95(2013) 96(2014) |
|
Temperature (min) of Ngaounde´re´ |
17(2013) 18(2014) |
17(2013) 18(2014) |
17(2013) 17(2014) |
17(2013) 17(2014) |
14(2013) 14(2014) |
13(2013) 11(2014) |
|
Relative hu midity (max) of Ngaounde´re´ |
96(2013) 99(2014) |
98(2013) 100(2014) |
98(2013) 100(2014) |
94(2013) 99(2014) |
88(2013) 90(2014) |
82(2013) 78(2014) |
A. Migration between Douala and Yaounde´, Yaounde´ and Ngaounde´re´
According to the report on the General Census of Population and Housing in Cameroon, published in 2010 [29], NHdla = 1 907 479, NHyde = 1 817 524 and N = 262 747. We consider data of rail ”intercity” trains between Douala and Yaounde´ for the year 2014. Data collected after a survey we conducted in the Cameroon railways (Camrail) have reported an average of 496 passengers per day from Yaounde´ to Douala, and an average of 519 passengers per day from Douala to Yaounde´. Concerning the trip between Yaounde´ and Ngaounde´re´, we have an average of 788 passengers per day from Yaounde´ to Ngaounde´re´ and an average of 860 passengers per day from Ngaounde´re´ to Yaounde´. We also collected data from travel agencies by bus (Touristique voyage, Garanti Express, Buca voyage, Finexs voyage) and they show an average of 2,800
passengers per day from Douala to Yaounde´ and an average of 2,700 passagers per day from Yaounde´ to Douala.
_ 496 + 2700
So, V Yde ^ Dla = Nh
H yde
_ 519 + 2800
T Dla ^ Yde = M N H dla
788
T Yde ^ Ndere
N H yde
860
and ^ Ndere ^ Yde
N ndere
= 0.0018 = 0.18% ;
= 0.0017 = 0.17%;
= 0.00043 = 0.043%
= 0.0033 = 0.33% .
Table 5. Yaoundé.
|
Parameters |
µ Hyde |
µ Vyde |
d Hyde |
d Vyde |
b Hyde |
ε Hyde |
ωyde |
f yde |
δ Hyde |
δVyde |
α Hyde |
γ Hyde |
|
Values |
0.031 |
0.130 |
0.009 |
0.033 |
0.044 |
0.002 |
0.11 |
0.01 |
0.09 |
0.091 |
0.100 |
3.01% |
|
References |
[30] |
[31] |
[32] |
[33] |
[34] |
[31] |
[35] |
[34] |
[31] |
[31] |
[31] |
[20] |
Table 6. Douala.
|
Parameters |
µHdla |
µVdla |
dHdla |
dVdla |
b Hdla |
Ω dla |
fdla |
δ Hdla |
δ Vdla |
αHdla |
γ Hdla |
|
Values |
0.031 |
0.130 |
0.012 |
0.033 |
3.94 |
0.35 |
0.022 |
0.09 |
0.083 |
0.1 |
3.01% |
|
References |
[30] |
[31] |
[32] |
[33] |
[36] |
[35] |
[36] |
[31] |
[31] |
[31] |
[20] |
Table 7. Ngaoundéré.
|
Parameters |
µ Hnd |
µ V nd |
dHnd |
dV nd |
bHnd |
ωnd |
fnd |
δHnd |
δVnd |
ρ Hnd |
γ Hnd |
|
Values |
0.025 |
0.13 |
0.021 |
0.033 |
0.63 |
0.11 |
0.01 |
0.1 |
0.091 |
0.008 |
3.01% |
|
References |
[37] |
[31] |
[37] |
[33] |
[22] |
[35] |
[22] |
[31] |
[31] |
[31] |
[20] |
B. Analysis
We firstly compare evolution of infected and infectious Humans with the consideration of climatic factors only during Human-Mosquito contact against the consideration of climatic factors throughout the mosquito life cycle.
As we can mark (Fig. 8, Fig. 9, Fig. 10, Fig. 11, Fig. 12 and Fig. 13), there is a difference when we take into account climatic factors (temperature and relative humidity) only during human-mosquito contact to a consideration of these climatic factors throughout the mosquito life cycle. Specifically, for Douala city, when we take into account climatic factors (temperature and relative humidity) only during human-mosquito contact, the number of infected humans passed under 10 000 after 96 days and stabilizes at 0 (zero) after about 574 days and the number of infectious humans passed under 10 000 after 99 days and stabilizes at 0 (zero) after about 571 days. However, when we take into account climatic factors throughout the mosquito life cycle, we find that the number of people stabilizes around 65 000 after 321 days and the number of infectious humans stabilizes under 522 000 after 333 days.
Concerning Yaounde´ city, the consideration of climatic factors (temperature and relative humidity) throughout the mosquito life cycle highlights a number of humans infected under 20 000 after 63 days and stabilizes around 13 000 after 117 days, while the number of infectious human passed under 20,000 after 64 days and stabilizes around 10 000 after 363 days. However, take into account climatic factors only during human-mosquito contact shows a number of infected humans passed under 10 000 after 41 days and stabilizes at 0 after 347 days, while the number of infectious humans passed under 10 000 after 55 days and stabilizes at 0 after 348 days.
For Ngaounde´re´ city, the consideration of climatic factors (temperature and relative humidity) throughout the mosquito life cycle highlights a number of humans infected Oscillating between the values under 36,000 after
5 days with minima of 9 840 (respectively 9,709) at the 58 th day (respectively 403 th day) and maxima of 35 089 (respectively 32 959) at 279 th day (respectively 652 th day). The number of humans infectious Oscillates between the values under 115 000 with minima of 39 326 (respectively 41 299) at the 100 th day (respectively 438 th day) and maxima of 59 711 (respectively 114 986 and 106,866) at the 29 th day (respectively 291 th day and 668 th day). However, take into account climatic factors only during human-mosquito contact shows a number of infected humans passed under 5 000 after 24 days and stabilizes at 0 after 247 days, while the number of infectious humans passed under 5 000 after 100 days and stabilizes at 0 after 400 days.
The second point of our analysis is to compare the impact of climatic factors (temperature and relative humidity) in the context of human’s migration. We have two cases: without taking into account climatic factors and taking into account climatic factors throughout the mosquito life cycle.
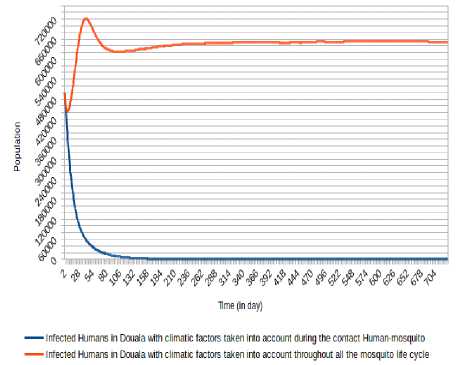
Fig.8. Comparison of evolution of infected Humans in Douala with the consideration of climatic factors only during Human- Mosquito contact against the consideration of climatic factors throughout the mosquito life cycle.
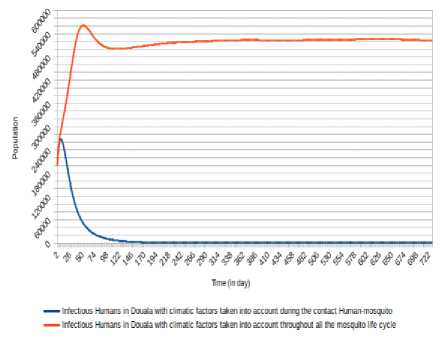
Fig.9. Comparison of evolution of infectious Humans in Douala with the consideration of climatic factors only during Human-Mosquito contact against the consideration of climatic factors throughout the mosquito life cycle.
г # # Ф^^^^^6.^/^^^^^^^^
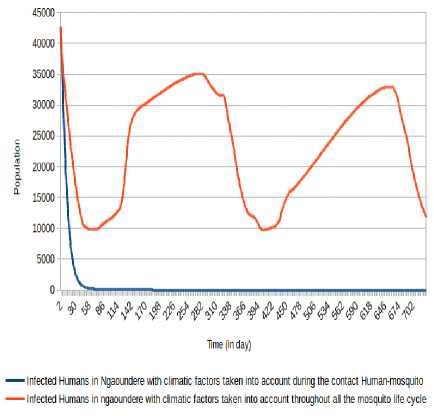
Fig.12. Comparison of evolution of infected Humans in Ngaoundéré with the consideration of climatic factors only during Human-Mosquito contact against the consideration of climatic factors throughout the mosquito life cycle.
Tme (in day)
^—Infected Humans in Yaounde with climatic factors taken into account during the contact Human-mosquito — Infected Humans in Yaounde with climatic factors taken into account throughout all the mosquito life cycle
Fig.10. Comparison of evolution of infected Humans in Yaounde´ with the consideration of climatic factors only during Human-Mosquito contact against the consideration of climatic factors throughout the mosquito life cycle.
lime (in day)
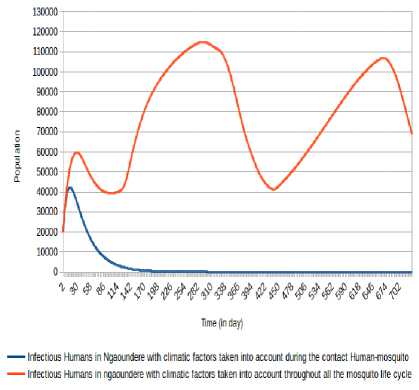
Fig.13. Comparison of evolution of infectious Humans in Ngaoundéré with the consideration of climatic factors only during Human-Mosquito contact against the consideration of climatic factors throughout the mosquito life cycle.
■ Infectious Humans in Yaounde with climatic factors taken into account during the contact Human-mosquito Infectious Humans in Yaounde with climatic factors taken into account throughout all the mosquito life cycle
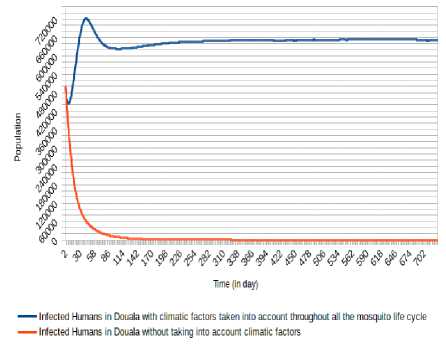
Fig.14. Comparison of evolution of infected Humans in Douala without taking into account climatic factors and taking into account climatic factors throughout the mosquito life cycle.
Fig.11. Comparison of evolution of infectious Humans in Yaoundé with the consideration of climatic factors only during Human-Mosquito contact against the consideration of climatic factors throughout the mosquito life cycle.
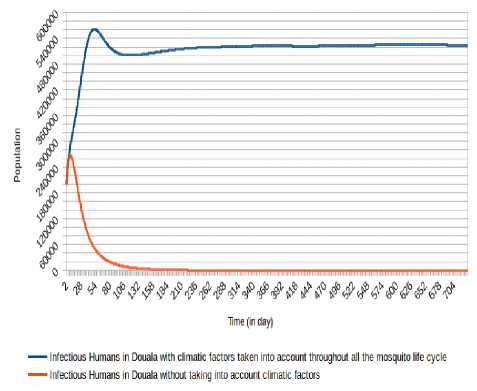
Fig.15. Comparison of evolution of infectious Humans in Douala without taking into account climatic factors and taking into account climatic factors throughout the mosquito life cycle.
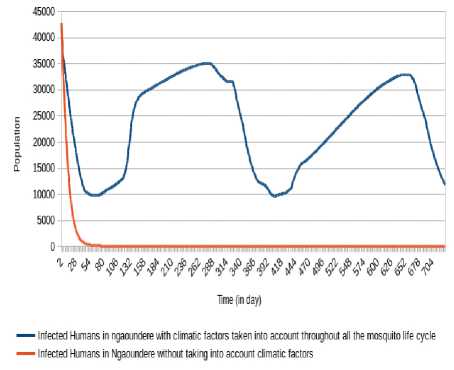
Fig.18. Comparison of evolution of infected Humans in Ngaoundéré without taking into account climatic factors and taking into account climatic factors throughout the mosquito life cycle.
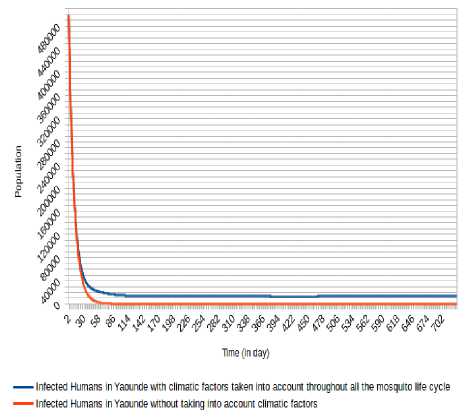
Fig.16. Comparison of evolution of infected Humans in Yaoundé without taking into account climatic factors and taking into account climatic factors throughout the mosquito life cycle.
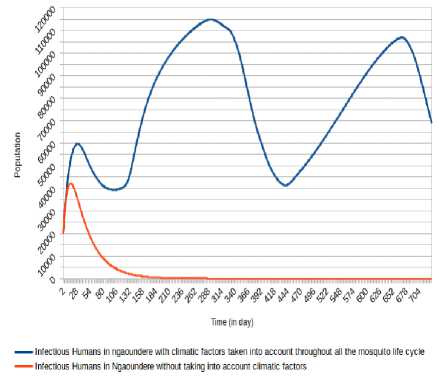
Fig.19. Comparison of evolution of infectious Humans in Ngaoundéré without taking into account climatic factors and taking into account climatic factors throughout the mosquito life cycle.
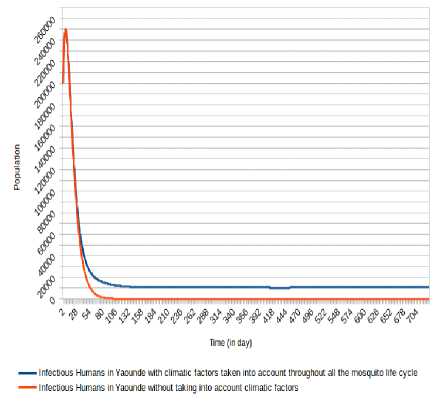
Fig.17. Comparison of evolution of infectious Humans in Yaoundé without taking into account climatic factors and taking into account climatic factors throughout the mosquito life cycle.
We can observe (Fig. 15, Fig. 13, Fig. 16, Fig. 17, Fig. 18 and Fig. 19) that the non-consideration of climatic factors in Douala city shows that the number of infected humans passed under 20 000 after 74 days and stabilizes at 0 (zero) after about 605 days and the number of infectious humans passed under 20 000 after 78 days and stabilizes at 0 (zero) after about 601 days. The inclusion of that climatic factors in Douala city shows a number of infected humans stabilizes around 65 000 after 321 days and the number of infectious humans stabilizes under 522 000 after 333 days.
Concerning Yaounde´ city, the non-consideration of climatic factors in Douala city shows that the number of infected humans passed under 10 000 after 41 days and stabilizes at 0 after 368 days, while the number of infectious humans passed under 10 000 after 55 days and stabilizes at 0 after 366 days. The inclusion of that climatic factors shows a number of infected humans under 20 000 after 63 days and stabilizes around 13 000 after 117 days, while the number of infectious human passed under 20 000 after 64 days and stabilizes around 10 000 after 363 days.
For Ngaounde´re´ city, the inclusion of that climatic factors highlights a number of humans infected Oscillating between the values under 36 000 after 5 days with minima of 9 840 (respectively 9 709) at the 58 th day (respectively 403 th day) and maxima of 35 089
(respectively 32 959) at 279 th day (respectively 652 th day). The number of humans infectious Oscillates between the values under 115,000 with minima of 39 326 (respectively 41 299) at the 100 th day (respectively 438 th day) and maxima of 59 711 (respectively 114 986 and 106 866) at the 29 th day (respectively 291 th day and 668 th day). The non-consideration of climatic factors shows that the number of infected humans passed under 5 000 after 24 days and stabilizes at 0 after 249 days, while the number of infectious humans passed under 5 000 after 100 days and stabilizes at 0 after 401 days.
-
V. Conclusion
We have analysed the impact of climatic factors in malaria transmission taking into account migration between Douala, Yaounde´ and Ngaounde´re´, three cities of Cameroon country. We showed how variations of climatic factors such as temperature and relative humidity affect the malaria spread by proposing and implementing a meta-population model of malaria that evolves in space and time and that takes into account climatic factors and the humans migration between Douala and Yaounde´, Yaounde´ and Ngaounde´re´. Our model incorporates the dynamic of the malaria spread inside a population between sick and healthy individuals. Results show difference between human evolution when we consider in the context of migration, climatic factors or not. More, there is a difference of results, specifically inside infected and infectious humans with the consideration of climatic factors throughout the mosquito life cycle and during only the contact Human-Mosquito. We plan to perform by coupling our model with a model where average number of contacts between susceptible humans and infectious mosquitoes ( b i ) and average number of contacts between susceptible mosquitoes and infectious humans ( f i* ω i ) will be both dynamic (evaluate by simulation) and evolve with each step of time.
Acknowledgement
This study has been supported by the PDIMSC of UPMC-IRD (Universite´ Pierre et Marie Curie - Institut de Recherche pour le De´veloppement), the Centre Pasteur of Cameroon and the Cameroon railways (Camrail).
References Meta-Population Modelling and Simulation of the Dynamic of Malaria Transmission with Influence of Climatic Factors
- R. S. Afrique, «Cartographie de la lutte contre le paludisme au cameroun,» 2008.
- R. Ronald, «The prevention of malaria,» John Murray, 1911.
- Keeling Matt J, Rohanni Pejman, «Modeling infectious diseases in humans and animals,» Princeton University Press, 2008.
- Mishra Bimal Kumar, Tyagi Indu, «Defending against malicious threats in wireless Sensor network: A mathematical model,» International Journal of Information Technology and Computer Science (IJITCS), vol. 6, pp. 12-19, 2014.
- J. M. M. Ondo, «Les aspects spatiaux dans la modélisation en épidémiologie,» Université de Grenoble, 2012.
- T. Berge, «Etude de quelques modèles épidémiologiques de métapopulations: application au paludisme et à la tuberculose,» Université de Lorraine, 2012.
- Lourenço Jose, Recker Mario, «Natural, persistent oscillations in a spatial multi-strain disease system with application to dengue,» PLoS Comput Biol, vol. 9, 2013.
- Gaaboub IA, El-Sawaf SK, El-Latif MA, «Effect of different relative humidities and temperatures on egg-production and longevity of adults of anopheles (myzomyia) pharoensis theob. 1,» Zeitschrift Fur Angewandte Entomologie, vol. 67, pp. 88-94, 1971.
- B. M. Nabie, «Studies on the development and survival of Anopheles gambiae sensu stricto at various temperatures and relative humidities,» Durham University, 2001.
- Liu Kun, Tsujimoto Hitoshi, Cha Sung-Jae, Agre Peter, Rasgon Jason L, «Aquaporin water channel agaqp1 in the malaria vector mosquito anopheles gambiae during blood feeding and humidity adaptation,» Proceedings of the National Academy of Sciences, vol. 108, pp. 6062-6066, 2011.
- Wang Mei-Hui, Marinotti Osvaldo, Vardo-Zalik Anne, Boparai Rajni, Yan Guiyun, «Genome-wide transcriptional analysis of genes associated with acute desiccation stress in Anopheles gambiae,» PLoS one, vol. 6, 2011.
- Churcher Thomas S, Trape Jean-François, Cohuet Anna, «Human-to-mosquito transmission efficiency increases as malaria is controlled,» Nature Communications, vol. 6, 2015.
- Pascual, Mercedes and Cazelles Bernard, Bouma MJ, Chaves LF, Koelle K, «Shifting patterns: malaria dynamics and rainfall variability in an African highland,» Proceedings of the Royal Society of London B: Biological Science, vol. 275, pp. 123-132, 2008.
- Yamana Teresa K, Eltahir Elfatih AB, «Incorporating the effects of humidity in a mechanistic model of Anopheles gambiae mosquito population dynamics in the Sahel region of Africa,» Parasit Vectors, vol. 6, p. 235, 2013.
- Gray Emilie M, Bradley Timothy J, «Physiology of desiccation resistance in Anopheles gambiae and Anopheles arabiensis,» The American journal of tropical medicine and hygiene, vol. 73, pp. 553-559, 2005.
- Gray Emilie M, Rocca Kyle AC, Costantini Carlo, Besansky Nora J, «Inversion 2La is associated with enhanced desiccation resistance in Anopheles gambiae,» Malaria journal, vol. 8, pp. 1-12, 2009.
- Martens WJ, Niessen Louis W, Rotmans Jan, Jetten Theo H, McMichael Anthony J, «Potential impact of global climate change on malaria risk,» Environmental health perspectives, vol. 103, p. 458, 1995.
- M. WJ, «Health impacts of climate change and ozone depletion: an ecoepidemiologic modeling approach,» Environmental Health Perspectives, vol. 106, p. 241, 1998.
- Hervy JP, Le Goff G, Geoffroy JP, Hervé L, Manga L, Brunhes J, «Les anophèles de la région Afro-tropicale. Logiciel d'identification et d'enseignement,» ORSTOM édition. série Didactique, 1998.
- M. d. l. S. publique, «Plan Stratégique National de Lutte contre le Paludisme au Cameroun 2007-2010,» Cameroun (in French, English), 2007.
- Antonio-Nkondjio Christophe, Fossog Billy Tene, Ndo Cyrille, Djantio Benjamin Menze, Togouet Serge Zebaze, Awono-Ambene Parfait, Costantini Carlo, Wondji Charles S, Ranson Hilary, «Anopheles gambiae distribution and insecticide resistance in the cities of Douala and Yaounde (Cameroon): influence of urban agriculture and pollution,» malaria Journal, vol. 10, p. 1, 2011.
- J. Messi, «Dynamics of malaria transmission in a forest-savannah transition zone, bini-dang, ngaoundere, cameroon,» International Journal of tropical Medecine, vol. 1, pp. 77-80, 2006.
- Arino Julien, Van Den Driessche Pauline, «The basic reproduction number in a multi-city compartmental epidemic model,» chez Positive Systems, Springer, 2003, pp. 135-142.
- Parham Paul E, Pople Diane, Christiansen-Jucht Céline, Lindsay Steve, Hinsley Wes, Michael Edwin, «Modeling the role of environmental variables on the population dynamics of the malaria vector Anopheles gambiae sensu stricto,» Malaria Journal, vol. 11, pp. 271-283, 2012.
- Lunde Torleif Markussen, Bayoh Mohamed Nabie, Lindtj{o}rn, Bernt, «How malaria models relate temperature to malaria transmission,» Parasit Vectors, vol. 6, pp. 1-10, 2013.
- Z. BP, «Theory of modeling and simulation,» Inc., New York, NY, 1976.
- Quesnel Gauthier, Duboz Raphael, Ramat, Eric, «The Virtual Laboratory Environment--An operational framework for multi-modelling, simulation and analysis of complex dynamical systems,» Simulation modelling Practice and Theory, vol. 17, pp. 641-653, 2009.
- T. R. Core, R: A language and environment for statistical computing. R Foundation for Statistical Computing, Vienna: ISBN 3-900051-07-0, 2014.
- B. d. R. e. d. E. d. Population, «Rapport de présentation des résultats définitifs du 3eme rgph au cameroun,» 2005.
- Macro, Enquête Démographique et de Santé Cameroun 2004, Institut National de la Statistique, Ministère de la Planification, de la Programmation du Développement de l'Aménagement du territoire, 2005.
- Z. Pascal, «Modélisation mathématique de la dynamique de la transmission du paludisme,» Université de Ouagadougou, 2009.
- M. Guy, «Douala: ville principale du Cameroun,» 1981.
- Chiyaka C, Tchuenche Jean M, Garira W, Dube S, «A mathematical analysis of the effects of control strategies on the transmission dynamics of malaria,» Applied Mathematics and Computation, vol. 195, pp. 641-662, 2008.
- Carnevale Pierre, Robert Vincent, Le Goff Gilbert, Fondjo Etienne, Manga Lucien, Akogbeto Martin, Chippaux Jean-Philippe, Mouchet Jean, «Données entomologiques sur le paludisme urbain en Afrique tropicale,» Cahiers d'études et de recherches francophones/Santé, vol. 3, pp. 239-245, 1993.
- C. J. ESSONG, «Detection of falciparum malarial forms in naturally infected anophelines in Cameroon using a fluorescent anti-25-kD monoclonal antibody,» Am. J. Trop. Med. Hyg, vol. 52, pp. 366-369, 1995.
- Akono P Ntonga, Tonga C, Mbida JA Mbida, Hondt OE Ngo, Ambene P Awono, Ndo C, Magne G Tamdem, Peka MF, Ngaha R, Lehman LG, «Anopheles gambiae, vecteur majeur du paludisme à Logbessou, zone péri-urbaine de Douala (Cameroun),» Bulletin de la Société de pathologie exotique, vol. 108, pp. 360-368, 2015.
- M. J, «L'école et les sociétés traditionnelles au Cameroun septentrional,» Cahiers ORSTOM: Sciences humaines, vol. 8, pp. 295-335, 1971.
