Method for determination of cyber threats based on machine learning for real-time information system

Author: Volodymyr Tolubko, Viktor Vyshnivskyi, Vadym Mukhin, Halyna Haidur, Nadiia Dovzhenko, Oleh Ilin, Volodymyr Vasylenko
Journal: International Journal of Intelligent Systems and Applications @ijisa
Article in issue: 8 vol.10, 2018.
Free access
This work is about the definition of cyber threats in the information system. The cyber threats lead to significant loss of network resources and cause the system disability as a whole. Detecting countermeasures in certain threats can reduce the impact on the system by changing the topology of the network in advance. Consequently, the interruption of a cyberattack forces the intruders to seek for alternative ways to damage the system. The most important task in the information system work is the state of network equipment monitoring. Also it’s the support of the network infrastructure in working order. The purpose of the work is to develop a method for detecting cyber threats for the information system. The system can independently detect cyber threats and develop countermeasures against them. The main feature of the counteractions is to protect network nodes from compromising. To ensure the functional stability, the most important issues are providing safety metrics. This technique allows to increase the functional stability of the system, which works in real time.
Method, cybersecurity, threat, countermeasure, graph, algorithm
Short address: https://sciup.org/15016513
IDR: 15016513 | DOI: 10.5815/ijisa.2018.08.02
Text of the scientific article Method for determination of cyber threats based on machine learning for real-time information system
Published Online August 2018 in MECS
The problem of ensuring the security of information from internal and external factors influencing the information network is very relevant today. Cyber threats lead to the loss of information. Failure of the equipment lead to significant material and moral damage that is inflicted on the network owner [1- 3].
The chaotic and in some cases uncontrolled growth of subscribers, increasing volumes of stored and transmitted information, geographically distributed network leading to the potential number of intentional and unintentional violations of information security. Actually, the possible links or links vulnerability to unauthorized the access to the network for the purpose of abuse network and counterfeit the software can damage the network in general.
Nowadays, the cybersecurity specialists often use many different concepts for the definition of information security systems in order to process and transmit the information. This is the protection of information in automated telecommunication systems. However, nobody solves this problem entirely, that would ensure the functional stability of the network.
Let's examine in more detail what needs to be understood under the definition of the information system:
-
- an automated system is an organizational and technical system. It implements the technology of processing information using the software tools;
-
- information and telecommunication system. This is a set of systems that act as a unit in the process of processing information.
The general structure of a system consists of next components:
-
- server equipment (the computers with increased performance and technical features, intended to provide one or more specific services, such as email, databases, IP telephony, file storage, etc.);
-
- data transmission medium (telephone cables, twisted pair, fiber optic lines, wireless data channels (Wi-Fi, WiMax, Bluetooth);
-
- active network equipment (switches, routers, modems, wireless access points, telephony);
-
- security devices (firewalls, intrusion detection/ warning systems, etc.);
-
- automated workplaces for employees. These are stationary computers, laptops, mobile devices and other gadgets.
There may be security risks when building up an information system. The time interval from the moment the possibility of using a weak spot and before the elimination of an existing hole is called a window of the danger. It’s associated with location of the vulnerables [46].
There are windows of danger, that’s why successful attacks on the information system are possible. As the vulnerable places and the means of their use appear constantly, then it mean following: firstly, almost always there are windows of danger, and secondly, the tracking of such windows should be done continuously [7 – 9].
The general aim of the work is to develop a method for detecting cyber threats in the information system and evaluate the probability of such study to produce the countermeasures. It will also allow the network to store its functional properties and the resources for the network owners.
-
II. Methodology for Detecting the Threat of Information Security
A threat is a potentially possible event, action, process or phenomenon that may cause damage to anyone's interests. Accordingly, the threat of information security is a potentially possible event, process or phenomenon that impact on information may directly or indirectly lead to a breach of the confidentiality, integrity or availability of this information. It is also an opportunity to influence the components of the information system (i.e. causing damage to assets of an organization), which leads to their loss, destruction or malfunctioning, thus damaging the interests of the subjects of information relations. Most often, the threat is caused by the presence of the weaknesses in the information system. In other words, the vulnerability is called a weakness in the information assets or in the protection of information systems, which makes the realization of a certain threat possible.
The most important task in the information system work is the state of network equipment monitoring. Also it’s the support of the network infrastructure in working order.
Stable and uninterrupted work of the enterprise network is a guarantee of the successful operation of the business process, while even minimal simplicity means loss of profit and the reputation costs [10 – 12].
To solve these problems, the tools for detecting anomalies in network traffic are needed.
An anomaly of network traffic can affect network performance. It's worth noting that anomalies may not always be caused by malicious activity (for example, DDoS attack, port scan attack, viral activity, etc.) They can often be caused by software changes.
Before determining the anomaly, it is necessary to understand what’s consider as a normal state. The state of the system is considered as a normal when it performs all functions assigned to it.
Accordingly, the anomaly is a state where the behavior of the system does not correspond to the well-established characteristics of normal behavior [12]. The anomalies detecting is an attempt to find a template that does not meet the expected standard behavior.
There is an undeniable importance of the problem of the anomalies detecting. It is due to the fact that anomalies can seriously affect the whole environment, especially in place where it appeared. For example, in computer networks. An abnormal behavior of traffic can mean that a computer infected with a virus which sends the important information to an unauthorized computer.
In information networks, anormalities can be caused by various factors. Including:
-
- malfunction of network equipment;
-
- accidental or intentional actions by legitimate users;
-
- incorrect user actions due to low qualification;
-
- inappropriate application work;
-
- errors in the program code;
-
- the actions of the intruders (virus attack);
-
- qualitative changes in software composition, etc.
The vulnerabilities for a communication channel can appear from a variety of components, such as virtual machines, servers, clouds, and connecting to the physical network [13,14]. The possible vulnerabilities of channel level of the information system will be described below.
The channel level attacks suggest that an attacker is on a local network. In addition, there is some sort of intermediary that assists in the execution of attacks, deliberately or unintentionally.
The attacker's task is to gain access to certain resources, information, or disturb the normal operation of the system [15].
The problem of security at the channel level is as follows: the attacker can cross over the means for the protection on higher levels after breaking the network.
The most common channel level attacks are presented below.
-
- ARP-spoofing (ARP-poisoning). It’s a network attack technique that is used predominantly in Ethernet. It is also can appear in the networks which uses the ARP protocol;
-
- MAC-spoofing. It’s channel level attack when the network card changes the MAC address. This forces the switch to send packages that he could not see before on the port to which the attacker was connected;
-
- Overflow of the switching table. The attack is based on the fact that the switching table has a limited size. After filling in the table, the switch can no longer explore the new MAC addresses. The equipment begins to work as a hub, and sends traffic to all ports;
-
- Attacks on DHCP. This may be a substitution of the DHCP server on the network. The attacker may assign additional DHCP settings, such as the default gateway. Or the DHCP starvation attack that forces the DHCP server to send all existing addresses to the attacker;
-
- VLAN hopping - unauthorized access to VLAN;
-
- STP attacks - sending messages to modify the current STP topology.
The system must solve the tasks for counter the main threats to information security:
-
1) users access control to the resources of the information system;
-
2) protection of all data transmitted through communication channels;
-
3) registration, collection, storage, processing and delivery of information about all events occurring in the system and related to ensuring its safety;
-
4) monitoring of user's work and prompt notification of unauthorized access attempts;
-
5) protection of the functioning environment of the software from uncontrolled introduction into the system of potentially dangerous programs;
-
6) provision of means for blocking the spread of malware;
-
7) ensuring the availability of information resources by backing up data;
-
8) control of the integrity of system security resources.
Nowadays, there is a variety of methods for detecting threats, which are more clearly represented on fig.1
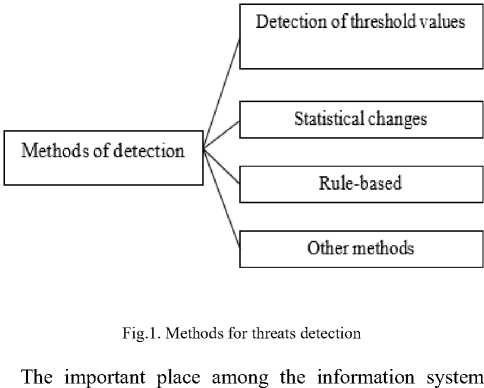
tools, that detect the network threats, is occupied by an intrusion detection system. The invasion can be both external and internal. To counter intrusion and to protect the network infrastructure, the intrusion detection system provides a mechanism for collecting and analyzing data from a network or from a particular computer.
For intellectual information, will develop a method for detecting the cyber threats, which is logically divided into the following modules: traffic collection and statistics generation module, training module, cyber threats detection module, and alert module.
Stages of the cyber threats detection method shown in Fig. 2.
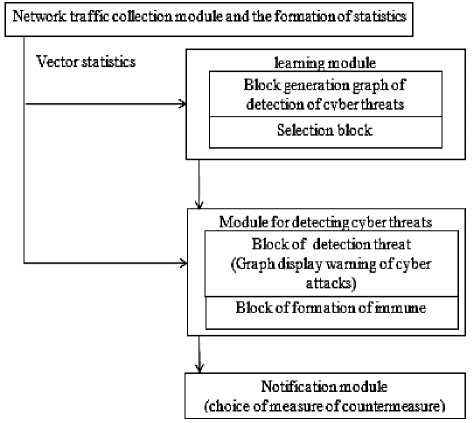
Fig.2. Model of detecting cyber threats to the information network
It is planned that this method will be monitored separately for each application-level protocol. For example, to control HTTP traffic, only data related to the web server will be used. In the same way, the data of the mail servers will be used for SMTP control.
Vector includes 12 coordinates:
-
- the number of incoming/outgoing IP, TCP, UDP packets;
-
- the number of unauthorized UDP;
-
- the number of completed UDP requests;
-
- the number of incomplete UDP requests;
-
- the number of incomplete UDP requests that expired the time-out;
-
- the number of TCP port polls;
-
- the number of TCP port permissions allowed;
-
- the number of TCP connections in the state of installation;
-
- the number of TCP connections in the open state;
-
- the number of TCP connections in the closing state.
The module for collecting traffic and generating statistics intercepts all traffic passing through the network node, which has a system for detecting the cyber threats. It allocates certain signs in it, counts on these features statistics for a certain period, and presents the collected statistics in the form of a vector.
These traffic parameters of a network will be used in the future to detect the cyber threats. The main task of the training module is to build a graph of the cyber threats detection (CTDG). This graph collects the information about all known vulnerabilities in the intelligent information network and the connection information.
This gives a complete picture of the current situation in the field of cyber security. Due to this, there is an opportunity to predict possible cyber threats and attacks by determining the interdependence of the detected events. If an event is recognized as a potential cyberattack, then it may be possible to apply the specific measures in order to mitigate its effects or take proper measures to prevent. Therefore, the main goal of the CTDG is to describe the possible cyberattacks and their influence on the network nodes.
The module of training is divided into the following blocks:
-
- block of training (compilation of the CTDG);
-
- block of selection.
The Cyberattack Alert Graph (CAG) display is used for the cyber-threat detection module, which is a set of vertices that represent the vulnerabilities and their use. As a result, there are existing ways of cyberattacks distribution inside the network recorded by the model of cyber threats detection.
In the cyber threat notification module, a choice of countermeasures is made for a scenario for detecting cyber threats. In order to make decisions about the necessary type and level of protection based on the information of diverse sources in the conditions of dynamic change in the goals of intelligent information management, the algorithm for choosing a countermeasure has been improved (Fig. 3).
When vulnerabilities are detected or some nodes are identified as suspicious, the according countermeasures can be taken to limit the attacker's ability.
The purpose of countermeasures is to protect network nodes from being compromised.
-
III. Craph of Detection of Cyber Threats (GDC)
The GDC must provide information on all known vulnerabilities in the system and connection information. We can get a full picture of the current situation in the field of cyber defense IS, where we can predict possible cyber threats and attacks by correlating detected events.
If an event is recognized as a possible attack, then it is possible to apply specific measures to mitigate the effects of a cyberattack or take measures to prevent this event.
The graph for detecting cyber threats is described by the following expression G gtdc = (V, E) where V is the set of vertices of the cyberattack graph, E is the set of directed edges connecting the vertices of the CTDG.
The peaks of the graph cyberattack can be presented by three types (Fig. 3):
Vvm - nodes of vulnerability mapping;
Vruv - nodes of the result of the use of vulnerability;
Visg - nodes of the initial stage of the CTDG.
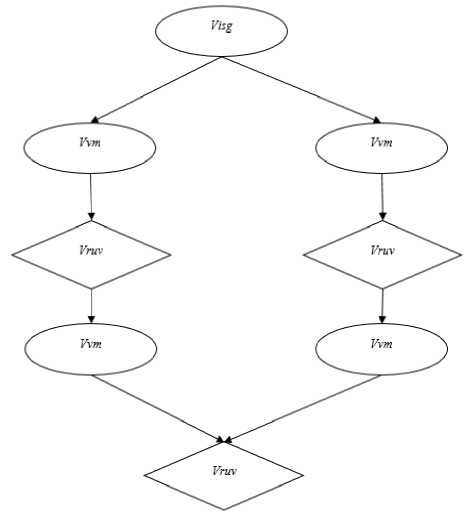
Fig.3. Tops of cyber threats detection
The set of vertices of the CTDG have V indicates the potential vulnerabilities and is defined as follows:
V = Vvm ∪ Vruv ∪ Visg . (1)
The set of edges е ∈ Epre ⊆ Vvm × Vruv reflects the fact that Vvm must be executed in order to achieve Vruv . The edge е ∈ Epost ⊆ Vruv × Vvm means that Vvm must be obtained so that the Vruv is executed:
E = E pre ∪ E post (2)
-
IV. The Cyberattack Alert Graph (CAG)
The cyberattack alert graph (CAG) represents a set of vertices, which specifies the vulnerabilities. Also this graph of vertices reflects the use of the vulnerabilities. CAG contains a set of oriented ribs, which form the vertices of the set of possible ways of passing the cyberattack, according to the time stamps.
This generates appropriate alerts on network traffic in the nodes of the intelligent information network. As a result, will get a class of alerts that indicates possible cyber threats in the appropriate node.
The cyberattack graph can be described by the following expression Gcag= (A, E, R).
Set A represents a set of all alerts. The alert а ∈ A is a data structure that includes the IP address of the sender, the IP address of the recipient, the type of alert, and the time stamp. All messages are tied up into two vertices ( Vvm, Vruv) inside the CAG. This is due to the using of the map (a) function, which shows the nodes of the route: map (a):
a → {( Vvm ; Vruv )|( asource ∈ Vvm node ) ∧ ( aalarm IP ∈ Vruv node ) ∧ ( aalarm = Vvm vuln )}, (3)
where Vvm – top, which reflects the vulnerability; Vruv -top, which reflects the result of vulnerability; a source –alert with IP source address; Vvm node – top that corresponds to a specific node in the information network; a alarm IP – alert with IP address of the destination node, Vruv node – top, which corresponds to a specific node in the information network related to Vvm vuln ; Vvm vuln – vulnerability in the node which is being considered.
Directed edges E represent a correlation between two alerts (a,a'). Of course , in the case where the criteria don’t exceed the threshold values:
-
( a h< a’h ) ∧ ( a’h - ah< threshold value ), (4)
a h – time stamp that indicates the previous node, a’ h – time stamp that indicates the next node.
∃(Vvm, Vruv) ∈ Epre : (aalarm ∈ Vvm node ∧ asource ∈ Vruv node) (5)
The cyberattack alert graph contain a set of cyberattack paths – R. In that time, route S і ⊂ P represents a set of related alerts in the order of receipt in the system. It belongs to the same scenario of the cyberattack.
Each ordered pair ( а,а’ ) in CAG is compared to two adjacent vertices in the CTDG with the difference of the time stamps of the two alerts, within a predetermined limit value. CAG indicates the dependence of notifications on time. This graph allows to find alerts that are related to the same scenario of a cyberattack by alerts searching. (Fig. 4).
The set of routes passing attack in the column detection warning of cyberattacks are used to store all paths from the initial node graph to the last node in the CTDG.
Each path of the S і ⊂ P is a notification. After the cyberattack detection the CTDG updates. All possible cyber threats will be record to further memorizing. For this technique, an algorithm for displaying cyberattack notifications is developed (Fig.4).
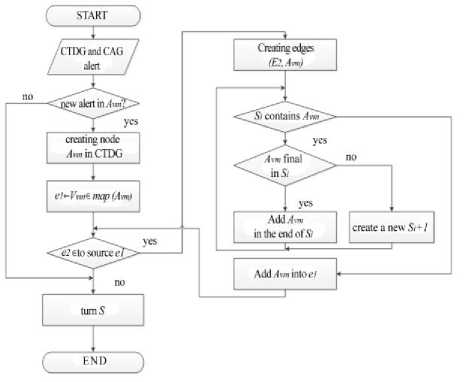
Fig.4. Algorithm for displaying cyberattack notices
The CTDG (see Fig.4) finds and returns one or more S i paths to the database for each new alert. Each alert that will be received from the system will be attached to the CAG. Then this graph provides alert which doesn’t exist there yet.
The map (a) function contains the top that belongs to the new alert. For a new peak in the CTDG, alerts that associate with its vertices of the Vvm type, combine with new alerts. This allows you to create a new set of alerts that belong to the Si route in the CAG or create a new S i + 1 in S i route in S i .
At the end of the algorithm, it is necessary to add a network identifier to the received alert, which will allow this algorithm to pass much faster. After completion of the algorithm, the route of the cyberattack is added to the CAG.
-
V. The Choise of Countermeasures
It is necessary to develop a method for selecting countermeasures after the path of the cyberattack has been determined. To do this, an alert module must be used. It selects countermeasures for the developing cyberattack detection graph and the display of the cyberattack alert. For making decisions on the type and level of protection it’s necessary to management algorithm for selecting a countermeasure. When vulnerabilities are detected or when some nodes of the network are identified as suspicious, countermeasures can be taken to limit the attacker's ability. The purpose of countermeasures is to protect network nodes from compromising.
To ensure the functional stability, the most important issues are providing safety metrics. They are required in carrying out scientific tasks. In order to assess the state of the risk of network security and the specific network configuration, must use the security indicators in the cyberattack line to measure the risk.
The graph of the definition of a cyberattack contains information about possible vulnerabilities of the system. A priori probability will be determined as the probability of the source of the cyberattack for the nodes of the initial stage of the cyberattack where Visg ⊆ Vrum .
The GV indicator uses for indication the probability of the priori risk of a node on the initial stage of the Visg graph display of the cyberattack. It’s locate in the national vulnerability database.
The countermeasure database can store a large number of countermeasures. It’s can be used in the intelligent information network, depending on the available methods. Also it can be used to implement countermeasures in the IN. The optimal countermeasure are choosing in the main task. Moreover, that is necessary for calculate the minimum value of cyberattacks - MIN (intrusiveness, cost) and MAX (benefit).
Thus, it is important to choose a countermeasure, which corresponds to the smallest value of the complex indicator of the choice of a countermeasure. It is proposed to use a comprehensive index of the choice of countermeasure Y to select the necessary countermeasure and to achieve the goal:
Y= [( k 1 I )+( k 2 B )] /n, (6)
where k 1 , k 2 – specifications of the impact of the countermeasures; I – intrusiveness, shows the magnitude of the negative effect, which leads to countermeasures in accordance with the "Level of Service Agreement"; B – cost indicating; n – coefficient.
For the vulnerability assessment of the nodes in the information system, the index of functional stability can be used.
F ІS =(Ov+O vn )/2, (7)
where O v – the vulnerability assessment of the nodes; Ovn – the vulnerability assessment of the nodes’ use.
The vulnerability assessment of a node is an average baseline score for a set of the vulnerabilities in the node.
Оv = min {10, ln Σ e Н ( v ) }, (8)
where Н ( v ) – the average score for each vulnerability of a particular node of the system; v – the particular node.
The vulnerability assessment of the nodes’ use
O vn = (min {10, ln Σ e J ( v ) })( N ( v )/ Z ( v )), (9)
where J(v) – the average point of the vulnerability use with each vulnerability of a specific node in the information system; N(v) – the number of services provided by the node; Z(v) – the number of services that can be provided to the node.
Accordingly, Ov takes into account the basic estimates of all vulnerabilities on the node. Each evaluation takes into account the extent of the attacker's capabilities, as well as the magnitude of the damage it may cause.
An exponential sum of basic indicators allows to estimate the deviation of their values on a logarithmic scale based on the number of vulnerabilities. High F ІS score means that the vulnerabilities have a large number of possible ways to reach the goal of an intruder.
Thus, the index of functional stability of the F ІS is a quantitative estimate of the level of stability of each node.
An algorithm for choosing a countermeasure (Fig. 5) was improved in order to select the optimal countermeasure in the proposed methodology. On the basis of obtained data from the CAG and a database of known threats it’s important to limit the possibility of the attacker.
As a result of using the advanced method of detecting cyber threats in the intelligent information network, it would be possible to separate the path of cyberattacking, which would turn the forces of the attacker to seek alternative ways to achieve his goal.
An experiment has been conducted in a private cloud environment to confirm the effectiveness of the developed method.
However, the purpose of the attacker is not always to compromise global services or resources. Sometimes it may be the virtual machines. They can compromise the private network. Conducting an experiment, in this case, was particularly expedient.
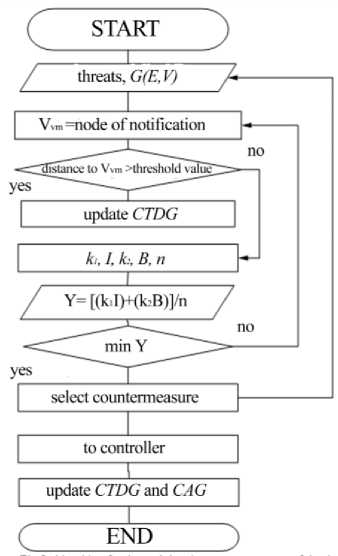
Fig.5. Algorithm for determining the countermeasures of the threat
Below is a chart of the complex index of the choice of counter-measures Y (Fig. 6). It reflects the magnitude of the negative impact.
Also, this graph reflects the costs that are needed to implement countermeasures in terms of resources and operational complexity. The higher the score, the higher the cost. These indicators together represent a comprehensive indicator of the choice of countermeasure Y. It should be noted that countermeasures with a high complex indicator correspond to more serious countermeasures. They are able to change almost the entire virtual cloud environment infrastructure.
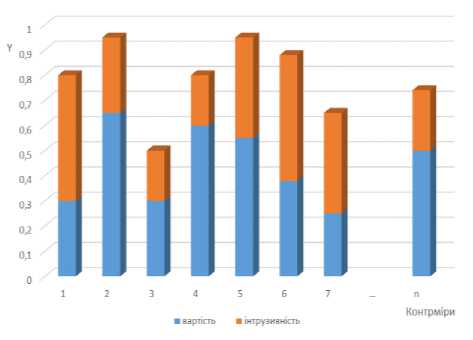
Fig.6. Complex indicator of the countermeasures choice
-
VI. Conclusions
The proposed method allows the network layer of the OSI model to do network topology rearrangement in order to interrupt the path of a cyberattack. This is done by an IS controller. Inside this controller the data flow table can be modified at each node so that to change the network topology in general.
Using the reconfiguration of the nodes of the intelligent information network, the OSI model application level will experience a minimal impact from the changes at the lower level. This approach is only possible with the use of a specialized software in switches and IP routers. Additionally, another important condition for the approach is the possibility of using the concept of software-configured networks with automated redirection for dynamic networks using the protocol Openflow.
The offered method gives the opportunity to define the various options for the decisions about the necessary kind and level of protection. It's also can be provided on the basis of the information from heterogeneous sources in conditions of dynamic change of the aims of management in information system in real time.
References Method for determination of cyber threats based on machine learning for real-time information system
- Abebe Tesfahun, Bhaskari D. Lalitha. Effective hybrid intrusion detection system: A layered approach. International Journal of Computer Network and Information Security (IJCNIS). 2015, Vol. 7, N 3. P. 35–41. DOI: 10.5815/ijcnis.2015.03.05.
- Bhuyan M.H., Bhattacharyya D.K., Kalita J.K. Network anomaly detection: Methods, systems and tools. IEEE Communications Surveys & Tutorials. 2014. Vol. 16, N 1. P. 303–336.
- Shi, C. Beard, and K. Mitchell, “Analytical Models for Understanding Misbehavior and MAC Friendliness in CSMA Networks,” Performance Evaluation, Vol. 66 (9–10), 2009, pp. 469. DOI:10.1016/j.peva.2009.02.002.
- V.Ye. Mukhin, H. Loutskii, O. Barabash, Ya. Kornaga, V. Steshyn. Models for Analysis and Prognostication of the Indicators of the Distributed Computer Systems’ Characteristics.// International Review on Computers and Software (IRECOS), Vol. 10, N 12, 2015.- pp. 1216 – 1224.
- N. Mohammadi, and M. Zangeneh, “Customer Credit Risk Assessment using Artificial Neural Networks,” I.J. Information Technology and Computer Science, Vol.8, N3, 2016, pp. 58-66. DOI: 10.5815/ijitcs.2016.03.07
- P. R. Vamsi, and K. Kan, “Self Adaptive Trust Model for Secure Geographic Routing in Wireless Sensor Networks,” International Journal of Intelligent Systems and Applications, Vol. 7, N3, 2015, pp. 21-28. DOI: 10.5815/ijisa.2015.03.03
- L. P. Rees, J. K. Deane, T. R. Rakes, and W. H. Baker, “Decision support for cybersecurity risk planning,’ Decision Support Systems, vol. 51. no. 3. 2011, pp. 493-505.
- P. Saripalh, and B. Walters, “Quire: A quantitative impact and risk assessment framework for cloud security,” IEEE 3rd International Conference on Cloud Computing, 2010.
- Yang Liu, Zhikui Chen, and Xiaoning Lv, “Risk computing based on capacity of risk-absorbing in virtual community environment,” International Journal of Communication Systems, 2014.
- A. Koul, and M. Sharma, “Cumulative Techniques for Overcoming Security Threats in Manets,” International Journal of Computer Network and Information Security, Vol. 7, N. 5, 2015, pp.61-73. DOI: 10.5815/ijcnis.2015.05.08
- Mohamed Hamdi, and Noureddine Boudriga, “Computer and network security risk management: theory, challenges, and countermeasures,” International Journal of Communication Systems, Volume 18, Issue 8, 2005, pp. 763–793. DOI: 10.1002/dac.729
- V.Ye. Mukhin. The Security Mechanisms for Grid Computers.// Proceedings of the 4-th IEEE Workshop on Intelligent Data Acquisition and Advanced Computing Systems: Technology and Applications (IDAACS’2007), Dortmund, Germany, 6-8 September 2007. – pp. 584-589.
- V.Ye. Mukhin. Adaptive Approach to Safety Control and Security System Modification in Computer Systems and Networks.// Proceedings of the 5-th IEEE Workshop on Intelligent Data Acquisition and Advanced Computing Systems: Technology and Applications (IDAACS’2009), Rende (Cosenza), Italy, 21 - 23 September 2009. – pp. 212 - 217.
- V.Ye. Mukhin, A.Ye.Bidkov, Vu Duc Thinh. The Forming of Trust Level to the Nodes in the Distributed Computer Systems.// Proc. of XIth International Conference “Modern Problems of Radio Engineering, Telecommunications and Computer Science TCSET’2012”. Lvov – Slavsko, 21 - 24 February 2012. – p. 362.
- V.Mukhin, Ya. Kornaga, Ye. Mostovoi, Yu. Bazacca. The model for the events monitoring in the hetero-geneous distributed databases based on a vector-matrix operations.// Far East Journal of Electronics and Communications. Vol.16, Issue 3, September 2016. –pp. 645 -656.
