Method for estimation of the pulse wave propagation velocity by a manual pneumatic arterial pressure sensor

Author: Antsiperov V.E., Bugaev A.S., Danilychev M.V., Mansurov G.K.
Journal: Cardiometry @cardiometry
Article in issue: 18, 2021.
Free access
The paper discusses a new method for diagnosing atherosclerosis using a pneumatic arterial blood pressure sensor previously developed by the authors hereof. The possibility of applying a pneumatic sensor to measure the pulse wave transit time referring to a synchronous ECG is treated herein. The specification of the method consisting in the selection of the characteristic moment of the pulse wave as the timestamp, when measuring the signal transit time in relation to the R-peak of the synchronous ECG, is justified hereby. The averaged values of the wave transit time at different points of the artery, taking into account the variability of the front delay values, are used to directly determine the pulse wave propagation velocity in the area between the measurement points.
Pulse wave, arterial pressure sensor, atherosclerosis, diagnostics
Short address: https://sciup.org/148321532
IDR: 148321532 | DOI: 10.18137/cardiometry.2020.18.3843
Text of the scientific article Method for estimation of the pulse wave propagation velocity by a manual pneumatic arterial pressure sensor
Vyacheslav E. Antsiperov, Aleksandr S. Bugaev, Mikhail V. Danily-chev, Gennady K. Mansurov. Method for estimation of the pulse wave propagation velocity by a manual pneumatic arterial pressure sensor. Cardiometry; Issue 18; May 2021; p.38-43; DOI: 10.18137/ cardiometry.2020.18.3843; Available from: http://www.cardiometry. net/issues/no18-may-2021/pulse-wave-propagation-velocity
The most important factors in treatment of atherosclerosis are prevention and early diagnostics there- 38 | Cardiometry | Issue 18. May 2021
of. At the subclinical stage of atherosclerosis (before clear-cut clinical signs appear), the disease can be defined as a process of a gradual loss by the blood vessels of their main functions with the poorly detectable external manifestation. With time, vascular calcification occurs, the vascular walls lose their elasticity, and the progressive narrowing of the blood vessel diameter is observed. The distinctive features of this process are an increase in stiffness of the arterial walls and a rise in arterial blood pressure (AP). Contemporary practice suggests that the widely used method of the arterial stiffness assessment in terms of quantity is measuring of pulse wave velocity (PWV). The latter is the velocity of a higher pressure wave, traveling in the arteries, generated by ejection of blood by the left ventricle in the systole period. In the framework of the linear approximation of the theory of hydroelasticity for this value we can write [1]
Eh
-
V1 P D (1)
where E is the effective tangent Young's modulus, h and D are non-disturbed wall thickness and diameter of the blood vessel, respectively, and ρ is blood density. From formula (1) it follows that an increase in the value of the elasticity modulus and a decrease in the blood vessel diameter result in a rise in the PWV value. It may be suggested that a reasonable method of measuring PWV is an immediate measurement of the pulse wave transit time (PWTT) between a pair of the specified cross-sectional areas in the artery to be examined. Theoretically, for this purpose, a pair of the sphygmometric sensing elements may be used, which are located proximally over the surface blood vessels (arteries) and distally referred to the heart (at the carotid, femoral, radial and some other accessible arteries). If distance d between the sensing elements (along the artery) is known and if the PWTT is determined as Δt = t2–t1, evidently the PWV value can be represented by the ratio between the above values as given below:
-
V=d/At = d/(t2 - t1), (2)
where t2 and t1 are the points in time of the successive traveling of a certain selected portion of the pulse wave, say, its front, when passing through each of the sensors. However, when implementing the method in practice, some difficulties in engineering and methodology emerge.
1 Measurement of PWV based on continuous monitoring of AP
Previously the authors hereof have developed and experimentally tested sensors of new types designed to trace the dynamics of the AP pulse wave, including a three-channel pneumatic sensor for noninvasive monitoring of arterial pressure (AP) [2-5]. The device developed by the authors hereof has an apparent advantage: it is capable of providing the mode of continuous measuring of the AP dynamics that makes possible not only to measure current systolic/diastolic pressure values, but also to trace the AP dynamics both within a cardiac cycle and considerable time intervals. The actual measurement of arterial pressure requires a certain position of the sensor above the artery, as well as a solid base under it, like the radius for the artery of the same name (see Figure 1 herein). Only in this case, the pressure in the operating chamber of the sensor can be considered to be equal to the blood pressure in the artery. It has been found experimentally that for arteries the location of which does not meet the above conditions, it is possible to observe a pulse pressure wave signal, the level and magnitude of which are noticeably damped by viscoelastic tissues lying both between the sensor and the artery under study, and behind the artery. However, in this case the time characteristics of the signal are retained that can be used to measure the wave front transit time.
In order to solve the problem of assessing PWV with the use of the pneumatic sensors, a non-standard approach has been applied. The idea behind this approach is that if measurements for a pair of the points over the artery can be separated in time, too, we may try to use a single sensor technique only. It is evident that the location of the R wave on an ECG can be utilized as the periodical zero reference. For this purpose, an additional channel of synchronous measuring of an electrocardiographic (ECG) signal has been integrated into the pneumatic AP sensor designed by the above authors. In this case, in terms of radio-engineering, the above channel can be considered as a peculiar kind of reference signal generator. The ECG amplifier circuit was designed to use conductive-gel-free dry electrodes without a neutral electrode that required both analog and digital circuit filters. The simplified circuit design was chosen to minimize the inconvenience of placing and removing the electrodes, and it is currently used as a pilot version only at the development stage.
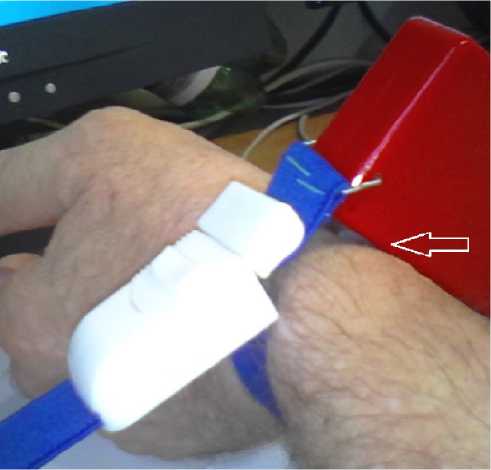
Figure 1. The three-channel pneumatic sensor for continuous non-invasive AP monitoring
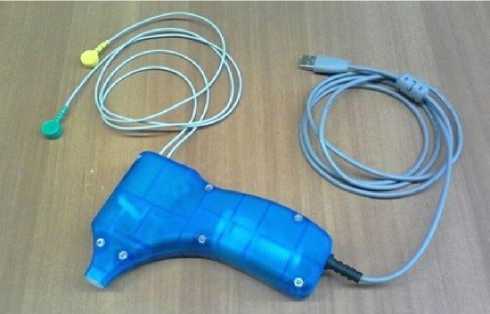
Figure 2. A design version of the pressure sensor for measuring short AP patterns with an integrated ECG channel
2 Methodology for measuring PWV with an integrated AP/ECG sensor
In cooperation with JSC NEUROCOM, a manual version design of the sensor has been developed that does not require to be fixed on the patient's body surface (see Figure 2 herein). This is convenient for obtaining relatively short fragments of the dynamics of arterial pressure over the radial artery.
Moreover, it turns out that the offered design version with an applicator located remotely ahead has been found to be sensitive enough to record the time parameters of the pulse wave practically over any artery that can be detected by palpation, since the size of the applicator is equal to the area of the finger pad. Certainly, the pressure applied to the applicator plane surface at the working points is equal to the pressure in the arteries only under quite rigorous conditions referred to the position of the artery relative to the sensi- tive surface. The time relations of the pulse wave curve are quite suitable for an analysis and processing.
The existing methods for assessing the stiffness of the arterial walls by the pulse wave propagation velocity are usually based on measuring the pulse wave propagation time to, for example, the radial artery by the delay in the appearance of the wave on the wrist, relative to the R-peak of the respective electrocardiogram. It has been shown [6] that the moment of the pulse wave appearance in the aorta does not coincide with the R-peak of the ECG, but has a certain time lag that differs for certain age groups, and exhibits relatively little variation within these categories. However, even this small variability may quite strongly provide effects on the accuracy of measurements of the pulse wave velocity (PWV). The PWV measurement error mainly depends on the accuracy of the signal transit time measurement, since the length of the examined artery section can be measured quite accurately. By the aorta-to-the radial artery distance approximately of 0.8 m and the pulse wave velocity approximately of 8 m/s, we can estimate the signal transit time: it is 100 milliseconds. For example, with a given measurement accuracy of 5%, an absolute error in measuring the transit time should not exceed 5 ms. If the determination of the R-peak moment in the ECG with such an accuracy is not difficult, then for the pulse wave, the minimum in front of the wave, as is customary in some publications, does not seem to be the best place to fix the time of the wave passage.
Taking into account these considerations, employing the manual pulse wave sensor, developed has been a method for the PWV measurement using not the signal delay time from the ECG R-peak of the ECG, but their difference at specific locations over the artery.
3 Experiments on the measurement of PWV with AP/ECG sensor
In a full-scale experiment, the results of which are presented in this section, a pulse wave has been recorded at three points along the artery: over the subclavian artery, over the ulnar artery 0.35 m lower, and over the radial artery 0.27 m lower with the respect to the preceding point. Figure 3 shows a complete recording of the pulse wave signal and an ECG, and the sequence of measurements is as follows: from the beginning till 18 s, the sensor is positioned over the subclavian artery, from 50 till 75 it is placed over the radial artery, from 110 to the end it is located over the ulnar artery.
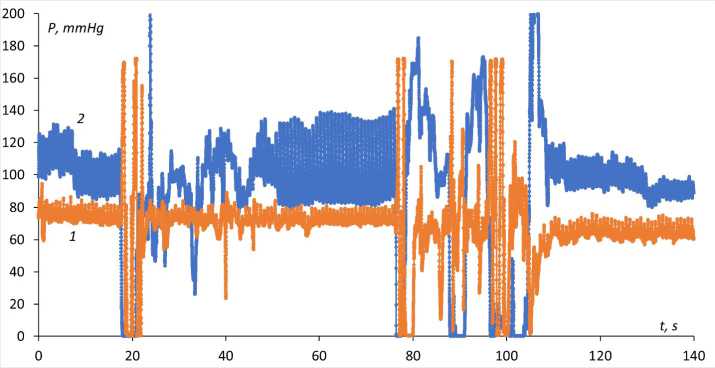
Figure 3. Recording of ECG (1) and pulse wave (2) signals
It should be recalled that only over the radial artery the pulse wave corresponds to the arterial pressure, while in other areas it is damped by soft tissues. Therefore, the amplitude and constant component of the pulse wave in these areas may differ significantly from the actual pressure in the artery.
Figure 4 displays a fragment of the pulse wave recording over the subclavian artery with a synchronous ECG signal, on which the wave fragments over the ulnar and radial arteries are overlapped, and the positions of the R-peaks of all three waves are made coincident in time (only one thereof is shown herein).
The graph in Figure 4 herein shows that the measurement of the signal wave transit time from the R-peak in the ECG according to passing by the derivatives the zero value without additional signal filtering is incorrect. However, since we are not bound by tabular reference values of “the pre-ejection time" [6], we can introduce a criterion for fixing the time of the wave passage, which is reliable and unified for all three signals. For this purpose, the leading and trailing edges of a signal front, which are well known in the pulse technology and which are fixed at the level of 0.1 and 0.9 of the signal amplitude, may serve as an eligible criterion. In our case, the threshold levels of the pulse wave edges are updated for each cycle, as shown in Figure 5 herein. Each positive edge of the signal has its own "personal" marks of the leading and the trailing edge, respectively. Of course, it is just the leading edge that should be taken as the timestamp of the wave propagation, since the shape of the pulse wave changes noticeably in the course of its travelling similar to the case with the edge time.
Figures 6-8 given herein exhibit three graphs, and, accordingly, Tables 1-3 show the quantitative values of the measured parameters of the AP wave edges for the subclavian, ulnar, and radial arteries, respectively. Designations used in the Tables are as follows: R, f01, f09 are the timestamps of the R-peak and the pulse
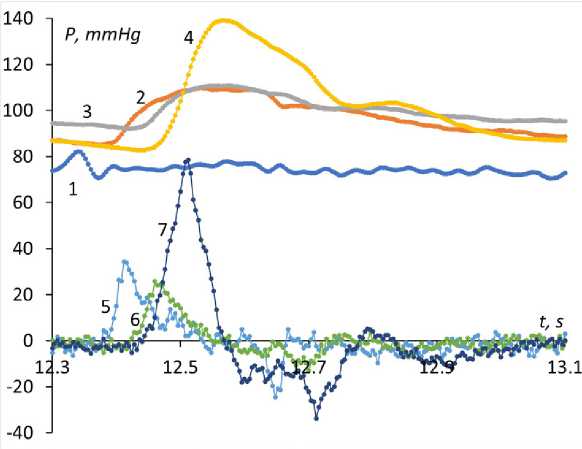
Figure 4. Pulse wave for three positions of the sensor. Legend: 1. ECG signal; 2, 3, 4 -pulse wave, respectively, over the subclavian, ulnar and radial arteries; 5, 6, 7 - derivatives of curves 2,3 and 4 (magnified by 20 times to make it more illustrative).
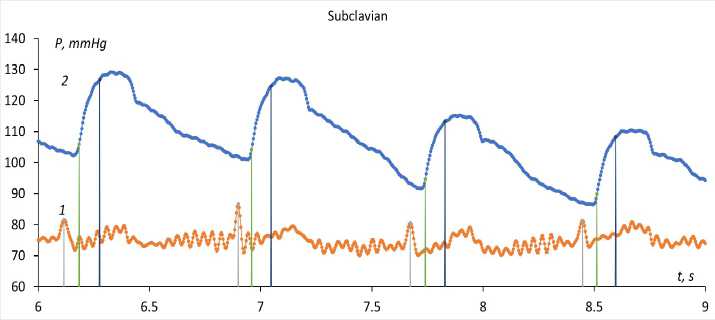
Figure 5. Timestamps at the level of 0.1 and 0.9 of the signal amplitude for each wave edge.
Table 1.
Values of the measured parameters of the AP wave edges for the subclavian artery
|
R |
f01 |
f09 |
f19 |
R - R |
f01-f01 |
R-f01 |
|
3.796 |
3.86 |
3.944 |
0.084 |
0.064 |
||
|
4.58 |
4.644 |
4.736 |
0.092 |
0.784 |
0.784 |
0.064 |
|
5.348 |
5.412 |
5.508 |
0.096 |
0.768 |
0.768 |
0.064 |
|
6.116 |
6.184 |
6.276 |
0.092 |
0.768 |
0.772 |
0.068 |
|
6.9 |
6.96 |
7.048 |
0.088 |
0.784 |
0.776 |
0.06 |
|
7.672 |
7.74 |
7.828 |
0.088 |
0.772 |
0.78 |
0.068 |
|
8.448 |
8.512 |
8.596 |
0.084 |
0.776 |
0.772 |
0.064 |
|
9.224 |
9.288 |
9.376 |
0.088 |
0.776 |
0.776 |
0.064 |
|
10.004 |
10.068 |
10.16 |
0.092 |
0.78 |
0.78 |
0.064 |
|
10.792 |
10.852 |
10.944 |
0.092 |
0.788 |
0.784 |
0.06 |
|
11.564 |
11.628 |
11.716 |
0.088 |
0.772 |
0.776 |
0.064 |
|
12.34 |
12.404 |
12.492 |
0.088 |
0.776 |
0.776 |
0.064 |
|
13.124 |
13.184 |
13.28 |
0.096 |
0.784 |
0.78 |
0.06 |
|
13.908 |
13.972 |
14.068 |
0.096 |
0.784 |
0.788 |
0.064 |
|
14.692 |
14.756 |
14.848 |
0.092 |
0.784 |
0.784 |
0.064 |
|
15.46 |
15.528 |
15.62 |
0.092 |
0.768 |
0.772 |
0.068 |
|
16.228 |
16.296 |
16.392 |
0.096 |
0.768 |
0.768 |
0.068 |
|
Av.val. |
0.0908 |
0.7770 |
0.7773 |
0.0642 |
||
|
Mean sq uared err or (MSE) |
0.0002 |
0.0008 |
0.0005 |
0.0001 |
||
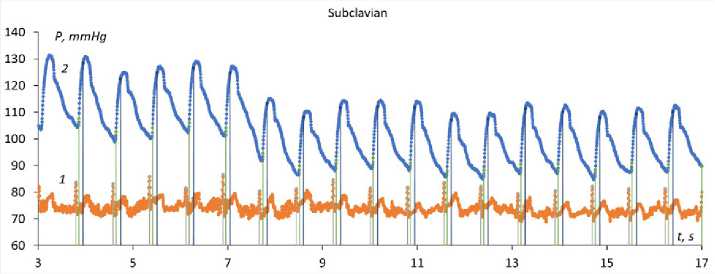
Figure 6. Timestamps of the AP wave and ECG for the subclavian artery
P, mmHg
toww
у УУУУ^У^УУУ пУУУ^
112 114 116 118 120 122 124 126 128
Figure 7. Timestamps of the AP wave and ECG for the ulnar artery
wave edge at the level of 0.1 and 0.9 of the amplitude, from which follow the values of the edge duration f19 = f09 – f01, R-R are the time intervals between the successive R-peaks, f01-f01 are the intervals between successive edges of the AP waves, R-f01is the transit time of the AP wave edge referred to the R-peak. All values are given in seconds.
Table 2.
Values of the measured parameters of the AP wave edges for the ulnar artery
|
R |
f01 |
f09 |
f19 |
R - R |
f01-f01 |
R-f01 |
|
112.812 |
112.92 |
112.98 |
0.06 |
0.108 |
||
|
113.608 |
113.716 |
113.78 |
0.064 |
0.796 |
0.796 |
0.108 |
|
114.404 |
114.508 |
114.572 |
0.064 |
0.796 |
0.792 |
0.104 |
|
115.204 |
115.312 |
115.376 |
0.064 |
0.8 |
0.804 |
0.108 |
|
116.004 |
116.112 |
116.172 |
0.06 |
0.8 |
0.8 |
0.108 |
|
116.792 |
116.9 |
116.968 |
0.068 |
0.788 |
0.788 |
0.108 |
|
117.584 |
117.692 |
117.756 |
0.064 |
0.792 |
0.792 |
0.108 |
|
118.384 |
118.488 |
118.552 |
0.064 |
0.8 |
0.796 |
0.104 |
|
119.184 |
119.288 |
119.364 |
0.076 |
0.8 |
0.8 |
0.104 |
|
119.98 |
120.088 |
120.16 |
0.072 |
0.796 |
0.8 |
0.108 |
|
120.764 |
120.872 |
120.952 |
0.08 |
0.784 |
0.784 |
0.108 |
|
121.552 |
121.66 |
121.732 |
0.072 |
0.788 |
0.788 |
0.108 |
|
122.348 |
122.452 |
122.524 |
0.072 |
0.796 |
0.792 |
0.104 |
|
123.144 |
123.252 |
123.316 |
0.064 |
0.796 |
0.8 |
0.108 |
|
123.928 |
124.036 |
124.092 |
0.056 |
0.784 |
0.784 |
0.108 |
|
124.716 |
124.82 |
124.892 |
0.072 |
0.788 |
0.784 |
0.104 |
|
125.5 |
125.608 |
125.684 |
0.076 |
0.784 |
0.788 |
0.108 |
|
126.292 |
126.392 |
126.456 |
0.064 |
0.792 |
0.784 |
0.1 |
|
127.08 |
127.188 |
127.268 |
0.08 |
0.788 |
0.796 |
0.108 |
|
127.852 |
127.96 |
128.028 |
0.068 |
0.772 |
0.772 |
0.108 |
|
Av.val. |
0.0680 |
0.792 |
0.792 |
0.1066 |
||
|
Mean sq uared err or (MSE) |
0.0009 |
0.001 |
0.001 |
0.0001 |
||
It should be noted that the data are related to a specific measurement session and may vary depending on many factors that determine the state of the human body. The Tables herein exhibit variability of all time intervals. The average transit time of the wave edge referred to the R-peak in the ECG for the subclavian artery is 64 milliseconds (ms), for the ulnar artery it
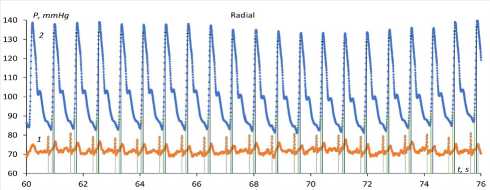
Figure 8. Timestamps of the AP wave and ECG for the radial artery
Table 3.
Values of the measured parameters of the AP wave edges for the radial artery
Interestingly, the duration of the pulse wave edge is recorded to be not the same in different areas of measurement: it reaches 91 ms over the subclavian artery, 68 ms over the ulnar artery and 64 ms over the radial artery, respectively.
Conclusions
From the above discussion, it follows that the manual pneumatic sensor designed to measure short fragments of the blood pressure dynamics over the
42 | Cardiometry | Issue 18. May 2021
radial artery can be used as a pulse wave sensor over the palpable arteries (without blood pressure verification). With an integrated ECG amplifier, it is possible to measure the transit time of the pulse wave edge at various points over the artery to determine the pulse wave velocity as one of the characteristics of the artery wall stiffness. It is important to note that in this case, the transit time is determined by the similar-shaped signals that significantly increases accuracy of measurements. Further development of the method may be an employment of interpolation methods for determining the pulse wave edge timestamps to improve accuracy.
The above research work has been completed within the framework of the Russian Governmental Task, supported by RFBR Grant 18-29-02108 mk.
Statement on ethical issues
Research involving people and/or animals is in full compliance with current national and international ethical standards.
Conflict of interest
None declared.
Author contributions
The authors read the ICMJE criteria for authorship and approved the final manuscript.
References Method for estimation of the pulse wave propagation velocity by a manual pneumatic arterial pressure sensor
- Pedley T. hydrodynamics of large blood vessels. M.: Mir, 1983, 400p. [in Russian]
- Antsiperov VE, Mansurov GK, et al. Patent for the invention 2638712 "Pneumatic sensor for continuous non-invasive blood pressure measurement", priority of 11/07/2016, published on 12/15/2017, Bulletin. No. 35. [in Russian]
- Antsiperov VE, Mansurov GK, et al. Patent for the invention 2675066 "Monolithic three-dimensional pneumatic sensor with built-in throttle channels for continuous non-invasive blood pressure measurement", priority of 12/26/2018, published on December 14, 2018, Bulletin No. 35. [in Russian]
- Antsiperov V., Mansurov G. Positioning Method for Arterial Blood Pressure Monitoring Wearable Sensor. Bioinformatics and Biomedical Engineering. IWBBIO 2019, Rojas I., et al (eds). Lecture Notes in Computer Science, vol. 11465. Springer, Cham, 2019, pp 405-414. DOI: 10.1007/978-3-030-17938-0_36
- Issue 18. May 2021 | Cardiometry | 43
- Mansurov GK, Danilychev MV, Antsiperov VE, Bugaev AS. The use of a pneumatic sensor in the problem of continuous non-invasive blood pressure monitoring and pulse wave. Radioelectronics. 2020;5. Available online: http://jre.cplire.ru/jre/may20/9/text.pdf. DOI: 10.30898/1684-1719.2020.5.9
- Kortekaas MC, van Velzen M. Small intraindividual variability of the pre-ejection period justifies the use of pulse transit time as approximation of the vascular transit. PLoS ONE. 2018;13(10):e0204105. DOI: 10.1371/journal.pone.0204105
