Methodological modeling aspects of foreign-economic activity in the regions of the North-West federal district

Author: Uskova Tamara Vitalyevna, Selimenkov Roman Yuryevich, Asanovich Valeriy Yakovlevich
Journal: Economic and Social Changes: Facts, Trends, Forecast @volnc-esc-en
Section: Russian and Belarusian academic scientific cooperation
Article in issue: 2 (20) т.5, 2012.
Free access
The article is devoted to the urgent researching problems of integration and modeling of foreign economic activity in the little-studied aspect of the relation system “country - region of another country”. It considers the developmental trends of trade and economic integration between the regions of the North-West Federal District and the Republic of Belarus. The article describes a mathematical apparatus of gravitational modeling of foreign-economic interaction that is tested on the base of statistical accountability of the regions of the North-West Federal District and the Republic of Belarus.
Foreign-economic activity of the regions, trade and economic integration, goods turnover, economic and mathematical modeling
Short address: https://sciup.org/147223342
IDR: 147223342 | UDC: 339.92(470+476)
Text of the scientific article Methodological modeling aspects of foreign-economic activity in the regions of the North-West federal district
It is difficult to overestimate the value of foreign-economic activity. On the one hand, it is a result of intergovernmental and interregional geographical division of labour; on the other hand, it is a precondition for the increase in the regional economic efficiency.
Focusing on large-scale international exchange is safe and profitable, because it allows us to expand a range and increase a variety of consumer goods, which are offered to the population and used in the national economy [15].
Figure 1. The share of the North-West regions in the foreign trade activities of the Russian Federation
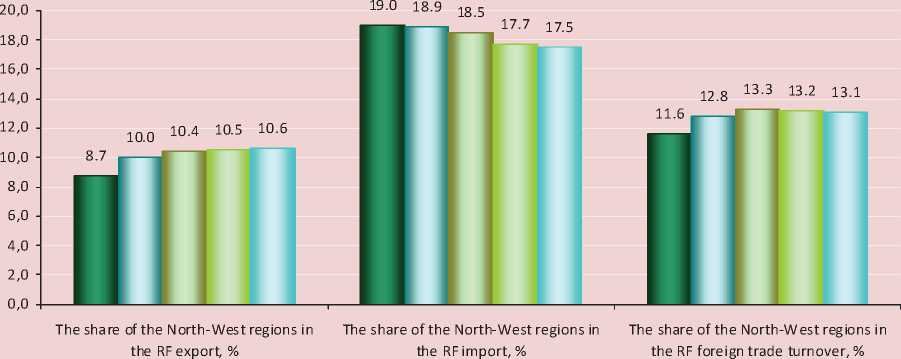
With the decline in domestic demand, export deliveries are one of the most important survival conditions for the regional economy. Import satisfies the need for goods and their expanded range, for raw materials and semi-manufactured goods that ensure the industrial processes, as well as for machinery and equipment. Therefore, foreign trade links are the necessary conditions for stable functioning of an economic complex in any region of Russia [10].
The North-Western regions of Russia are active participants in the international activities. Their share in the foreign trade turnover of the Russian Federation was 13.1% in 2009 (fig. 1) . At the same time, the increase in the share of the North-West regions in the RF export by 1.9% corresponded to the decrease in their share in the RF import by 1.5% in the period from 2005 to 2009.
It should be noted that the foreign-economic activity of the North-West regions had the positive growth rates up to 2009: for example, the foreign trade turnover grew up by 31.3% in 2008 as compared with 2007. Those figures were reduced to 36.6% in 2009 due to the worsened macroeconomic environment, caused by the global financial crisis [7].
The foreign trade cooperation between the subjects of the North-West Federal District in the period under our review was being built up simultaneously with the far-abroad and nearabroad countries (table 1 and 2) .
However, if in the case of foreign countries the foreign trade balance for the entire period from 2005 to 2009 was close to zero, then the export to CIS countries exceeded the import by 2.9 times in 2005 and by 3.5 times in 2009. The largest difference in the period of our study was observed in 2008, when the export exceeded the import by 5.9 times. It is an evidence of the high economic potential competitiveness of the regions of the North-West Federal District in the CIS market.
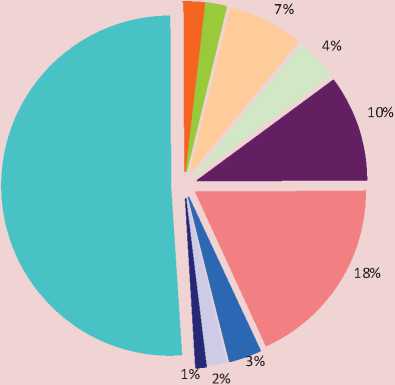
St. Petersburg was showing the largest foreign trade activity among the regions of the North-West Federal District during the whole period under our study: its share in the foreign trade turnover of the NWFD amounted to 51% in 2009. According to this indicator, the Vologda Oblast (4%) ranked fifth after the Leningrad Oblast (18%), the Kaliningrad Oblast (10%) and the Arkhangelsk Oblast (7%) (fig. 2) .
Table 1. Foreign-economic activity in the regions of the North-West Federal District (export) (in actual prices; billion US dollars) [14]
|
Federal subject of Russia |
Export |
|||||||||
|
With far-abroad countries |
With CIS countries |
|||||||||
|
2005 |
2006 |
2007 |
2008 |
2009 |
2005 |
2006 |
2007 |
2008 |
2009 |
|
|
North-West Federal District |
19390.7 |
28118.2 |
33237.2 |
44961.4 |
28956.4 |
1502,4 |
2035,2 |
3403.4 |
4359.8 |
3017.0 |
|
Republic of Karelia |
965.3 |
1164.9 |
1168.6 |
1345.0 |
968.8 |
33.3 |
41.1 |
59.6 |
57.7 |
37.8 |
|
Republic of Komi |
522.6 |
682.6 |
845.9 |
966.0 |
651.3 |
173.7 |
155.5 |
231.3 |
227.9 |
139.5 |
|
Arkhangelsk Oblast |
972.3 |
1509.8 |
1311.9 |
2291.8 |
3997.2 |
65.0 |
71.1 |
95.6 |
107.8 |
89.4 |
|
Vologda Oblast |
2838.9 |
2180.7 |
2629.9 |
4112.0 |
2112.0 |
177.4 |
232.7 |
297.6 |
438.3 |
228.8 |
|
Kaliningrad Oblast |
1688.0 |
1182.3 |
502.5 |
593.2 |
540.2 |
137.6 |
65.6 |
95.2 |
103.9 |
178.6 |
|
Leningrad Oblast |
5781.3 |
6614.9 |
8033.7 |
11225.1 |
6918.6 |
267.6 |
214.7 |
247.2 |
340.1 |
243.4 |
|
Murmansk Oblast |
1187.3 |
2074.7 |
2107.8 |
2295.6 |
1596.9 |
3.4 |
3.6 |
10.7 |
12.3 |
44.4 |
|
Novgorod Oblast |
721.1 |
764.3 |
835.5 |
1227.8 |
650.3 |
41.7 |
69.1 |
94.6 |
98.4 |
76.2 |
|
Pskov Oblast |
388.5 |
438.1 |
231.5 |
188.1 |
37.5 |
13.6 |
21.0 |
32.5 |
37.3 |
23.3 |
|
Saint Petersburg |
4325.4 |
11505.9 |
15569.9 |
20716.7 |
11483.6 |
589.1 |
1160.8 |
2239.1 |
2936.1 |
1955.6 |
|
Total in Russia, bln. |
208.8 |
259.7 |
299.3 |
398.1 |
255.0 |
32.6 |
42.3 |
52.7 |
69.8 |
46.8 |
Table 2. Foreign-economic activity in the regions of the North-West Federal District (import) (in actual prices; billion US dollars) [14]
|
Federal subject of Russia |
Import |
|||||||||
|
With far-abroad countries |
With CIS countries |
|||||||||
|
2005 |
2006 |
2007 |
2008 |
2009 |
2005 |
2006 |
2007 |
2008 |
2009 |
|
|
North-West Federal District |
18211.4 |
25498,5 |
36320.9 |
46618.6 |
28477.1 |
510.3 |
514.4 |
674.8 |
741.5 |
861.9 |
|
Republic of Karelia |
180.5 |
207.6 |
328.8 |
391.8 |
221.5 |
2.8 |
3.3 |
10.7 |
4.0 |
3.3 |
|
Republic of Komi |
208.8 |
167.6 |
220.8 |
368.3 |
343.3 |
15.5 |
6.8 |
6.2 |
10.2 |
7.7 |
|
Arkhangelsk Oblast |
117.8 |
368.7 |
304.7 |
382.6 |
226.3 |
14.6 |
20.2 |
23.4 |
17.6 |
8.2 |
|
Vologda Oblast |
274.3 |
339.7 |
459.0 |
514.8 |
391.1 |
42.6 |
45.0 |
44.4 |
57.0 |
20.2 |
|
Kaliningrad Oblast |
3703.4 |
5056.2 |
7728.5 |
9279.4 |
5182.3 |
92.1 |
100.6 |
130.2 |
146.4 |
144.6 |
|
Leningrad Oblast |
3164.8 |
4665.6 |
6491.0 |
8685.8 |
3604.9 |
22.3 |
24.5 |
47.3 |
51.1 |
55.5 |
|
Murmansk Oblast |
196.5 |
141.5 |
276.7 |
350.3 |
333.7 |
6.8 |
3.9 |
3.9 |
6.9 |
9.4 |
|
Novgorod Oblast |
281.5 |
234.6 |
304.3 |
432.7 |
12.8 |
17.4 |
14.5 |
11.8 |
14.4 |
288.5 |
|
Pskov Oblast |
322.3 |
434.4 |
584.6 |
897.0 |
639.3 |
3.8 |
5.9 |
9,3 |
11.3 |
4.8 |
|
Saint Petersburg |
9761.5 |
13882.6 |
19622.4 |
25315.8 |
17521.9 |
292.5 |
289.7 |
387.5 |
422.7 |
319.7 |
|
Total in Russia, bln. |
79.7 |
115.2 |
169.9 |
230.4 |
145.7 |
19.0 |
22.3 |
29.9 |
36.7 |
21.8 |
Figure 2. The share of the regions in the foreign trade of the North-West Federal District in 2009
2%
2%
51%
-
■ Republic of Karel ia
-
■ Republic of Kom i
Arkha ngels k Oblast
Vologda Oblast
-
■ Kaliningrad Oblast
-
■ Leningrad Oblast
-
■ Murm ansk Oblast
-
■ Novgorod Oblast
-
■ Pskov Oblast
-
■ Sa int Petersburg
The study of foreign trade activity of the North-West regions and the Republic of Belarus allows us to conclude that there is a decline in the trade and economic integration between them. The regional foreign trade quota was reduced in seven regions of the NorthWest Federal District during the period under review. Only the Arkhangelsk and Murmansk Oblasts and the Republic of Komi increased their regional goods turnover with the partner country (tab. 4) .
However, the degree of the NWFD regions’ production dependence on the export of their goods to the market of Belarus is still high (tab. 5) .
At the same time, the system of international labour division involved less regional resources in the acute phase of the crisis. This is evidenced by the reduced coefficient of the advancing growth of regional export towards the GRP growth rates in all the North-West regions except of the Arkhangelsk Oblast and the Republic of Komi (tab. 6) .
However, the development of mutually beneficial trade relations between the regions of the North-West Federal District and the Republic of Belarus is very important for the national and regional economies within the Union State.
Table 3. The dynamics of the trade and economic development of the Republic of Belarus and Russia, % to the relevant period of the previous year [14]
|
Indicator |
Country |
2006 |
2007 |
2008 |
2009 |
Average annual growth rate in 2006 – 2009 |
|
Growth rate of GDP, % |
Belarus |
109.9 |
108.2 |
110 |
100.2 |
107.0 |
|
Russia |
106.7 |
108.1 |
105.6 |
92.1 |
102.9 |
|
|
Industrial production index, % |
Belarus |
111.4 |
108.7 |
111.5 |
97.2 |
107.0 |
|
Russia |
106.3 |
106.3 |
102.1 |
90.7 |
101.1 |
|
|
Growth rate of foreign trade |
Belarus |
123.5 |
123 |
134.2 |
69.3 |
109.0 |
|
turnover, % |
Russia |
124.7 |
116.8 |
133.1 |
63.8 |
105.5 |
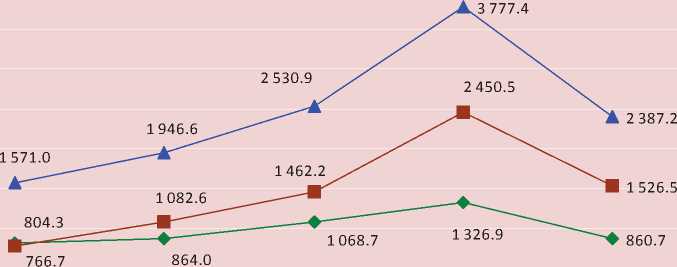
Figure 3. Foreign trade cooperation between the regions of the North-West Federal District and the Republic of Belarus, bln. dollars [14]
4 000,0
3 500,0
3 000,0
2 500,0
2 000,0
1 500,0
1 000,0
500,0
|
2005 2006 2007 2008 |
2009 |
— ♦ — Import ■ Export ▲ Goods turnover
Table 4. Regional foreign trade quota of the regions of the North-West Federal District and the Republic of Belarus, %
|
Region |
2005 |
2006 |
2007 |
2008 |
2009 |
2009 to 2005, p.p. |
|
Pskov Oblast |
4.49 |
6.04 |
6.78 |
8.91 |
4.15 |
-0.34 |
|
Republic of Komi |
0.88 |
0.53 |
1.01 |
1.05 |
3.78 |
2.90 |
|
Vologda Oblast |
3.75 |
4.15 |
3.93 |
4.29 |
3.34 |
-0.42 |
|
Kaliningrad Oblast |
4.41 |
3.78 |
2.65 |
6.75 |
2.78 |
-1.63 |
|
Novgorod Oblast |
3.93 |
3.29 |
2.95 |
2.54 |
2.41 |
-1.52 |
|
Saint Petersburg |
3.12 |
3,15 |
2.80 |
3.02 |
2.03 |
-1.09 |
|
Leningrad Oblast |
2.13 |
1.94 |
2.24 |
2.97 |
1.79 |
-0.34 |
|
Murmansk Oblast |
0.87 |
0.97 |
0.86 |
2.19 |
1.47 |
0.61 |
|
Republic of Karelia |
1.01 |
1.49 |
1.08 |
1.13 |
0.74 |
-0.27 |
|
Arkhangelsk Oblast |
0.32 |
0.32 |
0.32 |
0.58 |
0.59 |
0.27 |
Table 5. The share of exports to the Republic of Belarus in the GRP of the NWFD regions, %
|
Region |
2005 |
2006 |
2007 |
2008 |
2009 |
2009 to 2005, p.p. |
|
Republic of Komi |
0.69 |
0.37 |
0.90 |
0.94 |
3.70 |
3.01 |
|
Vologda Oblast |
2.69 |
3.19 |
3.04 |
3.50 |
2.84 |
0.15 |
|
Pskov Oblast |
2.04 |
4.33 |
5.05 |
7.22 |
2.80 |
0.76 |
|
Kaliningrad Oblast |
1.96 |
1.98 |
1.08 |
5.35 |
1.98 |
0.02 |
|
Novgorod Oblast |
1.73 |
2.09 |
2.01 |
1.52 |
1.47 |
-0.27 |
|
Leningrad Oblast |
1.38 |
1.34 |
1.52 |
2.24 |
1.30 |
-0.08 |
|
Murmansk Oblast |
0.65 |
0.63 |
0.54 |
1.75 |
1.16 |
0.51 |
|
Saint Petersburg |
1.13 |
1.36 |
1.31 |
1.48 |
0.83 |
-0.29 |
|
Arkhangelsk Oblast |
0.11 |
0.09 |
0.10 |
0.23 |
0.40 |
0.29 |
|
Republic of Karelia |
0.40 |
0.92 |
0.52 |
0.58 |
0.39 |
-0.01 |
Table 6. Coefficient of the advancing growth of regional export towards GRP growth rates in the North-West regions
|
Region |
2006 |
2007 |
2008 |
2009 |
2009 to 2005, % |
|
Republic of Komi |
0.54 |
2.43 |
1.05 |
3.94 |
by 7 times |
|
Arkhangelsk Oblast |
0.81 |
1.07 |
2.43 |
1.71 |
by 2 times |
|
Novgorod Oblast |
1.21 |
0.96 |
0.76 |
0.97 |
80.05 |
|
Vologda Oblast |
1.18 |
0.95 |
1.15 |
0.81 |
68.60 |
|
Republic of Karelia |
2.30 |
0.56 |
1.13 |
0.67 |
29.22 |
|
Murmansk Oblast |
0.97 |
0.86 |
3.22 |
0.66 |
68.65 |
|
Leningrad Oblast |
0.97 |
1.13 |
1.48 |
0.58 |
59.82 |
|
Saint Petersburg |
1.20 |
0.97 |
1.13 |
0.56 |
46.78 |
|
Pskov Oblast |
2.12 |
1.17 |
1.43 |
0.39 |
18.26 |
|
Kaliningrad Oblast |
1.01 |
0.54 |
4.96 |
0.37 |
36.49 |
Table 7. The initial data of the gravity model’s parameters
|
Years |
Goods turnover between the regions of the NWFD and the Republic of Belarus, bln. dollars ( Xij ) |
GDP of the Republic of Belarus, bln. dollars ( Yi ) |
GRP of the NWFD regions, bln. dollars ( Yj ) |
Population size in the Republic of Belarus, mln. persons ( Ni ) |
Population size in the regions of the NWFD, mln. persons ( Nj ) |
|
2005 |
1571 |
30.192 |
64.278 |
40.583 |
13.628 |
|
2006 |
1947 |
36.932 |
77.965 |
51.465 |
13.550 |
|
2007 |
2531 |
45.216 |
104.535 |
61.562 |
13.501 |
|
2008 |
3777 |
60.384 |
138.295 |
73.283 |
13.462 |
|
2009 |
2387 |
49.029 |
104.789 |
74.550 |
13.437 |
Despite the positive balance of foreign trade, the active foreign trade balance of the North Western Federal District was formed only in the groups of raw materials and low processing goods: fuel and energy products, timber, pulp and paper products, metals and metal products.
There is a passive balance in the product groups of higher value added; this fact indicates a lack of competitiveness in the foreign markets of this range of products manufactured in the North-West regions.
The development of mutually advantageous cooperation is one of the objectives of the
Union State of Russia and Belarus. However, the global financial crisis has made the significant changes in the development of trade and economic integration between two countries in recent years. The decline in demand has led to a drop in the growth rate of both economies and, consequently, to the decrease in their trade turnover (tab. 3) .
A similar trend is being observed at the regional level. The trade turnover between the regions of the North-West Federal District and the Republic of Belarus declined from 3.8 billion dollars down to 2.4 billion dollars (37%) during the crisis.
Thereupon, the question of predicting and determining the effectiveness of the integration process is still acute from the scientific and practical points of view.
The modeling of trade and economic integration is an important methodological task that could be solved through the use of gravity models. These models allow us to predict the potential long-term trade flows, and they characterize the factors influencing the size and structure of foreign trade turnover: the possibility of export and import expressed in some goods supply in the foreign markets and the demand for other goods; recognizing of the deterrents of the foreign trade turnover between the countries (transport charges, tariff system) [1, 2, 6, 16]. The influence of these factors, on their part, is estimated on the basis of the actual amount of goods turnover between the countries though a regression analysis. The resulting parameters of a gravity model characterize its flexibility and show the changes in the goods turnover between the countries if the relevant factor is changed by 1%. This model is usually represented either in a power form or in a logarithmic form.
We used the gravity models of J. Tinbergen and H. Linneman in order to predict the foreign trade turnover between the regions of the North-West Federal District and the Republic of Belarus [2, 16].
The model of J. Tinbergen is the following:
X ij = a o (Y i )a * (Y j )a (D j ) a> = e . (1)
The model of H. Linneman is more general in arrangement:
Xj = a0(Yi)a1(Yj)a2(Ni)a3(Nj)a4 x x (Dj/^A/tj + e , (2)
where Xij – the value of trade flow from a country i to a country j;
Yi , Yj – indicators of nominal GDP of the countries, in national currency;
Dij – the physical remoteness of economic centers of the countries i and j, km;
Ni, и Nj – the population size in this country;
Аij – any other factor that favors or prevents the trade (such as barriers or anti-dumping regimes in one country);
Pij – trade preferences that exist between the states (in the absence of preferential agreements Pij = 1; otherwise Pij = 2);
α1, α2, α3, α4, α5, α6, α7 – export elasticity coefficients of the exporting country GDP, of the population in the country i, of the population in the country j, of the distance between the countries, any other factor, trade preferences;
-
α 0 – an absolute term of the equation;
-
ε – a random error.
The gravity model construction based on the original data matrix (tab. 7) has allowed us to determine the parameters of regression equations.
The result of calculations was an equation of the J. Tinbergen’s gravity model that described the dynamics of the foreign trade turnover between the regions of the North-West Federal District and the Republic of Belarus over the period from 2005 to 2009:
Xij = 14,17875 . (Yi) _ 0,5728 . (Yj)1,5959 ,
R2 = 0,96 (3)
It should be noted that the model is highly strict, because a determination coefficient is 0.96. The economic interpretation of this model allows us to conclude that the increase in the GRP of the North-West regions by 1% provokes the increase in their goods turnover by 1.6%. However, the goods turnover between the regions of the North-West Federal District and the Republic of Belarus will decrease by 0.57% if the GDP of Belarus increases by 1%. In our opinion, this dependence is determined by the features of the commodity composition of export and import in the regions of the NorthWest Federal District and in the Republic of Belarus.
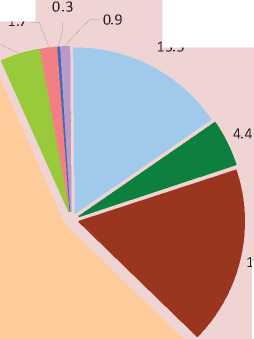
Since the export structure of the NorthWest Federal District and the Republic of Belarus is represented by mineral products, steel products and chemicals (fig. 4) , the increase in the GRP of the regions depends on the growth of export deliveries.
At the same time, the import from the Republic of Belarus to the regions of the North-West Federal District is represented mainly by engineering goods that have a limited circle of customers (fig. 5) . Thus, if the demand of the North-West regions for these products is met, it will be possible to increase the GDP of Belarus due to the expansion of supply geography leading to the reduction of the goods turnover between the regions of the North-West Federal District and the Republic of Belarus.
Another result can be obtained by using the H. Linneman’s gravity model:
X j = 1396046571 76576 • (Y J 1> 6206 x
x
(Yj) 0,4171
. (Ni) 1,1959
. (N j )
_ 10,7299
R2 = 0,99 . (4)
A determination coefficient is higher – 0.99, because this model takes into account more factors that can influence on the turnover of goods. However, we can conclude on the basis of this equation that the increase in the GDP of Belarus by 1% will provoke the increase in the goods turnover between the regions of the North-West Federal District and the Republic of Belarus by 1.62%; if the GRP of the North-West regions increases by 1%, the turnover of goods will increase by 0.41%. If the size of population grows by 1%, the goods turnover will decrease by 1.19% in Belarus and by 10.73% in the regions of the North-West Federal District.
Figure 4. The structure of merchandise exports from the regions of the NorthWest Federal District to the Republic of Belarus in 2008, %
55.9
1.7
3.9
15.5
17.4
-
■ Enterprise chemical production
-
■ Wood and wood products
-
■ Ferrous and nonferrous metals
Mi nera l products
-
■ Foodstuffs and primary products
-
■ Engineering goods
-
■ Textiles, textile goods and footwear
-
■ Other goods
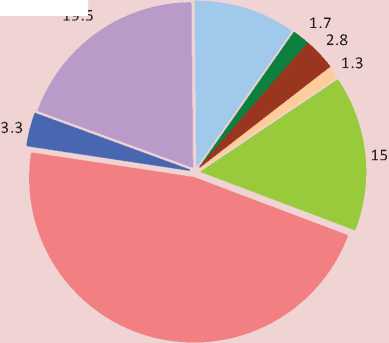
Figure 5. The structure of merchandise imports from the Republic of Belarus to the regions of the North-West Federal District in 2008, %
10.1
19.5
46.4
-
■ Enterprise chemica l production
-
■ Wood and wood products
-
■ Ferrous and nonferrous meta ls
Mineral products
-
■ Foodstuffs and prima ry products
-
■ Engineering goods
-
■ Textiles, textile goods and footwea r
-
■ Other goods
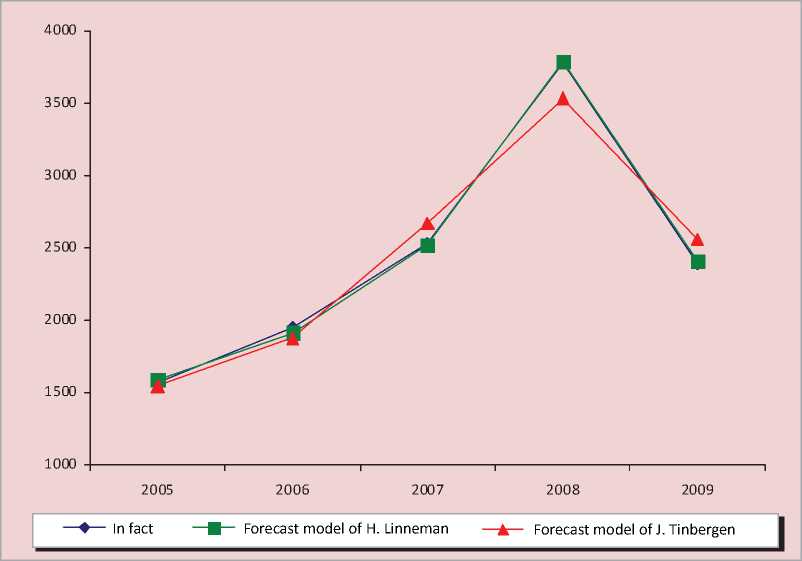
The gravity model appraisal in predicting the foreign trade turnover between the regions of the North-West Federal District and the Republic of Belarus for the period from 2005 till 2009 indicates that the forecast is close to the actual level (fig. 6) . The discrepancy between predicted and real values is explained by the influence of some factors unaccounted in the model on the foreign trade turnover indicators.
According to the theory of gravity models constructing and their descriptions, the GDP of an exporting country is reflecting production capabilities, while the GDP of an importing country is reflecting its market capacity. In general, these two variables are related directly proportional to the volume of trade.
In addition to the models discussed above, other more complicated models can be used for the forecasting of foreign trade relations. A bizonal inter-industrial model, which is based on the input-output balances of the countries participating in foreign trade, can be used as an example.
The task of this model is to ensure the maximization of some economic indicators under the given set of constraints [11]. The most important of them include the equations of production balance and the production distribution of the sectors of the national economy and each zone’s industry into industrial and unproductive consumption, accumulation and compensation for deteriorated fixed assets. In addition, export and import are reflected at each level. Not only the volume of production is variable, but some elements of the final product, including the cross-countries and foreign economic activities, are variable. The model also includes the equations for the determination of total export and import in cost estimates. Some limitations of foreign trade and cross-countries balance are introduced on the base of these equations. Depending on the specific task, the direct limitations of production volume, cross-countries deliveries, export and import can be given in the model.
Figure 6. The dynamics of the foreign trade turnover between the regions of the North-West Federal District and the Republic of Belarus
The function of maximized domestic final product can be used as a criterion function. It is a sum of consumption funds, the accumulation and compensation for deteriorated fixed assets.
Depending on the task, the total domestic product of both zones and the total domestic products of each of them are maximized. It is preferably to maximize the total value of the final products of the both zones, because there is an imitation of a negotiated solution in this case that ensures the maximization of cumulative effect or the minimization of total damage for them if the relations between them are changed.
Thus, the economic-mathematical tools modeling the integration processes of the Republic of Belarus and Russia are very diverse. The main difficulties in modeling are statistical data on the parameters of the models, which, unfortunately, are often incorrect or utterly lacking.
References Methodological modeling aspects of foreign-economic activity in the regions of the North-West federal district
- Anderson J.E., Van Wincoop E. Gravity with gravitas: a solution to the border puzzle. American Economic Review. 2003. Vol. 93. No. 1. Р. 170-192.
- Tamirisa N. Exchange and Capital Controls as Barriers to Trade. IMF Staff Papers. 1999. Vol. 46. No. 1. Р. 57-68.
- Ricci L.A. Exchange Rate Regimes and Location. Konstanz University mimeo, 1996.
- Asanovich V.Ja. Economic-mathematical methods and models in the international economic relations. Minsk: BSEU, 2003.
- Balatsky E.V. Modeling of the policy of foreign trade efficiency. International economic relationship. 2002. No. 2.
- Belenky V.Z., Arushanyan I.I. Appraisal of the active export-import policy capabilities on the base of an open steady-state model of the economy in Russia. Economics and mathematical methods. 1995. Vol. I. P. 83-97.
- Uskova T.V., Asanovich V.Ya., Dedkov S.M., Selimenkov R. Yu. Foreign economic activity of the regions of the North-West Federal District and the Republic of Belarus: condition and methodological aspects of modeling. Economic and social change: facts, trends and forecasts. 2010. No. 4. P. 118.
- Kallaur P. Monetary integration of Belarus and Russia: a retrospective analysis. Banking bulletin. 2001. No. 3. P. 2-10.
- Klotsvog F.N., Matsnev D.A., Safronov V.A. Using a bizonal inter-industry model in the analysis of inter-republic economic ties in Russia. Economics and mathematical methods. 1994. T. 30. Vol. I. P. 67-80.
- Uskova T.V., Dedkov S.M., Smirnova T.G., Selimenkov R. Yu., Asanovich V.Ya. Inter-regional cooperation as a factor of integration processes in Russia and the Republic of Belarus. Vologda: ISEDT RAS, 2011.
- Inter-regional inter-industry model of the global economy. Ed. by A.G. Granberg and S. M. Menshikov. Novosibirsk: Science, 1983.
- Modeling of global economic processes. Ed. by V.S. Dadayan. Moscow: Economics, 1984.
- Smirnova T.G., Selimenkov R. Yu. Assessment of trade and economic integration of the regions of the North-West Federal District and the Republic of Belarus. Problems of the territory development. 2010. No. 5. P. 20.
- Statistical Materials. Available at: http://www.belstat.gov.by; http://www.president.gov.by; http://www.nbrb.by; http://www.gks.ru; http://www.cbrf.ru
- Rybalkin V.E., Shcherbanin Yu.A., Baldin L.V. International economic relations. Moscow: UNITY-DANA, 1997.
- Shaytanova N. A., Asanovich V.Ya. Gravity models and the possibility to use them in the prediction of foreign trade in the Russian Federation and the Republic of Belarus. In: Information technology management in the economy -2006: Proceedings of the Republican scientific-practical conference in Brest, April 25 -26, 2006. Ed. by S.A. Tuzik. Brest: BrSU, 2006.
