Methodology for assessing scenarios of tourism industry development in Kamchatka krai on the basis of digital twin technology

Author: Kuznetsov Mikhail E., Nikishova Mariya I.
Journal: Economic and Social Changes: Facts, Trends, Forecast @volnc-esc-en
Section: Branch-wise economy
Article in issue: 1 т.16, 2023.
Free access
In the rapidly changing conditions of the current technological paradigm new methodological approaches are required to assess effective management using modern digital tools (digital twins) that help to increase the quality and efficiency of economic processes to make timely and balanced management decisions. The purpose of the study is to develop a methodology for assessing scenarios for the development of the tourism industry in Kamchatka Krai on the basis of digital twin technology. Scientific novelty of the proposed methodology is the use of structural and situational dynamics methods with the involvement of data processing statistical methods in AnyLogic environment. The developed model is a modern digital tool that helps to convert a set of diverse data into a timely and balanced management decision based on an understanding of the current state of the industry and the prospects for its development. The theoretical significance lies in the scientific justification of the digital twin concepts and their application in simulation modeling in relation to the tourism industry. The practical significance is that the digital twin allows simulating different scenarios of Kamchatka Krai tourism industry development, thereby reducing the number of routine business processes and the influence of human factor on the quality of service. Using the assessment results, we have identified optimal scenarios for the development of the tourism industry in Kamchatka Krai, its bottlenecks, and determined that the introduction of scenario simulation modeling will regularly calculate the basis the tourist expenses and, consequently, the tourist industry income, and through multipliers - the regional budget income, and other integral indicators to improve the competitiveness of the tourism industry in the region. In contrast to the traditional analytics of processes based on tables and linear dependence, the developed digital twin makes it possible to observe the detailed behavior of the system in time, to keep track of tourist preferences and the capacity of tourist attraction points, to give recommendations on the placement of new objects. The obtained results can be used in the formation of proposals for the development of the tourism industry, and the monitoring of its condition and efficiency.
Tourism, tourism industry, digitalization, digital model, simulation modeling, digital twin, kamchatka krai
Short address: https://sciup.org/147240249
IDR: 147240249 | UDC: 332.144 | DOI: 10.15838/esc.2023.1.85.6
Text of the scientific article Methodology for assessing scenarios of tourism industry development in Kamchatka krai on the basis of digital twin technology
One of the main strategic technological trends of economic growth in the Russian Federation today is digitalization, which involves the creation of scientific, technological, legal, financial and organizational conditions that support the development of the digital economy in the country1. Digital technology exponentially increases the state of the information space, and thus the scale of the transformation of economic activity2. In this regard, the structure of the economic system is changing, and with it its dynamic properties, as a key element of the digital transformation process is the transition from analog or physical technologies to digital tools based on Big Data (Shpak et al., 2020). In 2021, global digital investment reached
$4.24 trillion3. The emergence of digital simulation 3D models and Digital Twin is one of the results of the development of digital manufacturing, Industry 4.0 and the Internet of Things (IoT) (Shpak et al., 2020).
Conceptually, the basics of the digital twin were presented as early in 2003 in the works of M. Grieves (Grieves, 2005; Grieves, 2016). Before 2015, the term “digital twin” (DT) was usually mentioned in cases of industrial twins. Further issues of DT implementation were studied by R. Soderberg (Soderberg et al., 2017), F. Tao (Tao et al., 2018), R. Bolton (Bolton et al., 2018), A.E. Saddik (Saddik, 2018) and others. These authors give a broader interpretation of the concept, according to which the digital twin is “... a digital copy of a living or non-living physical entity.
Connecting the physical and virtual worlds, data is transferred, allowing the virtual entity to exist simultaneously with the physical entity” (Saddik, 2018); “...using a digital copy of the physical system for real-time optimization” (Soderberg et al., 2017); “...a real life representation of all components in the product life cycle using physical data, virtual data and interaction data between them”(Tao et al., 2018), “...a dynamic virtual lifecycle representation of a physical object or system using real-time data for understanding, learning, and reasoning” (Bolton et al., 2018).
According to the data4, 89% of all IoT platforms will use digital twin technology by 2025, and by 2027 it will become a standard feature of IoT solutions. 36% of executives from various industries note the benefits of the DT, and 53% of them plan to implement the DT by 2028. Credence Research predicts that the global DT market will reach $57.38 billion by 2027 (it was $3.76 billion in 2018; up more than 15-fold) (Prokhorov, Lysachev, 2020).
Simulation modeling allows us to forecast, calculate and make the most effective financial and investment decisions, taking into account a variety of factors that affect economic development (Molodetskaya, 2020; Novysh, Yurcha, 2020). In this regard, the methodology for assessing scenarios for the tourism industry based on digital twin technology is of particular importance.
Currently, under our leadership, the Eastern State Planning Center (FASI “Vostokgosplan”)5 is actively working to create a digital twin (simulation model) in relation to regional tourism. Kamchatka acts as a pilot region, the tourism potential of which at present is not fully realized6. According to expert data, the share of tourism in GRP of Kamchatka Krai is extremely small and amounts only to 2%7. Constraints for tourism development in Kamchatka are insufficient recognition and “media publicity” of Kamchatka Krai in domestic and foreign markets; low level of development of the industry material base and weak development of transport infrastructure and service facilities; low investment activity of business structures; difficult transport accessibility of the region; short tourist season. To solve these problems, the priority areas of the Strategy in the field of digital transformation of Kamchatka Krai8, actually serving as a starting point for future promising technological breakthroughs in the tourism industry, correlated with national projects “Tourism and the hospitality industry” and “Digital Economy”9 and corresponding implementation of the program “Industry 4.0”.
In turn, the introduction of a “digital twin” includes effective scenario planning for the development of tourism and related industries in the region. FASI “Vostokgosplan” acts as an operator of the statistical monitor and aggregator of open statistical data; data received from public authorities of all levels; big data provided on a contractual basis by their suppliers. The list of indicators displayed on the statistical monitor and the frequency of data updates depend on cooperation with big data providers. Obtaining relevant statistical data on a regular basis and in a variety of sections directly affects the degree of detail modeling of the tourism industry.
The article presents the methodological aspects of assessing scenarios of tourist industry development on the basis of digital twin technology. The peculiarity of the proposed simulation scenarioforecast model of regional tourism is the use of methods of structural and situational dynamics with the involvement of statistical data processing methods in AnyLogic environment.
The purpose of the study is modeling scenarios of tourism industry development based on digital twin technology on the example of Kamchatka Krai.
In accordance with the purpose of the study we set and solved the following tasks:
-
1) development and testing of a simulation scenario-forecast model of the tourist services implementation on the example of Kamchatka Krai, based on the principles of system dynamics;
-
2) calculation of scenarios for the tourism industry development in the region, a description of the modeling results.
The scientific novelty of the proposed assessment methods is the use of methods of structural and situational dynamics, involving statistical methods of data processing in AnyLogic environment.
The theoretical significance lies in the scientific justification of digital twin concepts and their application in simulation modeling in relation to the tourism industry.
The practical significance lies in the fact that the digital twin can simulate different scenarios of Kamchatka Krai tourism industry, reducing thereby the number of routine business processes and the impact of human factors on service quality.
The concept of digital twins has been proposed relatively recently, but the significance and importance of this study is supported by an appropriate base of literature. The basic tenets of the digital twin concept originated in the engineering paradigm and have been applied mainly in industrial sectors, in which a clear link between the digital model and the real object is evident at all stages of manufacturing (Boschert, Rosen, 2016; Kritzinger et al., 2018; Mittal et al., 2018).
Scientifically, the foundations of the digital twin concept were laid in 2003 in the M. Grieves’ works (Grieves, 2005). Before 2015, the term “digital twin” (DT) was usually mentioned in cases of industrial twins. In particular, W. Wong10 introduced the concept of an intellectual product and identified its main characteristics. К. Hribernik and coauthors (Hribernik et al., 2006) put forward the concept of a product avatar, according to which a product can have a virtual digital copy and be able to access data collected during the product life cycle, optimize the parameters of operation, maintenance, repair, etc. The term “digital twin” first got its official scientific meaning in the research of M. Grieves and D. Vickers (Grieves, Vickers, 2017). Between 2010 and 2014, the DT concept developed with close attention from the aerospace industry, and the term was applied in industrial product design primarily for the transportation industry (Shafto et al., 2010; Glaessgen, Stargel, 2012). Later, the implementation of digital twins in various industries of the economy was studied by R. Bolton (Bolton, 2018), K. Boschert (Boschert, Rosen, 2018), P. Coronado (Coronado et al., 2018), J. Lee (Lee et al., 2015), A. Saddik (Saddik, 2018), R. Soderberg (Soderberg, et al., 2017), F Tao (Tao et al., 2018).
With the development of virtual models in engineering, the characteristics and behavior of the virtual apparatus began to be predicted through mathematical modeling based on a numerical model (Belinha et al., 2009; Lawson and Marion, 2008).
Referring to the currently available Russian studies (Azrapkin, 2022; Gorelova, 2020; Kata-levskii, Suslov, 2022; Savostyanov, 2021), it is easy to note that mathematical models of economic systems and simulation modeling tools are used mainly to predict the development of economic processes in time and the state in which the economy will be, the characteristics of the studied economic system under certain conditions. However, the established methods of describing the state and evolution of the economy sectors use a small set of indicators, the values of which change relatively smoothly, and the list remains unchanged (Olenev, 2008). Also problematic is the choice of variables that adequately reflect the structure of the economic system, which leads to the impossibility of a detailed description of all processes, which raises difficulties with the typology and mathematical description of typical economic processes.
Despite the great interest to the DT topic, we should note that in fact this technology, as well as solutions based on it, is at an early stage of development, when the professional community has not yet developed generally accepted definitions and standards, experts argue on many issues: what a digital twin is, what types there are, in which industry solutions this term is applicable, etc.
Our study is supposed to eliminate all the abovementioned gaps in this direction of economic science. It is necessary to develop and implement a program to calculate the characteristics of the studied economic process (in our case the potential of the regional development of the tourism industry), to identify the model, that is to determine the external values contained in it (coefficients, parameters, factors), to verify the model, in other words, to ensure that it gives practically acceptable forecasts.
The article presents our simulation scenarioforecast model of the implementation of tourist services in Kamchatka Krai, based on the principles of system dynamics (Akopov, 2019; Sidorenko, 1998; Forrester, 1958; Meadows et al., 2005). The main provisions of structural and situational analysis with the involvement of statistical methods of data processing have been applied.
The developed model of tourist industry development is a modern digital tool that converts a set of diverse data into a timely and balanced management decision, based on an understanding of the current state of the industry and the prospects of its development. The main goal of creating a digital model of the tourism industry is effective scenario planning for the development of tourism and related industries in the region. Schematically, the tasks and simulated processes are shown in Fig. 1 .
The model is developed in AnyLogic software environment and is supplied as a jar file. Runs as part of the Java virtual machine and requires jar files of AnyLogic platform, a local HyperSQLDB and a Web server. The user works with the model through a standard browser. Data input-output in the current version of the model is carried out through xls files (modeldata.xlsx for input data and results. xlsx, resultsTData.xlsx for output data), it is also possible to export calculation results to the database PostgreSQL.
MS Excel files are used to enter data and configure simulation model scenarios, and to output and save the results. Moreover, two additional MS Excel files were created in the model: “Connector” (for processing, systematization and formatting of AnyLogic model output data to be uploaded to the “results” file for further
-
Figure 1. Tasks and processes of the regional tourism simulation model
Simulation model of regional tourism
Model tasks
Model processes
-
- assessment of scenarios for the industry's development, economic, social and environmental effects and its contribution to the regional economy;
-
- the arrival and departure of tourists;
-
- visiting of tourist attractions;
-
- accommodation, food, shopping;
-
- internal transfers on the territory using available transport.
-
-
- analysis of “bottlenecks” and opportunities in the development of the industry;
-
- searching for ways to improve the efficiency of the tourism industry.
Source: own compilation.
calculations) and “Scenario” (for calculation of integral socio-economic indicators for tourism and formation of data in the required structure for further visualization in the BI-system – Yandex DataLens).
Among the indicators calculated in the “Scenario” file are the volume of gross value added (GVA) of tourism industry; the share of GVA of tourism industry in the planned gross regional product (GRP) of the region; tax revenue from the functioning of tourism industry; shortage of accommodations; number of jobs provided by tourism industry; average tourist spending. The indicators are calculated for the whole period of modeling. The article presents a detailed calculation of each indicator.
GVA calculation
The methodology used to calculate the gross value added created by the tourism industry in Kamchatka Krai, consistent with the methodology approved by Rosstat Order 26711.
GVA, created in the tourism industry, is determined by the formula (1):
GVA f = O f xS_GVA f , (1)
where:
GVA f — the gross value added created in year t by providing the i-th type of tourist services;
O f — the output of the i -th type of tourist services in the year t ;
S_GVA f — the share of gross value added in the output of the i -th type of tourist services in year t .
The output of goods and services in this methodology is accounted for the i -th type of tourism services provided by the simulated objects of the tourism industry in Kamchatka Krai. The output for the i -th type of service in year t is determined by the formula (2):
Of = Pf X Costf, (2)
where:
P f — the number of provided services of the i -th type in year t (in appropriate units);
Cost - — the unit cost of providing the i -th type of service in year t .
The cost of services is a scenario parameter. The number of provided services is determined in the simulation modeling with the input scenario parameters of the tourist flow in Kamchatka Krai and other infrastructure parameters.
Gross value added is defined as the value of goods and services output minus the value of intermediate consumption. The term “gross” indicates that the indicator is defined before deducting consumption of fixed capital12. The share of GVA in the output of the i -th type of services in year t is determined by the formula (3):
S_GVA - = 1 - S_IC, (3)
where:
S_IC f — the share of intermediate consumption expenditures13 in the output of the i -th type of service in year t .
In accordance with p. 37 of the Methodological Recommendations14, the estimate of GVA in current prices of forecast years is recommended to be formed as the difference between the output in current basic prices of forecast years and the costs of intermediate consumption in current prices of buyers taking into account the forecasted indices-deflators of output and indices-deflators of costs for intermediate consumption. Then the share of intermediate consumption costs in the output of the i-th type of product in year t should be determined by the following formula (4):
С тгt _ S^iK^Dfe S_I4 = pt ■ where:
K^ — the amount of costs (in rubles) for the intermediate consumption of products of the k -th type of activity per ruble of output during the provision of the i -th type of service (the coefficient of the direct cost matrix);
D ^ — the accumulated deflator for the products of the kth type of activity relatively to the base period by the year t . The base period within the model is 2018 (according to the year of the tables of the use of goods and services, within which the direct cost matrix is calculated);
n – the amount of production by type of activity, net taxes and other components of intermediate consumption; within the model, products and services are grouped by type of economic activity according to OKVED-2 classification (by sections A-T); the amount of taxes minus subsidies is not taken into account due to lack of data and also due to the small share of this component in intermediate consumption expenditures;
Pl f — the accumulated price index for services of the i -th type relatively to the base period by year t ; within the framework of modeling coincides with the value of the accumulated deflator for the aggregated industry, providing the service of the i -th type.
The costs of intermediate consumption of goods and services should be determined by a matrix of direct costs for the provision of a particular type of service. If such data are not available, the coefficients of the direct cost matrix are calculated on the basis of the basic “input-output” tables (symmetric “input-output” table)15 or tables of goods and services use published by Rosstat16. The coefficients of the direct cost matrix are determined by the formula (5):
р _ ICki
C ki = O i , (5)
where:
ICki — the amount of expenses (in rubles) for intermediate consumption of products of the k -th type of activity while providing services of the i -th type;
O L — the amount of output in providing services of the i -th type (in basic prices).
GVA of the entire tourism industry is calculated as the sum of the results of all economic activities, of the collective group “Tourism”.
To assess the contribution of tourism to the economic development of the region, the share of tourism GVA (tourism GVA is calculated in AnyLogic environment) in the planned GRP of Kamchatka Krai is calculated by the formula (6):
S GVA GRPt = GVA , (6) Г GRPt where:
S_GVA_GRPt — the share of the gross value added of the tourism industry in relation to the gross regional product, calculated for the year t ;
GVAt — the gross value added of the tourism industry created in year t ;
GRPt — the gross regional product of Kamchatka Krai created in year t .
The values of the planned GRP were taken from the forecast of socio-economic development of Kamchatka Krai until 202417 and the forecast of socio-economic development of Kamchatka Krai until 203518.
Calculation of the number of jobs
The number of jobs is calculated separately for guides and separately for other areas of employment in tourism. The number of required guides is calculated according to the guide capacity, the probability of using a guide in each tourist attraction point19 and the number of tourists visiting it (the number of visitors to each tourist attraction point), in AnyLogic environment according to the formula (7):
t q^ x pUGj q ' GT ’
where:
qG i — the number of guides needed at the i -th attraction point in year t ;
qT - — the number of tourists who visited the i -th attraction point in the year t ;
pUGt — the probability of a tourist using a guide at the i -th attraction point;
GT — the capacity of a guide (the number of tourists which take a guided tour per year).
Indicators of the probability of using a guide at the i -th attraction point and the capacity of one guide in the model are scenario-based and evaluated expertly.
For other types of tourism activities, the number of jobs in the base year is calculated according to labor productivity (calculated by the volume of GVA created by one worker) and the volume of GVA created separately by areas of activity. The labor productivity indicator for the base year is determined by the following formula (8):
to ^^ °
_ 1 GVA ^° , (8)
where:
k_Ltj0 — the labor productivity for the i -th type of tourism services in the base year t 0;
qL? — the average annual number of people employed in the i -th type of tourism services in the base year t 0;
GVA ‘ ° — the gross value added created in the i -th type of tourism services provided in the base year t 0.
Indicators of the average annual number of people employed in the i -th type of tourism services in the base year t 0 and the gross value added created in the i -th type of tourism services in the base year t 0, for the calculation of the scenario indicator of labor intensity for the i -th type of tourist services in the base year t 0 were taken according to Rosstat.
The number of jobs by type of tourist services for the base year is determined by the formula (9):
L ,0 = GVA ,0 x к L ,0 . (9)
I I I
The number of jobs by type of tourist services for the forecast period is determined by the formula (10):
it it-1 ^ GVA; zin\
Ll = Lf 1x^" ’ l10)
where:
L — the number of jobs for the i -th type of tourism services in the year t ;
L ^-1 — the number of jobs for the i -th type of tourism services in the year ( t – 1);
/_GVA ' — the ratio of the gross value added by the i -th type of tourist services in year t to the gross value added by the i -th type of tourist services in year ( t – 1);
ILP^ — the index of labor productivity for the i -th type of tourist services provided in the year t .
The index of productivity indicator for the base year was a scenario and was calculated by the formula (11):
ILPi t °
/AV ;0
where:
/VA-° — the index of the physical volume of gross value added for the i-th type of tourist services of the base year t0 to the year (t0 – 1);
IqL"” — the index of total labor costs for the i -th type of tourism services of the base year t 0 to the year ( t 0 – 1).
Forecast values of the productivity index were estimated based on the growth rate of this indicator according to the forecasts of socio-economic development of Kamchatka Krai until 2024 and 2035.
The total number of jobs created by the tourism industry is the sum of jobs by type of activity.
Calculation of tax deductions
The model calculates the volume of tax deductions to the budget for three types of taxes: value added tax (VAT), personal income tax (PIT) and income tax.
To calculate the income tax, we use the coefficient – the share of net income (NI) for the base year, which was calculated as the average between the shares of net income for 2016–2018.
Indicators of NI share for 2016–2018 were calculated as the ratio of net profit to output by type of services provided at basic prices according to the formula (12):
S_Npf =
NP i
Output - ,
where:
S_NP^ — the share of net profit for the i -th type of tourist services provided in the year t ;
NP^ — the net profit on the i -th type of tourism services provided in the year t ;
Output ■ — the output for the i -th type of tourist services in basic prices in the year t .
The values of net profit for the i -th type of tourist services provided in year t and the output for the i -th type of tourist services provided in basic prices in year t are taken from the symmetric table “input-output” and the tables of goods and services use published by Rosstat. The values of the NP share for the forecast years are equal to the values of the NP share for the base year.
The amount of income tax is calculated as the product of the share of NP on revenue and the tax rate according to the formula (13):
ToP/ = S_NP/ x Revenue - x nt , (13)
where:
ToP ( f — the amount of collected taxes on profits for the i -th type of tourism services in the year t ;
S_NP^ — the share of net profit for the i -th type of tourist services provided in the year t ;
Revenue ; — the amount of revenue for the i -th type of tourist services provided in the year t ;
nt — the income tax rate in the year t .
The values of revenues for the i -th type of tourist services in year t are calculated in AnyLogic environment. The values of the income tax rate are set equal to 20% for the entire simulation period.
The size of the tax rate is a scenario parameter and can be changed in each individual scenario.
Total income tax is the sum of deductions by type of activity.
VAT is calculated as the product of revenue by the tax rate (14):
VAT- = Revenue - x n t , (14)
where:
-
VAT ^ — the amount of collected value added tax on the i -th type of tourist services in the year t ;
Revenue ^ — the amount of revenue for the i -th type of tourist services provided in the year t ;
-
n t — value added tax rate in the year t .
The values of the volume of revenue for the i -th type of tourist services in year t are calculated in AnyLogic environment. Values of the tax rate of value added tax are set equal to 20% for the entire simulation period.
PIT is calculated as the product of the average salary, the number of jobs in the tourism industry, the tax rate and the number of months per year (15):
PIT t = AS t x qL t x nt x 12 , (15)
where:
PITt — the volume of collected taxes on personal income in the year t ;
AS t — the average salary in the tourism industry in the year t ;
qLt — the number of jobs in the tourism industry in the year t ;
-
nt — the rate of personal income tax in the year t ;
-
12 – the number of months in a year.
The values of average salary are a scenario parameter for the model and is calculated on the basis of Rosstat data on average salaries by type of tourist services provided. The indicator “Growth rate of nominal average monthly salary of employees of organizations” of the long-term forecast of socioeconomic development of Kamchatka Krai (the base case) was used to predict the values of average salary20. The methodology for calculating the number of jobs in the tourism industry in the year t given above. The values of the tax rate of personal income tax are set equal to 13% for the entire simulation period.
Calculation of the shortage of jobs in collective accommodation facilities
The model provides for the calculation of the deficit of places in collective accommodation facilities (CAF). The deficit/excess of places in CAF is calculated by the formula (16):
J dCAFj?1
«CAF t = - sCAFt, (16)
where:
nCAF ^ — average daily deficit (with a positive value) / surplus (with a negative value) of places in collective accommodation in the most popular month of the year t ;
dCAF p — the average value of daily demand for beds in collective accommodation facilities in the most popular month of the year t ;
sCAFt — daily supply of beds in collective accommodation facilities in the year t .
Calculation of the average value of daily demand for places in collective accommodation facilities in the most popular month was based on the results of simulation in AnyLogic environment. Values of daily supply of places in collective accommodation facilities in year t were filled on the basis of Rosstat data on the planned number of places, as well as expert evaluation of the informal part of the CAF.
The model also calculates the number of lacking CAF objects by the formula (17):
nCAF $
Add CAFt = £ , (17)
_ r Av P CAF , v 7
where:
Add_CAFt — the number of collective accommodation facilities that cover the deficit of CAF places in the year t ;
nCAF ^ — average daily deficit (with a positive value) / surplus (with a negative value) of places in collective accommodation in the most popular month;
Av_P_CAF – the average number of CAF places in one CAF object.
The value of the average number of CAF places in one CAF object is a scenario parameter and set expertly.
Calculation of average tourist spending
The average cost per tourist of each cluster for the trip is calculated as the ratio of revenue (total for the cluster) to the volume of tourist flow (total for the cluster) according to the formula (18):
Ei
E- = ^, (18)
where:
£ f — the average spending of one tourist of the i -th cluster during the whole stay in the year t ;
E f — total spending of all tourists of the i -th cluster in the year t ;
qT - — the number of tourists of the i -th cluster in the year t .
The value of the indicator number of tourists of the i -th cluster in year t is a scenario parameter and was set expertly on the basis of the data provided by the Ministry of Tourism of Kamchatka Krai. The values of the indicator total spending of all tourists of the i -th cluster in year t are calculated in AnyLogic environment.
A full calculation of economic indicators occurs after unloading the output data of the model in a separate model in MS Excel format. Simplified calculation of economic indicators allows us to preliminarily assess the modeling results and is made on the basis of the total statistics on the tourists’ number and their spending (Tab. 1).
Table 1. Simplified calculation of economic indicators within the simulation model
|
Indicator |
Source of information or calculation rules |
Note |
|
Volume of tourist flow |
Of the simulated parameters (separately for Russian and foreign tourists) |
|
|
Gross value added of the industry (million rubles) |
Number of tourists who visited attractors and infrastructure (accommodation, food, trade) x avcost x industry value added rate |
Norm of VA = 0.55 |
|
Share of tourism in the region’s GRP |
GVA of the industry/GRP of the region |
GRP is set by year according to the forecast of socio-economic development in the table general |
|
The number of jobs created by the tourism industry |
GVA x labor costs (labor intensity) |
Labor costs = 1.12 jobs / 1 million rubles |
|
Hotels, campsites |
The number of tourists who visited the attractions and infrastructure group types “Accommodation” x avcost x labor costs (labor intensity) |
|
|
Cafes, restaurants |
Number of tourists who visited the attractions and infrastructure group types “Food” x avcost x labor costs (labor intensity) |
|
|
Guide services |
Number of tourists who visited attractions/guide productivity (100 people per guide) |
|
|
Integral level of tourist satisfaction, % |
Share of visited tourist sites (50% more – xf less red 50-70% yellow above green) |
|
|
Completely satisfied |
> 70% of successful days |
|
|
Partially satisfied |
50–70% of successful days |
|
|
Unsatisfied |
< 50% of successful days |
|
|
The average expenditure of clusters of tourists on a trip, thousand rubles |
Sum (avcost of objects x number of visits of these objects by tourists in the cluster) / the value of the tourist flow of the cluster) |
|
|
Taxes, thousand rubles |
The method of calculation for each tax is given below |
|
|
VAT |
Number of tourists who visited attractions and infrastructure (accommodation, food, trade) x avcost x 0.2 |
|
|
Income tax |
Number of tourists who visited attractions and infrastructure (accommodation, food, trade) x avcost x net profit rate |
Net profit margin = 0.289 |
|
PIT |
AS by industry*Number of jobs created by the tourism industry x 0.13 |
AS by year is given in the table general |
|
Source: own compilation. |
||
During the calculations of the main indicators, tables with data are formed, which are loaded into the PostgeSQL database, for subsequent visualization in the BI-system – Yandex DataLens, where a set of charts is formed, showing the results of modeling for each scenario: number of tourists by clusters; number of tourists by months, in the selected year; number of visitors of attraction points per year, by types of attraction points (thousand people), with the possibility of dipping to the level of individual attraction points; revenue of attraction points per year, by type of attraction points, with the possibility of dipping to the level of individual points of attraction; the number of visitors to attraction points by months in the selected year, by type of attraction points, with the possibility of dipping to the level of individual points of attraction; revenue of attraction points by months in the selected year, by type of attraction points; share of GVA of tourist industry in GRP; GVA volume of the tourism industry; tax deductions from the tourism industry; jobs in the tourism industry; average cost per trip of one tourist, by cluster; level of tourist satisfaction; number of tourists transported by different types of transport; revenue from transportation by different types of transport; deficit of places in the CAF.
These charts are shown on a single dashboard (stand), with the ability to instantly switch between scenarios and visually compare calculation results for any two scenarios. Each dashboard chart provides the ability to export the visualized data, including MS Excel format. The list of information displayed on the dashboard is not final and can be expanded with further development of the model.
The main screen of the runtime model is shown in Fig. 2.
Figure 2. Main model screen in runtime mode
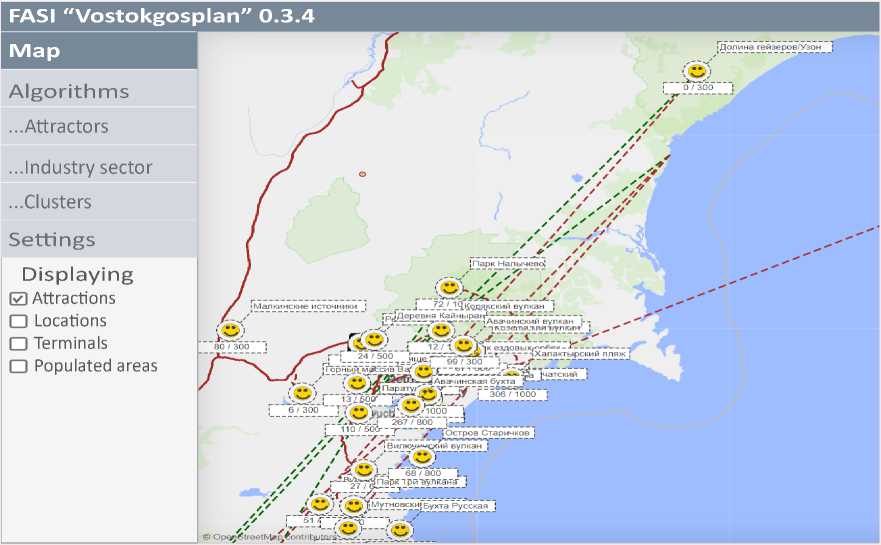
Source: own compilation.
In the simulation mode, the user can also select one of the tourist attractors by click to view detailed information about it ( Fig. 3 ).
This article presents only the main conclusions from the modeling results. All the charts described above and detailed data of the simulation results for each scenario can be found in the dashboard of the BI-system Yandex DataLens with the possibility of data export.
The model includes the following simulation scenarios for the development of the tourism industry in Kamchatka Krai.
Conservative scenario (S1) provides for the continuation of the tourist flow growth trend at an average annual rate identical to the observed from 2014 to 2019 – by 5% per year, starting from 2021, where the volume of tourist flow is 210 thousand people per year. In this scenario, all objects of the model retained their characteristics throughout the simulation period. There were no new points of tourist attraction, infrastructure was not developed, new routes were not created. The only variable in the simulation is the volume of tourist flow.
The base scenario (S2) provides for the growth of tourist flow at the level of 12% per year for the entire modeling period.
Optimistic scenario (S3) provides for an active growth of tourist flow from 2021 to 2027 by 15% and then by 25% by the end of the simulation period due to the introduction of several new major points of attraction of tourists.
Cyclical pandemic (S4) provides for a general trend of increasing tourist flow with a drop of 50% every 4 years due to the worsening of the pandemic and a recovery to the level of the year before the pandemic.
Figure 3. Statistics on the object
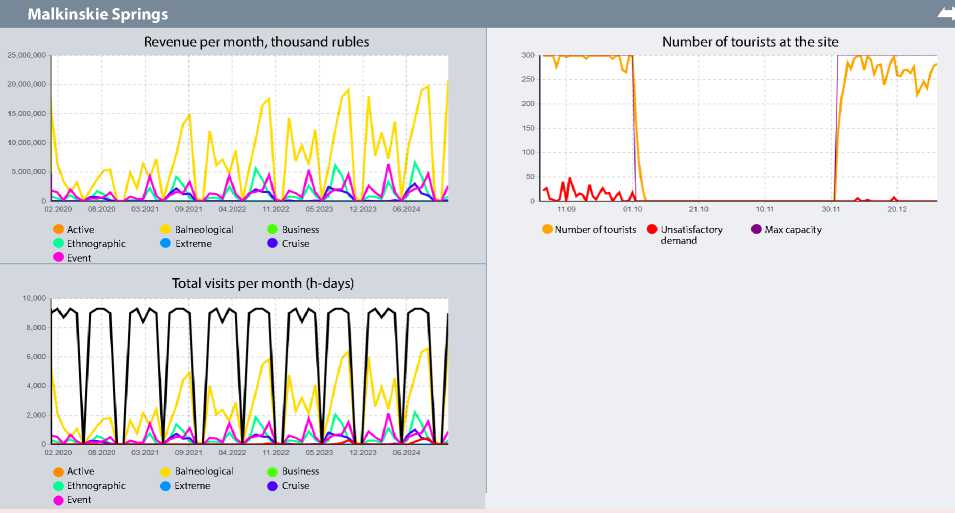
Revenue per month, thousand rubles
Number of tourists at the site
• Max capacity
Total visits per month (h-da y s)
Balneological
* Extreme
Balneological
Extreme
• Business
Business
Cruise
• Active
Ethnographic • Event
• Number of tourists • Unsatisfactory demand
• Active
• Ethnographic
• Event
Malkinskie Springs
Note: The left side of this screen shows the integral indicators for the entire calculation time, the right side shows the occupancy forecast on a daily basis. The purple line represents the maximum number of simultaneous tourists received and the seasons during which the facility is open for visits.
Source: own compilation.
Indicators of simulation modeling scenarios Comparative results of simulation scenarios of for the development of the tourism industry in Kamchatka Krai tourism industry development are Kamchatka Krai are shown in Tab. 2. shown in Fig. 4, 5.
Table 2. Scenarios of simulation modeling of tourism industry development in Kamchatka Krai
|
Scenario |
Tourist flow, people |
||||||||||
|
2020 |
2021 |
2022 |
2023 |
2024 |
2025 |
2026 |
2027 |
2028 |
2029 |
2030 |
|
|
Conservative scenario (S1) |
91,000 |
210,000 |
220,500 |
231,525 |
243,101 |
255,256 |
268,019 |
281,420 |
295,491 |
310,266 |
325,779 |
|
Basic scenario (S2) |
91,000 |
210,000 |
235,200 |
263,424 |
295,035 |
330,439 |
370,092 |
414,503 |
464,243 |
519,952 |
582,346 |
|
Optimistic scenario (S3) |
91,000 |
210,000 |
241,500 |
277,725 |
319,384 |
367,291 |
422,385 |
485,743 |
607,178 |
758,973 |
948,716 |
|
Cyclic Pandemic (S4) |
91,000 |
210,000 |
241,500 |
277,725 |
138,863 |
277,725 |
319,384 |
367,291 |
422,385 |
211,193 |
422,385 |
Note: The simulation period in all scenarios is 11 years – from 2020 to 2030. The starting year is 2020 (pandemic); the inclusion of 2020 allows for more accurate consideration of possible scenarios within a cyclic pandemic (S4).
Source: own calculations.
Figure 4. Volume of tourist flow depending on the development scenario, 2020–2030, thousand people
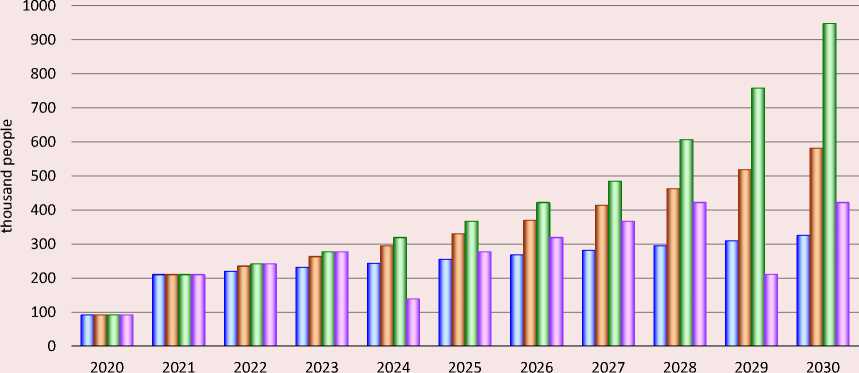
year
□ S1 □ S2 □ S3 □ S4
Source: own compilation.
Figure 5. Volume of GVA of tourist industry, 2020–2030, billion rubles
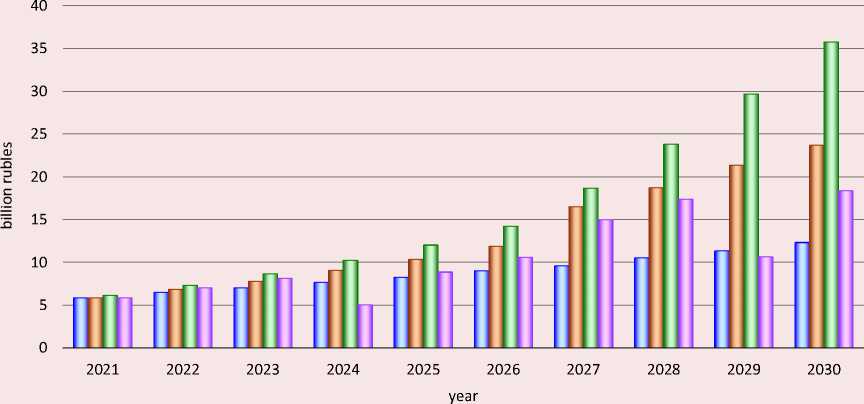
| п S1 □ S2 □ S3 о S4
Source: own compilation.
Comparative results of simulation scenarios show that with the development of a conservative scenario in 10 years, the volume of tourist flow in Kamchatka Krai will reach a peak and the slow development of the industry will be replaced by degradation. The share of tourism industry GVA in GRP in the conservative scenario increased slightly: from 2.11% to 2.47%. In the base scenario, the share of GVA of the tourism industry to GRP exceeds the values of the corresponding indicator in the conservative scenario almost 2-fold. In absolute terms, GVA of the tourism industry will increase from 5.86 billion rubles in 2021 to 23.67 billion rubles in 2030. Optimistic scenario shows that Kamchatka will be able to receive even 950 thousand tourists a year with a multiple increase in economic indicators of the tourism industry (increase in tourist flow by 15% from 2021 to 2027, and then by 25% by the end of the simulation period). At the same time,
it is necessary to consistently develop infrastructure to ensure a comfortable stay of tourists and reduce the negative impact on the landscape. In absolute terms, the volume of GVA of the tourism industry will grow by almost 6-fold and will amount to 35 billion rubles. In a cyclical pandemic, there is a general trend of increasing tourist flow with a drop of 50% every 4 years as the pandemic worsens and recovers to the level of the year before the pandemic. In post-recovery periods, the annual growth rate is 12%.
When considering the results of modeling different scenarios of tourist industry development on the example of Kamchatka Krai, the urgent need to develop infrastructure and tourist attraction points in Kamchatka Krai has been revealed. The most acute problems in increasing the tourist flow include the lack of CAF places and low capacity of most tourist attraction points.
In the course of the study, the methodology for assessing scenarios of tourist industry development based on digital twin technology, developed by FASI “Vostokgosplan”, was designed and tested. We propose a model for the development of the tourism industry, which is a modern digital tool that converts a set of diverse data into a timely and balanced management decision based on an understanding of the current state of the tourism industry and the prospects for its development. Kamchatka Krai was chosen as a pilot region in the project for tourism industry digitalization.
The scientific novelty of the proposed assessment methods is the use of methods of structural and situational dynamics, involving statistical methods of data processing in AnyLogic environment. In contrast to traditional process analytics based on tables and linear dependence, the developed digital twin makes it possible to observe the detailed behavior of the system over time, to keep record of tourist preferences and point capacity, and to make recommendations for the placement of new facilities. After conducting the necessary experiments and obtaining the output data, the optimal scenarios of tourist industry development were found, the weak points were identified and it was determined that the implementation of scenario simulation modeling will allow us to calculate on a regular basis tourist expenditures and, consequently, the tourist industry income, and through multipliers, regional budget
income, and other integral indicators to improve the competitiveness of the tourism industry in Kamchatka Krai.
The proposed methodology of forming scenarios of tourism industry development on the basis of digital twin technology is of particular importance in modern conditions. We have identified a theoretical gap in scientific knowledge, which allows us to justify the need for the development of a simulation scenario-forecast model for the implementation of tourist services. The practical significance lies in the fact that the digital twin allows us to simulate different scenarios for the tourism industry development in Kamchatka Krai, thereby reducing the number of routine business processes and the impact of the human factor on the service quality. The sources of effects in this case are the indicators of attracted investments in commercial infrastructure, the financial results of commercial projects in the territory; investments made in the basic and supporting infrastructure of the region without reference to specific projects; natural indicators, indicating the development of tourism and socio-economic potential of the territory. In conjunction with the sum of budget and social effects, and qualitative indicators of territory attendance, the proposed methodology will strengthen the arguments in favor of the need to develop tourism infrastructure and create new tourist destinations in the region within the Strategy for Tourism Development in the Russian Federation.
References Methodology for assessing scenarios of tourism industry development in Kamchatka krai on the basis of digital twin technology
- Akopov A.S. (2019). Komp’yuternoe modelirovanie [Computer Modeling]. Moscow: Yurait.
- Azrapkin A.I. (2022). Using simulation modeling for assessing socio-economic attractiveness. Informatsionnye sistemy i tekhnologii=Information Systems and Technologies, 2(130), 83–91 (in Russian).
- Belinha J., Jorge R., Dinis L. (2009). Analysis of 3D solids using the natural neighbour radial point interpolation method. Computer Modeling in Engineering & Sciences, 44(1), 1–34. DOI:10.3970/cmes.2009.044.001
- Bolton R.N. et al. (2018). Customer experience challenges: Bringing together digital, physical and social realms. Journal of Service Management. 29(5), 776–808.
- Boschert S., Rosen R. (2016). Digital Twin – the simulation aspect. In: Hehenberger P., Bradley D. (Eds.). Mechatronic Futures.
- Coronado P.D.U., Lynn R., Louhichi W., Parto M., Wescoat E., Kurfess T. (2018). Part data integration in the Shop Floor Digital Twin: Mobile and cloud technologies to enable a manufacturing execution system. Journal of Manufacturing Systems, 48, 25–33.
- Forrester J.W. (1958). Industrial dynamics: A major breakthrough for decision makers. Harvard Business Review, 36(4), 37–66.
- Glaessgen E., Stargel D. (2012). The Digital Twin Paradigm for future NASA and U.S. Air Force vehicles. In: AIAA/ASME/ASME/ASCE/AHS/ASC Structures, Structural Dynamics and Materials. American Institute of Aeronautics and Astronautics.
- Gorelova G.V. (2020). Statement the problem of simulation of decision-making processes in complex organizational-technical systems. Izvestiya YuFU. Tekhnicheskie nauki=Izvestiya SFedU. Engineering Sciences, (211), 134–144 (in Russian).
- Grieves M. (2005). Product lifecycle management: The new paradigm for enterprises. Int. J. Product Development, 2(1/2), 71–84.
- Grieves M. (2016). Origins of the Digital Twin Concept. Working Paper. DOI:10.13140/RG.2.2.26367.61609
- Grieves M., Vickers J. (2017). Digital twin: Mitigating unpredictable, undesirable emergent behavior in complex systems. In: Kahlen F.J., Flumerfelt S., Alves A. (Eds). Transdisciplinary Perspectives on Complex Systems. Cham: Springer.
- Hribernik K.A., Rabe L., Thoben K.D., Schumacher J. (2006). The product avatar as a product-instance-centric information management concept. Int. J. Prod. Lifecycle Manag., 1(4), 367.
- Katalevskii D.Yu., Suslov S.A. (2022). Simulation modeling in complex project management. Ploblemy teorii i practiki uptavlenia=International Journal of Management Theory and Practice, 2, 101–115 (in Russian).
- Kritzinger W., Karner M., Traar G., Henjes J., Sihn W. (2018). Digital Twin in manufacturing: A categorical literature review and classification. IFAC-Papers OnLine, 51(11), 1016–1022.
- Lawson D., Marion G. (2008). An Introduction to Mathematical Modelling. Bioinformatics and Statistics Scotland Given. DOI:10.5860/choice.32-5134
- Lee J., Bagheri B., Kao H.A. (2015). A cyber-physical systems architecture for industry 4.0-based manufacturing systems. Manufacturing Letters, 3, 18–23.
- Meadows D.H., Randers J., Meadows D.L. (2005). Limits to Growth: The 30-Year Update. London: Earthscan.
- Mittal S., Khan M.A., Romero D., Wuest T. (2019). Smart manufacturing: Characteristics, technologies and enabling factors. Proc. of the Institution of Mechanical Engineers, Part B: Journal of Engineering Manufacture, 233(5), 1342–1361. DOI: 10.1177/0954405417736547
- Molodetskaya S.F. (2020). Development of decision support methods under uncertainty. Voprosy upravleniya=Management Issues, 4(65), 102–114 (in Russian).
- Novysh B.V., Yurcha I.A. (2020). Simulation model for assessing the economic potential of regions. Ekonomika. Upravlenie. Innovatsii=Economics. Management. Innovations, 7(1), 88–94 (in Russian).
- Olenev N.N. (2008). Dinamicheskaya balansovaya model’ regional’noi ekonomiki. Materialy IV mezhdunarodnoi nauchnoi konferentsii “Innovatsionnoe razvitie i ekonomicheskii rost” [Dynamic Balance Model of Regional Economy. Proceedings of the 4th International Scientific Conference “Innovative Development and Economic Growth”]. Moscow: RUDN.
- Prokhorov A., Lysachev M. (2020). Tsifrovoi dvoinik. Analiz, trendy, mirovoi opyt [Digital Twin. Analysis, Trends, World Experience]. Moscow: AlyansPrint.
- Saddik A. (2018) Digital twins: The convergence of multimedia technologies. IEEE MultiMedia, 25(2), 87–92. DOI:10.1109/MMUL.2018.023121167
- Savostyanov D.A. (2021). Applying system dynamics to analyze the social and economic benefits of infrastructural projects. Vestnik SamGUPS, 1(51), 36–46 (in Russian).
- Shafto M., Conroy M., Doyle R. et al. (2010). Modeling, simulation, information technology and processing roadmap. Technology Area, 11. Available at: https://www.nasa.gov/pdf/501321main_TA11-MSITP-DRAFT-Nov2010-A1.pdf
- Shpak P.S., Sycheva E.G., Merinskaya E.E. (2020). The concept of digital twins as a modern trend of digital economy. Vestnik Omskogo universiteta. Seriya “Ekonomika”=Herald of Omsk University. Series “Economics”, 1, 57–68 (in Russian).
- Sidorenko V.N. (1998). Sistemnaya dinamika [System Dynamics]. Moscow: MSU Faculty of Economics; TEIS.
- Söderberg R. et al. (2017). Toward a Digital Twin for real-time geometry assurance in individualized production. CIRP Annals, 66(1), 137–140.
- Tao F. et al. (2018). Digital twin-driven product design framework. International Journal of Production Research, 57(1), 1–19. DOI:10.1080/00207543.2018.1443229
