Mining Data to Find Adept Teachers in Dealing with Students

Author: Umesh Kumar Pandey, Saurabh Pal
Journal: International Journal of Intelligent Systems and Applications(IJISA) @ijisa
Article in issue: 3 vol.4, 2012.
Free access
Higher education faculty staffs lack behind any prior training program of teaching. Mostly staffs teach students in his/her ways. They are unaware of the qualities of a teacher which they must possess as how to tackle the problems arising in teaching, what key points must be remembered while teaching etc. This may cause a teacher to be unsuccessful in classroom. So the problem is the amount of knowledge a staff has of a teaching process. Educationist finds few qualities of a good teacher. But their method is qualitative. In this paper a quantitative approach i.e. data mining is used to measure the quality of a teacher and suggest them what qualities they have.
Educational Data mining, Knowledge Discovery, Psychometric test
Short address: https://sciup.org/15010113
IDR: 15010113
Text of the scientific article Mining Data to Find Adept Teachers in Dealing with Students
Published Online April 2012 in MECS
Data mining is a new method of modern technology for information analysis. Data mining is a new type of exploratory and predictive data analysis whose purpose is to delineate systematic relations between variables when there are no (or incomplete) a priori expectations as to the nature of those relations [1].
Rubenking said, “Data mining is a logical evolution in database technology”. [2]
Paper repositories of larger data are very complex. Making conclusion from paper repository is very cumbersome and time taking process. Advent of computer gives a path for machine-led collection and calculation of data.
Data mining, which is the science of filtering databases for information and knowledge retrieval, has recently developed new album of applications and engendered an emerging discipline, called Educational Data Mining or EDM. EDM carries out tasks such as prediction (classification, regression), clustering, relationship mining (association, correlation, sequential mining, and causal data mining), distillation of data for human judgment, and discovery with models [3]. Moreover, EDM can solve many problems based on educational domain. Data mining is non-trivial extraction of implicit, previously unknown and potentially useful information from large amounts of data. It is used to predict the future trends from the knowledge pattern. Remarkable amount of EDM endeavors have been conducted and published in many journals and conference proceedings related to, but not limited to, Artificial Intelligence, Learning Systems, Education, and others.
A tag of war still continues among educationists on poles of education. John Dewy said that education is bipolar process [4].
Education
Student Teacher
Fig 1: Bipolar education system
Another concept is proposed by Raybern. He said that it is the tri-polar process. These three poles are student, teacher and syllabus. Each poles affects to each other. Following figure shows tri-polar education system.
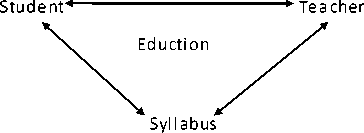
Fig 2: Tripolar education system
In both aspects students and teachers are constantly available. The education flows from teachers to students. In this paper we are focusing on the one pole of education system i.e. teacher. It is tried to establish a model to evaluate the teacher’s teacher ship on the basis of student feedback.
The rest of this paper is organized as follows: Section 2 presents background and history in educational data mining. Section 3 describes the Psychometric test. Section 4 describes the methodology used in our experiments about applying data mining techniques on the educational data. Section 5 illustrates the results obtained. Finally we conclude this paper with a summary and an outlook for future work in Section 6.
-
II. BACKGROUND AND HISTORY
From ancient to modern era teacher’s role always praised for carrying lamp of education from one generation to another. Alexander the great said, “I owe my birth to my father, but life to my teacher.”
Former president of India and education laureate Late Dr. S. Radhakrishnan said about the role of teacher, “The teacher’s place in society is of vital importance. S/he acts as the pivot for the transmission of intellectual traditions and technical skills from generation to generation and helps to keep the lamp of civilization burning.
Humayun Kabir said, “The efficiency of a system of education rests on the quality of teacher. Without good teacher even the best of the system is bound to fail. With good teachers even the defects of the system can be largely overcome.
On challenges face by a teacher in future, Dr. Ballard said, “The teacher of the future will be less concerned with impressing his personality on his pupils than with gaining as much insight as he can into the personalities of his pupils and trying to find in each of them the lamp that illuminates and the spring that motivates.”
In this sequence, around the world a debate started on the quality of the teacher. Educationist tried to establish the measurement criteria for a good teacher, which proves the teachership of a person. In 1913, Dr. F.L. Clapp of United States of America organized a study and established ten measurement criteria for a good teacher [4].
TABLE 1: Dr F.L. Clapp measurement criteria
|
Sr. No. |
Parameter |
|
1 |
Address |
|
2 |
Personal Appearance |
|
3 |
Optimism |
|
4 |
Reserve |
|
5 |
Enthusiasm |
|
6 |
Fairness of mind |
|
7 |
Sincerity |
|
8 |
Sympathy |
|
9 |
Vitality |
|
10 |
Scholarship |
Bagley and Keith of U. S.A. organized another study in which they proposed three new parameters and added into the Dr. F. L. Clapp’s list i.e. Tact, Capacity of leadership and good voice.
Department of education in New York proposed two parameter list of qualities of a teacher [4].
TABLE 2: New York dept of education first MEASUREMENT CRITERIA
|
Sr. No. |
Parameter |
|
G |
Gregariousness |
|
O |
Open-mind ness |
|
O |
Originality |
|
D |
Discernment |
|
T |
Tidiness |
|
E |
Enthusiasm |
|
A |
Adaptability |
|
C |
Cooperativeness |
|
H |
Health |
|
E |
Efficiency |
|
R |
resourcefulness |
TABLE 3: New York dep’T of education second MEASUREMENT CRITERIA
|
Sr. No. |
Parameter |
|
1 |
Thoughtfulness |
|
2 |
Reliability |
|
3 |
Leadership ability |
|
4 |
Integrity |
|
5 |
Tact |
|
6 |
Sense of Humor |
|
7 |
Objectivity |
|
8 |
Fluency |
|
9 |
Ability to do creditable college work |
Several studies used data mining for extracting rules and predicting certain behaviors in several areas of science, information technology, human resources, education, biology and medicine.
For example, Bray [5], in his study on private tutoring and its implications, observed that the percentage of students receiving private tutoring in India was relatively higher than in Malaysia, Singapore, Japan, China and Sri Lanka. It was also observed that there was an enhancement of academic performance with the intensity of private tutoring and this variation of intensity of private tutoring depends on the collective factor namely socio-economic conditions.
Bharadwaj and Pal [6], applied the classification as data mining technique to evaluate student’ performance, they used decision tree method for classification. The goal of their study is to extract knowledge that describes students’ performance in end semester examination. They used students’ data from the student’ previous database including Attendance, Class test, Seminar and Assignment marks. This study helps earlier in identifying the dropouts and students who need special attention and allow the teacher to provide appropriate advising.
Yadav, Bharadwaj and Pal [7] obtained the university students data like attendance, class test, seminar and assignment marks from the students’ database, to predict the performance at the end of the semester using three algorithms ID3, C4.5 and CART and shows that CART is the best algorithm for classification of data.
Researchers like Chein and Chen [8] have worked on the improvement of employee selection, by building a model, using data mining techniques, to predict the performance of newly applicants. Depending on attributes selected from their CVs, job applications and interviews. Their performance could be predicted to be a base for decision makers to take their decisions about either employing these applicants or not.
-
III. PHYCHOMETRIC TEST
Psychometric assessment explores potential in terms of ability, aptitude, personality, intelligence, interest and value systems [9].
A psychological test is an instrument designed to measure unobserved constructs, also known as latent variables. Psychological tests are typically, but not necessarily, a series of tasks or problems that the respondent has to solve [10]. Psychological assessment is similar to psychological testing but usually involves a more comprehensive assessment of the individual. Psychological assessment is a process that involves the integration of information from multiple sources, such as tests of normal and abnormal personality, tests of ability or intelligence, tests of interests or attitudes. Latent variables (as opposed to observable variables) , are variables that are not directly observed but are rather inferred (through a mathematical model) from other variables that are observed (directly measured) [11].
-
IV. METHODOLOGY
Normally no specific evaluation method is available to evaluate teachers’ performance. Rather than using only central value of different group we are using also dispersion method. Because central value gives single value that represents the entire data but did not explain distribution of the central value. In two or more distribution the central value may be the same but still there can be wide disparities in the formation of distribution. Basic purpose of variation is, to determine the reliability of an average, to serve as a basis for the control of the variability, to compare two or more series with regard to their variability. In this paper we used average method for central value tendency and standard deviation to find the distribution of the data. The standard deviation measures the absolute dispersion. A small standard deviation means a high degree of uniformity and a large standard deviation has means just opposite. In our case highest value of average and lowest value of standard deviation will give highest final score [1].
-
A. Data collection
Students are best evaluator of a teacher. At first meeting with the teacher students observe the teacher completely and make picture of his/her quality in his/her mind. Every student have independent picture of teacher’s quality. This is just because of different temperament of student and other factors affecting human relationship. But if we consider their opinion collectively they will give some interesting fact about a teacher. We use student opinion to identify the qualities of teacher. It is toughest work, because students directly do not give correct data about a teacher. In this case a psychometric assessment will organize.
This psychometric test contains a series of question related with the quality of teacher. Educationist proposed a number of qualities which is earlier discussed. Here we prepare different group of qualities which are close to each of them.
TABLE 4: Measurement criteria in form of group
|
Group |
Teacher qu ality |
|
Gr1 |
Gregariousness, cooperativeness |
|
Gr2 |
Open-mindness, discernment, thoughtfulness |
|
Gr3 |
Originality, reliability |
|
Gr4 |
Tidiness, efficiency |
|
Gr5 |
Enthusiasm, ability to leadership |
|
Gr6 |
Adaptability, tact, sense of humor |
|
Gr7 |
Health, good voice, optimistic, personal appearance |
|
Gr8 |
Resourcefulness, fluency |
Every group has two or more characteristic. So meaning and their correlation among characteristic is given below:
-
B. Data tables
Above discussed groups have minimum 10 psychometric questions in each group. These questions answered in either 0 or 1. 0 represents disagree whereas 1 represents agree. This test conducted among the students who have been taught by the teacher. How many points each student has given in each group is stored as shown in table 5.
TABLE 5: Teacher score in each group given by n
NUMBER OF STUDENT
|
Group |
S1 |
S2 |
…………………….. |
S n |
|
Gr1 |
…………………….. |
|||
|
Gr2 |
…………………….. |
|||
|
Gr3 |
…………………….. |
|||
|
Gr4 |
…………………….. |
|||
|
Gr5 |
…………………….. |
|||
|
Gr6 |
…………………….. |
|||
|
Gr7 |
…………………….. |
|||
|
Gr8 |
…………………….. |
TABLE 7: Final score table
|
Group |
Average |
Standard deviation |
Final score (Average -standard deviation) |
|
Gr1 |
|||
|
Gr2 |
|||
|
Gr3 |
|||
|
Gr4 |
|||
|
Gr5 |
|||
|
Gr6 |
|||
|
Gr7 |
|||
|
Gr8 |
In table 5, Gr1, Gr2… Gr8 shows different groups. S1, S2 …Sn that there is n number of students participated in this test.
In this test if, there are 10 questions in each group then a teacher can score maximum 10 marks in each group. Now another table (table 6) is prepared which will store the number of occurrences of score in the table
In table 6 score column contains score could obtained by a teacher. If there is M number of question then a teacher can score maximum M marks. In the case of 10 questions value of M is 10. Frequency column have eight sub columns, which are Gr1 to Gr 8. In these sub columns number of occurrences of scores is recorded.
TABLE 6: Frequency table of a teacher at each score
|
Score |
Frequency |
||
|
Gr1 |
Gr8 |
||
|
1 |
. |
. |
. |
|
. . . . . . . |
. . . . . . . |
. . . . . . . |
. . . . . . . |
|
M |
. |
. |
. |
With the help of table 6 a new table is generated table 7. This table contains four columns i.e. group, average standard deviation and final score. Group column contains all group of teacher quality i.e. Gr1, Gr2…..Gr8. average column contains average score in each group. Standard deviation column contains deviation of student scoring for teachers. Final core is calculated as
Final _ score = Average - S tan dard _ deviation
With the help of table 7 final score is calculated for each teacher. In final score analysis standard deviation is subtracted from the average. Because it is possible, that the two distribution have same mean with different dispersion. Similarly, two distributions have same dispersion but with unequal means. High value of standard deviation express that respondents do not have one opinion and they did not think that actually have this quality. In the case of low value of standard deviation indicates that student strongly express that that the teacher has this quality. If any, organization has P number of teaching faculty then organization can collect scores of each teacher store as per table 8. This table has three columns i.e. Teacher, group and Max (TP). Find out the maximum scoring group of a single teacher in row and in columns to find out maximum scoring teacher among the teachers in each group.
TABLE 8: All teacher group score tally table
|
Teacher |
Group |
Max(Gr) |
||
|
Gr1 |
Gr2 ................. |
Gr8 |
||
|
T1 |
. |
. |
. |
. |
|
.T2 . . . . |
. . . . . |
. . . . . |
. . . . . |
. . . . . |
|
TP |
. |
. |
. |
. |
|
Max (TP) |
. |
. |
. |
. |
-
V . ILLUSTRATION
In the table 9 final score of a teacher is shown. In this table final score is subtraction of average and standard deviation. A comparative study of group 2 and group 4 shows that values of standard deviation and average score of group 2 is less than group 4. Because of high standard deviation the final score of group 2 is higher than group 4. Another point is that standard deviation of group 8 is lowest among values . It indicates that maximum student is around the central value and they strongly recommends that teacher has this group of quality. Similarly, group 4 has highest standard deviation. It indicates that respondents do not give response around the average. High value of standard deviation reduces the average heavily; on the other hand low value of standard deviation has low impact.
TABLE 9: Final score table of individual teacher
|
Group |
Avera ge |
Standard deviation |
Final Score |
|
Grl |
4.75000 |
1.87639 |
2.873 61 |
|
Gr2 |
5.31667 |
1.85734 |
3.45932 |
|
Gr3 |
5.08333 |
1.86070 |
3.22263 |
|
Gr4 |
5.36667 |
1.9 7203 |
3.39464 |
|
Gr5 |
6.61667 |
1.57445 |
5.04222 |
|
Gr6 |
4.45000 |
1.57445 |
2.87555 |
|
Gr7 |
7.08333 |
1.41382 |
5.66951 |
|
Gr8 |
7Д1667 |
1.22429 |
6.19238 |
We represented group score tally of 8 teachers in table 10. This table is final table and prepared after calculating final score from subtraction of average and standard deviation of all teachers at individual level. T1, T2, T3…….T8 are 8 different teacher where as Gr1, Gr2…..Gr8 represent all 8 group of measurement criteria of good teacher. From this table we can say that T1 has Gr8 quality, T2 has Gr7 quality, T3 has Gr4 quality, T4 has Gr3 quality, T5 has Gr6 quality, T8 has Gr1 quality. While going to assign a job a administrator can see group score of individual teacher and then assign job to the teacher. This will help in organizing and managing student.
TABLE 10: Example of 8 teacher group score tally TABLE
|
Teacher |
Group |
||||||||
|
Grl |
Gr2 |
03 |
Gr4 |
OS |
M |
Grl |
03 |
Max(Gr| |
|
|
T1 |
2^ 7361 |
3 45932 |
3 22263 |
3.39464 |
5.04222 |
2.87555 |
5.66951 |
6.19238 |
6.19238 |
|
T2 |
345932 |
456783 |
237555 |
45 6783 |
456783 |
3.39464 |
536271 |
5.04222 |
5.86271 |
|
В |
3.22263 |
6.21111 |
5.66951 |
63 7986 |
6.09875 |
5.04222 |
3.54356 |
553241 |
6.87986 |
|
T4 |
339464 |
553241 |
6.35671 |
553241 |
5.98784 |
5.67849 |
4.56783 |
5.90912 |
6.35671 |
|
15 |
5.04222 |
4.93245 |
354356 |
5.04222 |
3.39464 |
5.98784 |
3.39 4 64 |
5.98784 |
5.98784 |
|
Тб |
23 7555 |
4.68732 |
456783 |
237555 |
5.04222 |
3.54356 |
5.04222 |
439765 |
5.04222 |
|
п |
5.66951 |
553241 |
5.98733 |
5.66951 |
439765 |
4.56783 |
439765 |
4.67895 |
5.98733 |
|
TS |
6.19238 |
4.98786 |
553241 |
6.19238 |
4.67895 |
5.53241 |
4.67895 |
3.39464 |
6.19238 |
|
Мах(Т) |
6.19238 |
6.21111 |
6.35671 |
63 7986 |
6.09875 |
5.98784 |
536271 |
6.19238 |
|
Education laureates spell various teaching qualities. These qualities are divided into eight groups. If a teacher scores lowest number in any group it indicates that s/he does not possess qualities of that group and high score means just opposite. So a teacher must try to achieve the higher score by changing his attitude and behavior towards the student. If there are more than one teacher, a comparative table must be prepared which will help the administrator to choose adept teacher to perform the given duty.
References Mining Data to Find Adept Teachers in Dealing with Students
- Luan J, “Data Mining and its Application in Higher education”, SPSS Executive Report, 2002.
- Rubenking “Hidden Messages”, PC Magzine, May 22, 2001.
- Romero C and Ventura S, “Educational Data Mining: A survey from 1995 to 2005” expert system with Application 33, pp.135-146, 2007.
- Sukhia S.P. “Educational Administration, Organization and Health Education” Agrawal Publishers, Agra, India, 2005.
- M. Bray, The shadow education system: private tutoring and its implications for planners, (2nd ed.), UNESCO, PARIS, France, 2007.
- B.K. Bharadwaj and S. Pal. “Mining Educational Data to Analyze Students’ Performance”, International Journal of Advance Computer Science and Applications (IJACSA), Vol. 2, No. 6, pp. 63-69, 2011.
- S. K. Yadav, B.K. Bharadwaj and S. Pal, “Data Mining Applications: A comparative study for Predicting Student’s Performance”, International Journal of Innovative Technology and Creative Engineering (IJITCE), Vol. 1, No. 12, pp. 13-19, 2011.
- Chein, C., Chen, L."Data mining to improve personnel selection and enhance human capital: A case study in high technology industry", Expert Systems with Applications, In Press, 2006.
- http://www.assessmind.com/
- http://en.wikipedia.org/wiki/Psychological_testing
- http://en.wikipedia.org/wiki/Latent_variables.
- Gupta S.P., “Statistical Methods”, S. Chand & Sons Educational Publishers New Delhi, 2007.
