Mining the Shirt Sizes for Indian Men by Clustered Classification

Author: M. Martin Jeyasingh, Kumaravel Appavoo
Journal: International Journal of Information Technology and Computer Science(IJITCS) @ijitcs
Article in issue: 6 Vol. 4, 2012.
Free access
In garment production engineering, sizing system plays an important role for manufacturing of clothing. The standards for defining the size label are a critical issue. Locating the right garment size for a customer depends on the label as an interface. In this research work intend to approach that it could be used for developing sizing systems by data mining techniques applied to Indian anthropometric dataset. We propose a new approach of two-stage data mining procedure for labelling the shirt types exclusively for Indian men. In the first stage , clustering technique applied on the original dataset, to categorise the size labels. Then these clusters are used for supervised learning in the second stage for classification. A sizing system classifies a specific population into homogeneous subgroups based on some key body dimensions. The space with these dimensions gives raise to complexity for finding uniform standards. This enables us to have an interface as a communication tool among manufacturers, retailers and consumers. This sizing system is developed for the men’s age ranges between 25 and 66 years. Main attribute happens to be the chest size as clearly visible in the data set. We have obtained classifications for men’s shirt attributes based on clustering techniques.
Data Mining , Clustering, Classifiers, IBK KNN, Logitboost, Clothing industry, Anthropometric data
Short address: https://sciup.org/15011696
IDR: 15011696
Text of the scientific article Mining the Shirt Sizes for Indian Men by Clustered Classification
Published Online June 2012 in MECS
-
I. Introduction
Garment sizing systems were originally based on those developed by tailors in the late 18th century. Professional dressmakers and craftsmen were developed various sizing methods in the past years. They used unique techniques for measuring and fitting their customers. In the 1920s, the demand for the mass production of garments created the need for a standard sizing system. Many researchers started working on developing sizing system by the different methods and data collecting approaches. It has proved that garment manufacturing is the highest value-added industry in
textile industry manufacturing cycle [1]. Mass production by machines in this industry has replaced manual manufacturing, so the planning and quality control of production and inventory are very important for manufacturer. Moreover, this type of manufacturing has demand to certain standards and specifications. Furthermore each country has its own standard sizing systems for manufacturers to follow and fit in with the figure types of the local population.
A sizing system classifies a specific population into homogeneous subgroups based on some key body dimensions [2]. Persons of the same subgroup have the garment size. Standard sizing systems can correctly predict manufacturing quantity and proportion of production, resulting more accurate production planning and control of materials [3, 4]. The standard unique techniques for measuring and fitting their sizing systems have been used as a communication tool among manufacturers, retailers and consumers.
It can provide manufacturers with size specification, design development, pattern grading and market analysis. Manufacturers, basing their judgments on the information, can produce different type of garments with the various allowances for specific market segmentation. Thus, establishing standard sizing systems are necessary and important. Many researchers worked on developing the sizing system are necessary and important by many approaches. They found very extensive data were made by using anthropometric data [2].People have changed in body shape over time. Workman [5] demonstrated that the problem of ageing contributes to the observed changes in body shape and size, more than any other single factor, such as improved diet and longer life expectancy [6]. Sizing concerns will grow as the number of ageing consumers is expected to double by the year 2030. This presents a marketing challenge for the clothing industry since poor sizing is the number one reason for returns and markdowns, resulting in substantial losses. Therefore, sizing systems have to be updated from time to time in order to ensure the correct fit of ready-to-wear apparel. Many countries have been undertaking sizing surveys in recent years. Since sizing practices vary from country to country, in 1968 Sweden originated the first official approach to the International Organization for Standardization (ISO) on the subject of sizing of clothing, it being in the interest of the general public that an international system be created. After lengthy discussions and many proposals, members of technical committee TC133 submitted documents relating to secondary body dimensions, their definitions and methods of measuring. This eventually resulted in the publication of ISO 8559 ‘Garment Construction and Anthropometric Surveys - Body Dimension, which is currently used as an international standard for all types of size survey [7].
Figure type plays a decisive role in a sizing system and contributes to the topic of fit. So to find a sizing system, different body types are first divided from population, based on dimensions, such as height or ratios between body measurements. A set of size categories is developed, each containing a range of sizes from small to large. The size range is generally evenly distributed from the smallest to the largest size in the most countries. For men's wear, the body length and drop value are the two main measurements characterizing the definition of figure type. Bureau of Indian Standards (BIS) identified three body heights; short (166 cm), regular (174 cm) and tall (182 cm) [20] recommended the use of the difference in figure types as the classification of ready-to-wears and developed a set of procedures to formulate standard sizes for all figure types. In early times, the classification of figure types was based on body weight and stature. Later on, anthropometric dimensions were applied for classification. This type of sizing system has the advantages of easy grading and size labeling. But, the disadvantage is that the structural constraints in the linear system may result in a loose fit. Thus, some optimization methods have been proposed to generate a better fit sizing system, such as an integer programming approach [10] and a nonlinear programming approach [11]. For the development of sizing systems using optimization methods, the structure of the sizing systems tends to affect the predefined constraints and objectives. Tryfos [10] indicated that the probability of purchase depended on the distance between the sizing system of a garment and the real size of an individual. In order to optimize the number of sizes so as to minimize the distance, an integer programming approach was applied to choose the optimal sizes. Later on, McCulloch, et al. [11] constructed a sizing system by using a nonlinear optimization approach to maximize the quality of fit. Recently, Gupta, et al. [12] used a linear programming approach to classify the size groups. Using the optimization method has the advantages of generating a sizing system with an optimal fit, but the irregular distribution of the optimal sizes may increase the complexity in grading and the cost of production. On the other hand, in recent years, data mining has been widely used in area of science and engineering. The application domain is quite broad and plausible in bioinformatics, genetics, medicine, education, electrical power engineering, marketing, production, human resource management, risk prediction, biomedical technology and health insurance. In the field of sizing system in clothing science, data mining techniques such as neural networks [13], cluster analysis [14], the decision tree approach [15] and two stage cluster analysis [16] have been used. Clustering is the classification of objects into different groups, or more precisely, the partitioning of a data set into subsets (clusters), so that the data in each subset (ideally) share some common trait. Cluster analysis was used as an exploratory data analysis tool for classification. In the clothing a cluster which is typically grouped by the similarity of its members’ shirt sizes can grouped by the K-means cluster analysis method to classify the upper garment sizing system. The pitfall of these methods is that it requires one to pre-assign the number of clusters to initialize the algorithm and it is usually subjectively determined by experts. To overcome these disadvantages, a two stagebased data mining procedure include cluster analysis and classification algorithms, is proposed here to eliminate the requirement of subjective judgment and to improve the effectiveness of size classification[8].
-
II. Data Mining Techniques2.1. Data Preparation
-
2.2. Cluster Analysis:
2.3.3.Logitboost
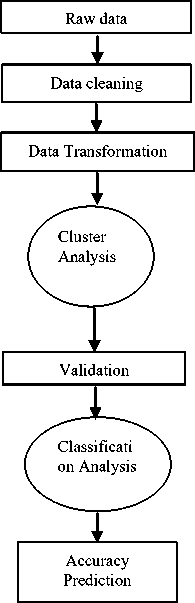
After the definition of industry problem, first stage of data mining, data preparation selected to increase the efficiency and ensure the accuracy of its analysis through the processing and transformation of the data. Before starting to mine the data, they must be examined and proceed with all missing data and outliers. By examining the data before the application of a multivariate technique, the researcher gains several critical insights into the characteristics of the data. In this research work, we used an anthropometric database which was collected from BIS and from Clothing industrialists. Anthropometric data of 620 Indian men with the age ranged from 25 to 66 years from the database were obtained. The data mining process as shown Fig.1.
First step of data mining approach was undertaken, X’Means clustering in the cluster analysis. X-Means is K-Means extended by an improve-structure part, In this part of the algorithm the centers are attempted to be split in its region. The decision between the children of each center and itself is done comparing the BIC-values of the two structures. With the difference between the age and the other attributes, we determined the cluster numbers. In the cluster analysis, K-means method implemented to determine the final cluster categorization.
fitting, the rest for growing the tree. (Default: 0, no back fitting) .
In this classifier the class for performing additive logistic regression. This class performs classification using a regression scheme as the base learner, and can handle multi-class problems. Can do efficient internal cross-validation to determine appropriate number of iterations. This classifier may output additional infomation to the console, threshold on improvement in likelihood, the number of iterations to be performed, number of runs for internal cross-validation, weight threshold for weight pruning (reduce to 90 for speeding up learning process) are parameterised, numFolds -number of folds for internal cross-validation (default 0 means no cross-validation is performed) to be specified.
Fig. 1 Data mining process
-
III. Data description3.1. Description of Dataset
-
2.3. Classification Techniques
-
2.3.1. K-nearest neighbour
-
-
2.3.2. Random Tree
-
3.2. Data source
-
3.3. The Application of Data Mining
Data processing : The data types like nominal(text), numeric or the missing data has been filled with meaningful assumptions in the database. Database specification with description and table structure as shown in Table 1.
K-nearest neighbour algorithm (K-nn) is a supervised learning algorithm that has been used in many applications in the field of data mining, statistical pattern recognition, image processing and many others. K-nn is a method for classifying objects based on closest training examples in the feature space. The k-neighbourhood parameter is determined in the initialization stage of K-nn. The k samples which are closest to new sample are found among the training data. The class of the new sample is determined according to the closest k-samples by using majority voting [9]. Distance measurements like Euclidean, Hamming and Manhattan are used to calculate the distances of the samples to each other.
In this classifier the class for constructing a tree that considers K randomly chosen attributes at each node. It performs no pruning. Also has an option to allow estimation of class probabilities based on a hold-out set (back fitting). Sets the number of randomly chosen attributes by K Value. To allow the unclassified instances, maximum depth of the tree, the minimum total weight of the instances in a leaf and the random number seed used for selecting attributes could parameterised, numFolds -- Determines the amount of data used for back fitting and one fold is used for back
TABLE 1. SPECIFICATION OF DATABASE
|
Field No. |
Field Name |
Description |
Data Type |
|
1 |
Age |
To refer the age |
Numeric |
|
2 |
Back length |
To refer the back length |
Numeric |
|
3 |
Front length |
To refer the front length |
Numeric |
|
4 |
Shoulder length |
To refer the shoulder length |
Numeric |
|
5 |
Chest girth |
To refer the chest girth |
Numeric |
|
6 |
Waist length |
To refer the waist length |
Numeric |
|
7 |
Hip |
To refer the hip |
Numeric |
|
8 |
Sleeve length |
To refer the sleeve length |
Numeric |
|
9 |
Arm depth |
To refer the arm depth |
Numeric |
|
10 |
Cuff length |
To refer the cuff length |
Numeric |
|
11 |
Cuff width |
To refer the cuff width |
Numeric |
|
12 |
Label |
To refer the Size labels |
Nominal (Text) |
For this experiments we have chosen a dataset from BIS based dataset which has total of 620 records. These records has existing measurements authorized by anthropometric experts. Then this records has been preprocessed, then two stage mining process executed to acquire the performance accuracy table.
Data mining could be used to uncover patterns. The increasing power of computer technology has increased data collection and storage. Automatic data processing has been aided by computer science, such as neural networks, clustering, genetic algorithms, decision trees, Digital printing and support vector machines. Data mining is the process of applying these methods to the prediction of uncovering hidden patterns [18]. It has been used for many years by businesses, scientists to sift through volumes of data. The application of data mining in fashion product development for production detect and forecasting analysis by using classification and clustering methods as shown in Fig. 2.
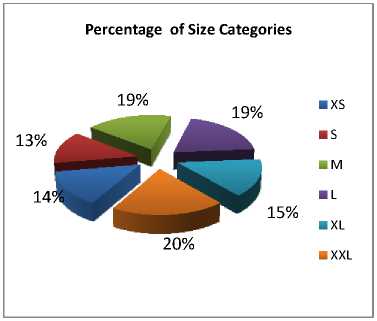
Fig.3. Percentage of size Categories
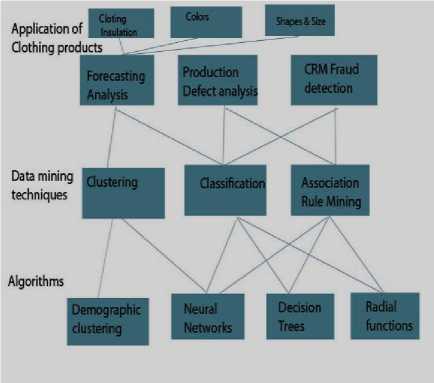
Fig.2 . Application of data mining in Fashion Industry
-
IV. Experimental Results4.1. Distribution of Classes
-
4.2. Experimental Outcomes
This dataset has different characteristics such as: the number of attributes, the number of classes, the number of records and the percentage of class occurrences. Like the test dataset, 620 different types of shirt sizes are broadly categorized in six groups as XS, S, M, L, XL,XXL. The Distribution of Classes in the actual training data for classifiers evaluation and the occurrences as given in Table II. The percentage of size Categories using Pie chart as shown in Fig.3 and after clustered size categories shown in Fig.4.
TABLE II DISTRIBUTION OF CLASSES IN THE ACTUAL TRAINING SET
|
Class Category |
No. of Records |
Percentage of Class Occurrences (%) |
|
XS |
86 |
14 |
|
S |
83 |
13 |
|
M |
115 |
18 |
|
L |
121 |
20 |
|
XL |
93 |
15 |
|
XXL |
122 |
20 |
|
Total |
620 |
100 |
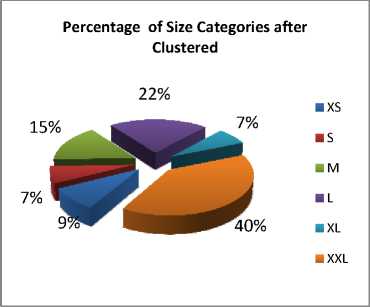
Fig.4. Percentage of size Categories after clustered
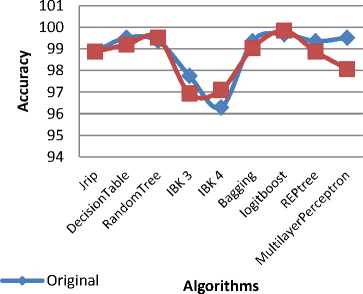
To estimate the performance of the cluster method, we compared the results generated by cluster with the results generated by original sets of attributes for the chosen dataset. In the experiments, the data mining software called weka 3.6.4 which has been implemented in Java with latest windows 7 operating system in Intel Core2Quad@2.83 GHz processor and 2 GB memory, These dataset has been applied and then evaluated for accuracy by using 10-fold Cross Validation strategy [19]. The predicted result values of various classifiers with prediction accuracy as given Table III.The dataset with original features and clustered form of the dataset are classified with the algorithms K-nn[17] with 5 neighbours, Random tree, Logitboost without pruning. Both of the obtained classification results are compared. In each phase of a cross validation, one of the yet unprocessed sets was tested, while the union of all remaining sets was used as training set for classification by the above algorithms. Classifiers with prediction accuracy and difference is given in Table III. Performance of the classifiers as shown in Fig.5. Difference between original and clustered classification accuracy rate has been shown in Fig.6.
TABLE III . CLASSIFIERS WITH PREDICTION ACCURACY
|
Algorithms |
Original |
Clustered |
Difference |
|
Jrip |
98.871 |
98.871 |
0 |
|
DecisionTable |
99.5161 |
99.1935 |
-0.3226 |
|
RandomTree |
99.3548 |
99.5161 |
0.1613 |
|
IBK 3 |
97.7419 |
96.9355 |
-0.8064 |
|
IBK 4 |
96.2903 |
97.0968 |
0.8065 |
|
Bagging |
99.3548 |
99.0323 |
-0.3225 |
|
logitboost |
99.6774 |
99.8387 |
0.1613 |
|
REPtree |
99.3548 |
98.871 |
-0.4838 |
|
MultilayerPerceptron |
99.5161 |
98.0645 |
-1.4516 |
Clustered Classification Results
■ Clustered
Fig.5. Performance of classifiers
Difference between Clustered and original Datasets
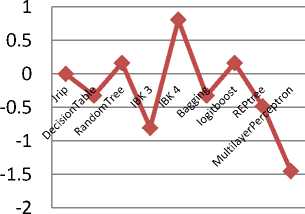
^н— Difference
Fig.6.Comparision between Original Clustered accuracy
-
V. Conclusion
In this research work, Cluster classification method is used to improve and achieve the shirt size grouping by classification accuracy. In the first phase, the dataset has been clustered to acquire the system defined size grouping by clustering. Second phase, we experimented the performance of this approach with the popular algorithms such as K-nn, Jrip, Random tree, decision table, Multilayerperceptron. When one searches for higher accuracy, IBK Knn-4 performance highest among all the other algorithms by comparing the original and clustered classification accuracy rate.
References Mining the Shirt Sizes for Indian Men by Clustered Classification
- Chang, C.F., 1999. “The model analysis of female body size measurement from 18 to 22, J. Hwa Gang Textile, 6: 86-94.
- Fan, J., W. Yu and H. Lawrance, 2004. Clothing appearance and fit: Science and technology, Woodhead Publishing Limited, Cambridge, England.
- Tung, Y.M. and S.S. Soong, 1994. The demand side analysis for Taiwan domestic apparel market, J. the China Textile Institute, 4: 375-380.
- Hsu, K.M. and S.H. Jing, 1999. The chances of Taiwan apparel industry, J. the China Textile Institute, 9: 1-6.
- Workman, J.E., 1991. Body measurement specification for fit models as a factor in apparel size variation, Cloth Text Res. J., 10(1): 31-36.
- LaBat, K.L. and M.R. Delong, 1990. Body cathexis and satisfaction with fit of apparel, Cloth Text Res. J., 8(2): 42-48.
- ISO 8559, 1989. Garment Construction and Anthropometric Surveys - Body Dimensions, International Organization for Standardization.
- R.Bagherzadeh,M.Latifi and A.R.Faramarzi, 2010,Employing a Three-Stage Data Mining Procedure to Develop Sizing System, World Applied Sciences Journal 8 (8): 923-929.
- G.Shakhnarovish,T. Darrell and P. Indyk, 2005, “Nearest Neighbor Methods in Learning and Vision,” MIT Press, Informatics, vol. 37, no. 6, December, 2004, pp. 461-470
- Tryfos, P., 1986. An integer programming approach to the apparel sizing problem, J. the Operational Research Society, 37(10): 1001-1006
- McCulloch, C.E., B. Paal and S.A. Ashdown, 1998. An optimal approach to apparel sizing, J. the Operational Res. Society, 49: 492-499.
- Gupta, D., N. Garg, K. Arora and N. Priyadarshini, 2006. Developing body measurement charts for garments manufacture based on a linear rogramming approach, J. Textile and Apparel Technology and Management, 5(1): 1-13.
- She, F.H., L.X. Kong, S. Nahavandi and A.Z. Kouzani, 2002. Intelligent animal fiber classification with artificial neural networks, Textile Research J., 72(7): 594-600.
- Moon, J.Y. and Y.N. Nam, 2003. A study the elderly women’s lower body type classification and lower garment sizing systems, Proceedings of International Ergonomics Association Conference.
- Hsu, C.H. and M.J. Wang, 2005. Using decision tree based data mining to establish a sizing system for the manufacture of garments, International J. Advanced Manufacturing Technol., 26(5& 6): 669-674.
- Meng, J.C., L. Hai and J.J.W. Mao, 2007. Thedevelopment of sizing systems for Taiwanese elementary- and high-school students, International J. Industrial Ergonomics, 37: 707-716.
- J. R.Quinlan, 1993, “C4.5: Programs for machine learning,” San Francisco, CA: Morgan Kaufman.
- Liang Xun, 2006,Data Mining:Algorithms and Application. Beijing university Press: pp.22-42.
- Stephan White, 2004, Enhancing the academic learning opportunities for all students. Such a plan Examination of the Meta-Analytic Evidence, in School Desegregation .. at 68, 68–72;.
- Bureau of Indian Standards(BIS),Indian standard size designation of clothes definition and body measurement procedure,ICS 61.020,IS 14453:1997.
- Winifred Aldrich,2008,Metric Pattern cutting for Menswear,Fourth Edition, Blackwell publishing, ISBN-978 1405 10278 0,10-15.
