Model Driven Approach for Test Data Optimization Using Activity Diagram Based On Cuckoo Search Algorithm

Author: Rajesh Ku. Sahoo, Durga Prasad Mohapatra, Manas Ranjan Patra
Journal: International Journal of Information Technology and Computer Science(IJITCS) @ijitcs
Article in issue: 10 Vol. 9, 2017.
Free access
Model-driven testing is a method to verify the requirement specification of the system through UML models. Cuckoo search (CS) algorithm is based on the brooding characteristics of cuckoo birds. The test case generation process is used to identify the test cases with resources with critical domain requirements. This proposed paper emphasizing on the generation and optimization of test cases or test data using cuckoo search technique through a case study, i.e., the withdrawal operation in a Bank ATM and it also describes the generation of test cases from UML behavioral diagram like activity diagram, possible test paths are also generated through activity diagram graph.
Model-driven testing, Cuckoo search algorithm, test case generation, test case optimization, UML
Short address: https://sciup.org/15012693
IDR: 15012693
Text of the scientific article Model Driven Approach for Test Data Optimization Using Activity Diagram Based On Cuckoo Search Algorithm
Published Online October 2017 in MECS
Software testing is an approach, which performed during the software development and it is carried by a sequence of instructions of test inputs followed by expected output. It is based on the test cases or test data which measures quality and reliability of a software. The testing method is specified by to select the test case as input and analyze the results [1]. In the automated testing environment, test cases are executed and generate the report of test cases which gives accurate and better results [7]. Automatic test case generation reduces the time, cost and test coverage criteria. Different meta-heuristic algorithms are applied to generate the automated test cases or test data like a genetic algorithm, Particle swarm optimization algorithm and bee colony techniques[8].The proposed approach focuses on the redundancy issues, challenges in generation and optimization of test cases. In model-driven testing, the test cases are generating from models [9].Models represents the overall descriptions of a system and also explain how different components of the models are interrelated with each other.
Cuckoo search (CS) algorithm is used to optimize the random test cases. According to this algorithm, each cuckoo bird continuously laid their eggs in other host bird’s nest. The host birds will either destroy the eggs or throw away their eggs after recognizing the cuckoo’s eggs and built her nest in other places. The nests with the high quality of eggs will survive and move through the next generation. Each egg in the nest of the host bird having a solution and each cuckoo's egg is having a new solution The main objective of the cuckoo search method is replacing the new better solution with the eggs available in a nest with not so good solution. Moreover, this proposed method inspires the developers to generate random test cases to improve the design quality and it is intended to present the result of the outcome of CSA to get the optimum solution in software construct. Optimization can be defined as to generate the best solution under given circumstances. It is used to maximize or minimize the functional value which may be local optimum or global optimum. This proposed paper explains the possible test path generation from activity diagram graph which retrieves from the UML model like activity diagram and optimizes the test cases or test data by using Cuckoo Search method.
The rest of the paper is organized as follows. Section II discusses basics of software testing, model-driven testing, overview of cuckoo search(CS)algorithm.Section III is for related work, and Section IV represents the proposed systems, and methodology and working principle of proposed approach. Section V focuses on the simulation results and possible path generation from activity diagram graph by taking an example of withdrawal task of an ATM. Section VI focuses on the discussion and future scope and Section VII concludes the paper.
-
II. Basic Concepts
Software testing is an important technique used to design the quality software. Manual testing detects faults and failures of software which is a time-consuming and expensive process by using testing tools through manually [20]. Automated testing is better than manually testing due to the test cases are generated automatically using automated testing tools. Various meta-heuristic search-based optimization techniques are used for generating and optimizing the test cases or test data. Generally, path oriented techniques are used to identify the paths through control flow graph (CFG) and generate the appropriate test cases.
Model-driven Testing (MDT) is used to extract the test cases from different UML models. Unified modeling language (UML) provides the static and dynamic behavior of the system[16].Class, deployment, and component diagram represent the static diagram whereas sequence, activity and state chart diagram are represented through the dynamic behavior of the system. UML is used for business, data and control flow modeling. The benefits of UML is for its simplicity and easy to understand the system logic [9, 17]. UML models are used to give the most vital source of information to design the test cases, which reduce the cost and effort of testing.
Cuckoo Search is a nature inspired, stochastic method that introduced by Xin-she Yang and Suash Deb in the year 2009[5, 6].It is stimulated by obliging the parasitic behavior of cuckoo bird. The cuckoo bird is laying their eggs randomly in other birds nest. If the host bird recognizes that some eggs which are available in her nest are not known. So simply she may hurl these eggs on the ground and construct the new nest in another place. Each egg of the host bird represents a solution and the cuckoo egg having a new solution. To distract the host birds’ attentions, the Tapera cuckoo keeps an egg in place of the host bird eggs [6]. Cuckoo lays the eggs randomly through levy flight technique. In CSA method if the fitness value of a cuckoo egg is found to be greater than the selected egg available in host nest then the poor solution is discarded. The objective of this technique is that to replace the not so good solution with a better solution in the host birds’ nest.
-
III. Related Work
Abdul Rauf et al. [4] have made the comparative studies of various approaches of test cases design principles along with the application of PSO on software testing. Kaur et al. [3] described how the hybrid particle swarm optimization (HPSO) algorithm is used efficiently in regression testing. This algorithm is a combination of particle swarm optimization (PSO) method and Genetic Algorithms (GA) which generate the optimal solution. According to S. Shrivastava et al. [14] model-based testing is used to derive the test cases from different models which uses the source code of that model. Biswal et al.[2] focused on the scenarios of test cases which are derived from activity diagram and the activity diagram may be converted into control flow graph(CFG).Each node represent the activity and the edges of graph describes the control flow activities. Bharati Suri [10] explained the ant colony optimization algorithm which is used for selection and prioritization of test cases. It is useful for choose the optimal solution and reduce the test suite size. Swain et al. [11] focused on the strategy which gives information after combining use case and sequence diagram for generating the test cases. A.V.K.Shanthil and G.Mohan Kumar[12]explained about the generation of test cases through sequence diagram by using a genetic algorithm where best test cases are optimized and validated. Generated test cases from sequence diagram extract the information to generate the path from sequence dependency table (SDT). According to P.Samuel et al. [13] model-based testing starts with the design phase, faults are detected through this method which reduces time and effort. Test cases are generated through UML state chart diagram and the diagram is converted into state chart diagram graph. Sahoo et al. [15] described how the test data are generated and optimized by using hybrid bee colony algorithm through the combinational UML diagram like state-chart sequence diagram graph. This algorithm takes less iteration to optimize the test data as compare to particle swarm and bee colony algorithm through SCSEDG graph. Then the system graph is traversed by depth first search (DFS) to generate the possible path.P.N. Baghdad et al. [16] explained how UML models are an important source which gives information about the design of test cases and also improves the quality of software design. Sahoo et al. [20] focused on how the test cases are generated and optimized by different meta-heuristic algorithms like harmony search, Particle swarm optimization and bee colony algorithms. In this paper bee colony algorithm generated the optimized test cases efficiently with less iteration in comparison to HSA and PSOA. Namita.K and Chhilar.R.S [22] proposed a method to generate and optimize the test cases from combinational system diagram graph which integrates the sequence and state chart diagram graph. Genetic algorithm is applied on the system graph for test case optimization. Ajay. K.J. et al. [23] introduces a technique for generating the test cases from activity diagram. Activity dependency table is converted in to activity flow graph then genetic algorithm is applied for generation and optimization of test cases. Singh. A. et al. [24] explained about the hybrid genetic particle swarm system algorithm (HGPSTA) designed for fitness function operates by dominant relation of nodes which are connected through flow coverage. As compared to the above works the proposed work is focused on the generation of test cases from activity diagram and the selected paths are generated from activity diagram graph. As compared to the above works the proposed work is focused on the generation of test cases from activity diagram and the selected paths are generated from activity diagram graph. Sahoo et al. [25] explained how the automated test data are generated by harmony search algorithm by taking an example of ATM withdrawal operation. Sahoo et al. [26] described how the automated test cases are generated and optimized by firefly algorithm through the withdrawal operation of an ATM.
-
IV. Proposed Approach
Model-driven testing approach can be used for both generation and maximization of test cases to achieve the goals. The proposed approach is a hypothesized technique for maximized the test cases based on UML activity diagram. Selected possible test paths are generated from activity diagram graph. It also implements for evaluating its efficiency and effectiveness using the test cases which are optimized through cuckoo search algorithm.
-
A. Necessity of Proposed System
The proposed system is intended to generate an automatic and optimized test case with existing approaches of Cuckoo Search. First of all the system may be initialized with host bird nests. Each host nest maintains its own prevailing location on the basis of which the test cases may be generated. This paper also finds out the effectiveness of the proposed approach to generate the test cases and also generates the possible paths of withdrawal operation of an ATM using activity diagram graph. Activity diagram graph (ADG) is constructed from activity behavioral diagram.
-
B. Proposed Approach and Working of Proposed Approach
In the proposed Cuckoo search technique, the Host bird’s egg in a nest symbolizes the candidate solution while cuckoo’s egg emphasizes on possible new solution. The objective of this test is to replace a new better egg of the cuckoo bird, so that it replaces not so good solutions with best solutions. The advantages of this algorithm are for its implementations in complex functions with mixed, random and discrete values.
The flow chart of Cuckoo Search is depicted in Fig. 1.

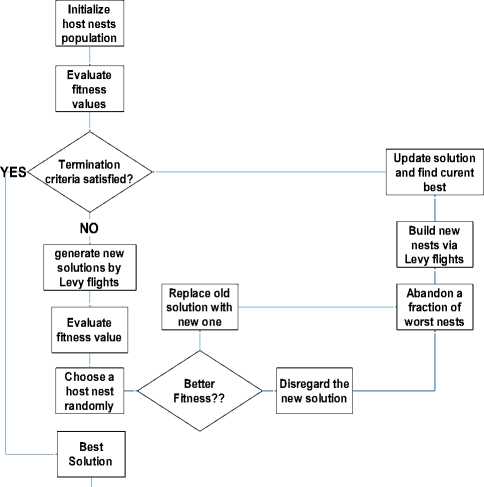
Fig.1. Flow chart of cuckoo search algorithm

-
C. Conversion of Activity Diagram into Activity Diagram Graph
UML activity diagram represents the various operational and designing views of the process in the software design [17]. Activity diagram graph (ADG) is constructed from activity diagram which consists of nodes and edges. Nodes are having one edge which points to another node. Branches have more than one outgoing edges. Nodes, edges, branches satisfy the coverage criteria of the activity diagram graph. It is calculated through the number of elements covered in a test case. The proposed approach defines the possible test paths from activity diagram graph (ADG) using the case study i.e. withdrawal operation of an ATM. The test cases or test data’s are optimized through cuckoo search technique. The activity diagram and the activity diagram graph of withdrawal operation of an ATM are represented through “Fig.2” and “Fig.3”.The operations of withdrawal operations of an ATM performed by the activity diagram Graph (ADG) which represents in Table:-1.
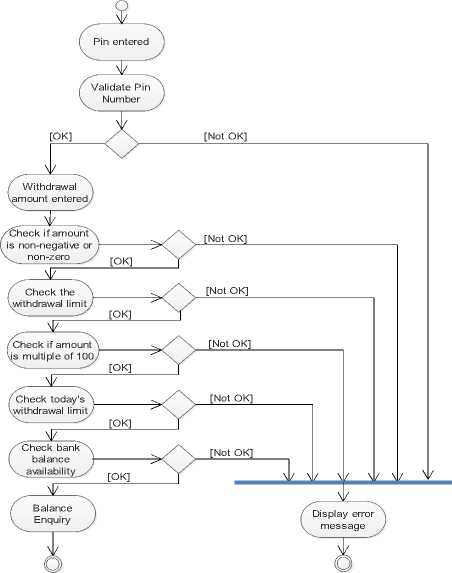
Fig.2. Activity Diagram of Withdrawal operation of ATM
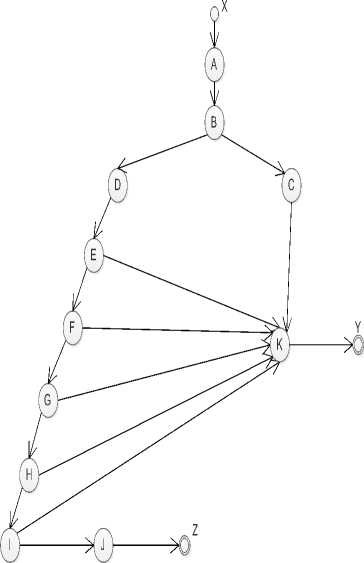
Fig.3.Activity Diagram Graph (ADG) of Withdrawal operation of ATM
Table 1.The operations performed by ATM through Activity Diagram Graph (ADG)
|
Node |
Operation |
Output |
Dependency |
Input |
Expected outputs |
|
A |
Pin number inserted |
1(B) |
X |
User prompts to enter pin number |
B: Pin number is forwarded for validation |
|
B |
Validate pin number |
2 (C,D) |
A |
Pin number provided by the user |
D: Valid pin number |
|
C: Invalid pin number |
|||||
|
C |
Invalid pin entered |
1 (K) |
B |
Incorrect pin number message |
Y: Message displayed for incorrect pin number |
|
D |
Withdrawal amount entered |
1 (E) |
B |
User prompts to enter withdrawal amount |
E: Amount is forwarded to be checked |
|
E |
Check if amount is non-negative or non-zero |
2 (F,K) |
D |
Amount entered by the user |
F: Amount is forwarded for further checking |
|
J: Invalid amount |
|||||
|
F |
Check withdrawal limit |
2 (G,K) |
E |
Amount entered by the user |
G: Amount is forwarded for further checking |
|
J: Invalid amount |
|||||
|
G |
Check if amount is a multiple of 100 or not |
2 (H,K) |
F |
Amount entered by the user |
H: Amount is forwarded for further checking |
|
J: Invalid amount |
|||||
|
H |
Check today’s withdrawal limit |
2 (I,K) |
G |
Amount entered by the user |
I: Amount is forwarded for further checking |
|
J: Invalid amount |
|||||
|
I |
Check bank balance availability |
2 (J,K) |
H |
Amount entered by the user |
K: Amount is checked |
|
J: Invalid amount |
|||||
|
J |
Balance enquiry |
1 (Z) |
I |
Remaining balance after withdrawal operation |
Z: Correct final result |
|
K |
Display error message |
1 (Y) |
C,E,F,G,H,I |
Invalid input |
Y: Message displayed for incorrect withdrawal amount |
X is defined as the starting node. Y and Z are defined as the end nodes where Y is the end node with Unsuccessful result and Z is the end node with Successful result. A, B, C, D, E, F, G, I, J and K are the intermediate nodes describing various operations or activities occurring within the system during operational execution.
-
D. Generation and Optimization of test cases or test data
After creating ADG graph, next step is to generate and optimize the test cases. For optimization purpose various meta-heuristic evolutionary algorithms are used. In this proposed approach the cuckoo search optimization algorithm is used for optimizing the test cases. The test coverage criteria are calculated through optimized test cases.
-
E. CUCKOO SEARCH (Pseudo code of test case or Test data generation by using Cuckoo Search Technique)
Identify all the paths P= {path1, path 2, path3, ….., path n} from starting node to end node
Assign each node in the graph based upon the importance or priority of each node in that graph
Now apply CSA to the State Chart Diagram Graph
Calculate the fitness value of each path of the given graph fx=1/(abs(net_bal-wd_amt)-min_bal)+ε)2
Where ε varies from 0.1 to 0.9
Choose the initial best solution, sort the population based upon the fitness function value.
While generation<500 do for i=1 to no_of_cuckoo
Get a cuckoo randomly by Levy flights
Calculate different parameters
Produce new solution
Check the boundary conditions
Evaluate its fitness value
If(fitness(new)>fitness(old))
then replace the older solution
Calculate Probability of occurrence of each solution
Abandon a fraction of worst nest having probability < pa
Construct new nest at other location through Levy Flight
Check the boundary conditions
Rank the solution and find out the current best
End for
Generation (k) =Generation(k)+1
End While
Select the best solution with the best fitness functional value
The new solution can be calculated as c=x (j) +stepsize(1)
Where x (j) = jth value
Here the step size is defined as stepsize= 0.01*step*((bal-vmin)-x(j));(2)
Where the bal=current account balance vmin=minimum balance step=u/abs(v)^(1/beta)(3)
Where beta=3/2
Other factors can calculated as below:
sigma=(gamma(1+beta)*sin(pi*beta/2)/(gamma((1+beta)/ 2)*beta*2^((beta-1)/2)))^(1/beta);
u=rand()*sigma; v=rand();
Where gamma is defined as the gamma function
-
D. Methodology
The variables in the program code such as net-amt give an idea about the balance amount which is available on account of a customer, wd-amt explains the withdrawal amount, and mini-bal represents the least possible balance in a customer’s account after the withdrawal operation. Test-data and succ-bal represents the valid transactions with the data set which is used during the ATM withdrawal operation. In this case, it is intended to generate and optimize the automated test cases by using cuckoo search algorithm. Initially, each host bird nest is initialized with the current position. Each egg in the nest having one solution and the egg of cuckoo represents the new solution. The better solution is replaced by not so good solution. The Cuckoo bird will search for an optimal solution through Levy Flights. It will keep track of best and worst nests in the population and upgrade its position or location .Optimal solution is used to maximize the mathematical function f(x) which may be implemented in Cuckoo Search method by using MATLAB-7.0 as shown Table 2. In this table the Cuckoo bird’s movement is to find the best solution in the search space. In this case, it is intended to generate optimized test cases from Cuckoo Search algorithm by analyzing through ADG and activity diagram (AD).
Table 2. Fitness Functional Value for each test cases or test data
|
Iteration Number |
Test cases/Test data |
Fitness Function Value |
|
1 |
4800 |
1.5747e-009 |
|
10 |
11100 |
2.7994e-009 |
|
20 |
22200 |
1.6436e-008 |
|
30 |
23800 |
2.6012e-008 |
|
40 |
25800 |
5.6685e-008 |
|
50 |
26400 |
7.7154e-008 |
|
60 |
26700 |
9.1811e-008 |
|
70 |
27500 |
1.5998e-007 |
|
80 |
27900 |
2.267e-007 |
|
90 |
28700 |
5.9161e-007 |
|
100 |
28900 |
8.2613e-007 |
|
110 |
28900 |
8.2629e-007 |
|
120 |
28900 |
8.2629e-007 |
|
130 |
28900 |
8.2621e-007 |
|
140 |
28900 |
8.2628e-007 |
|
150 |
28900 |
8.2618e-007 |
|
160 |
28900 |
8.2609e-007 |
|
170 |
28900 |
8.2626e-007 |
|
180 |
28900 |
8.2621e-007 |
|
200 |
29000 |
9.9947e-007 |
In this case, 20 numbers of sample test cases are considered. The functional value depends on the parametric values of the input variables along with the step size of each cuckoo bird. It was found that the solution reaches its optimum value after 190 iterations with less cpu time.
-
V. Simulation Results
The proposed approach generates the test cases or test data for bank ATM by using evolutionary algorithms like cuckoo search method. The “Fig.4” shows the relation between two variable quantities which are iteration numbers and test data measured along one of a pair of axis represented in Table 2.Table 3 represents the fitness functional value range of test cases or test data of individual candidate solutions in their respective classes in terms of percentage. The proposed approach generates the test case or test data for Bank ATM’s withdrawal operation using cuckoo search algorithm through activity diagram graph(ADG). Every generated test case traverses test paths that contain a set of nodes which is the subset of the original set of nodes. The reduced test cases cover all nodes and edges with traversing the path by DFS algorithm which is implemented in MATLAB 7.There are seven possible number of paths that can be traversed through DFS by using ADG system graph which represents in table 4. Out of which only one path produces an optimal result and rest of the paths do not produce optimal result.
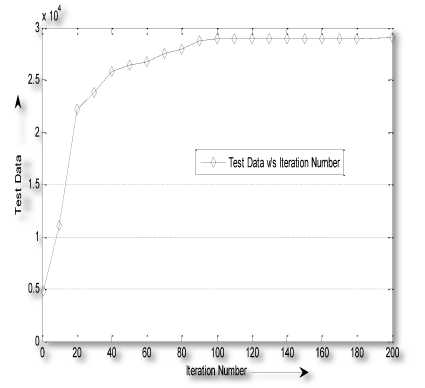
Fig.4. Graphical representation of test data and fitness functional value for table 2
Table 3. %of test data in terms of maximum fitness value
|
Fitness functional value range |
% of test cases/test data |
|
0 ≤ f(x) < 0.3 |
30 |
|
0.3≤ f(x) < 0.7 |
15 |
|
0.7≤ f(x) < 1.0 |
55 |
The above table shows that around 55% test cases or test data are having the higher fitness function f(x) value and lies in between 0.7 and 1.0 and 30% of test data have lower fitness function value f(x) and lie in between 0 and 0.3.”Fig.5” shows a pictorial representation of the relation of two variable quantities like percentage of test cases or test data and fitness value range.
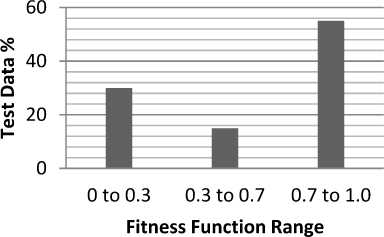
Fig.5. Graphical representation of % test data and fitness value range for Table 2.
Here Path number 1, 2 3, 4, 5 and 6 produces incorrect result and can be labeled as Unsuccessful. Only Path 7 produces optimized solution and can be regarded as Successful which is represented through table 4.
Table 4 shows the detailed coverage of all nodes in each individual path. In this case there are 7 paths in total where X is always the starting node while the end node can be either Y or Z depending upon the outcome. Here m1, m2, m3,.., m11 depicts the message number or id. Different objects used in the ATM operation are labeled as “a”, “b”, “c” and “d” where the customer or the user is denoted as “a”, the user interface or simply the ATM machine is denoted as “b”, the bank database is denoted as “c” and finally the termination or exit operation is denoted as “d”. Starting node is X. First it enters into node A for pin insertion. Here the operation flows from the customer to the ATM machine. So the sender in this case is “a” and the receiver is “b”. Then the pin inserted by the user is checked by comparing it with the database. So control flows from “b” to “c” and the node is labeled as B. If pin is incorrect then it travels to node C and the flow of control is from “c” to “d” and program terminates. After successful verification of the node the user is prompt to enter withdrawal amount in node D. At node D1, the amount checking is initialized. Here E, F, G, H and I describe the amount verification by checking it with various constraints. So the control flow is always from “b” to “c”. In any case if the amount is found to be wrong then it stops further checking and travels to node K to print error message. If all the constraints are satisfied, then it travels to node E where successful amount verification message is displayed on the ATM console. At last the transaction is over and control is transferred from “b” to “d” depicting the termination of operation.
Table 4. Generation of possible paths by using activity diagram graph
|
|
|
|
|
|
|
|
|
State X |
State X |
State X |
State X |
State X |
State X |
State X |
|
A(m1,a,b) |
A(m1,a,b) |
A(m1,a,b) |
A(m1,a,b) |
A(m1,a,b) |
A(m1,a,b) |
A(m1a,b) |
|
B(m2,b,c) |
B(m2,b,c) |
B(m2,b,c) |
B(m2,b,c) |
B(m2,b,c) |
B(m2,b,c) |
B(m2,b,c) |
|
C(m3,c,d) |
D(m4,c,b) |
D(m4,c,b) |
D(m4,c,b) |
D(m4,c,b) |
D(m4,c,b) |
D(m4,c,b) |
|
K(m11,c,d) |
E(m5,b,c) |
E(m5,b,c) |
E(m5,b,c) |
E(m5,b,c) |
E(m5,b,c) |
E(m5,b,c) |
|
State Y > |
K(m11,c,d) |
F(m6,b,c) |
F(m6,b,c) |
F(m6,b,c) |
F(m6,b,c) |
F(m6,b,c) |
|
State Y > |
K(m11,c,d) |
G(m7,b,c) |
G(m7,b,c) |
G(m7,b,c) |
G(m7,b,c) |
|
|
State Y > |
K(m11,c,d) |
H(m8,b,c) |
H(m8,b,c) |
H(m8,b,c) |
||
|
State Y > |
K(m11,c,d) |
I(m9,b,c) |
I(m9,b,c) |
|||
|
State Y > |
K(m11,c,d) |
J(m10,b,d) |
||||
|
State Y > |
State Z > |
-
VI. Discussion and Future Direction
While considering the mathematical function fx=1/(abs(net_bal-wd_amt)+ε)2 ,where ε varies from 0.1 to 0.9, along with the each host nest initialized with the current position it has been found that the optimality of solution keeps track of best quality eggs . By considering some sample test cases it has been observed that the functional value depends upon the parametric values of the input variables and the possible solution created via Levy Flights of Cuckoo birds. The future approach to this work could enhance the model-driven generation of test cases or test data for large programs. The different parameters could be added to the cuckoo search technique which enhances the efficiency and producing the optimized test cases. Another perspective area could be the randomly generated test case or test data and generate the test path by using the combinational UML model. Test Cases can be generated by using various kinds of hybrid meta-heuristic algorithms like PSBCA,FCSA,BCFA, and BCBA. The future scope would be the test case generation by using the fitness functional value which gives better code coverage, statement coverage and maximize path coverage by using hybrid cuckoo Search algorithm which improves the software design quality.
-
VII. Conclusion
In a model-driven approach, the generation of test cases is very useful. Here Cuckoo search algorithm has been discussed to generate the test cases from activity diagram graph which are optimized by taking an example of withdrawal operation by an ATM machine automatically. Test case values are selected based on the fitness functional value. This paper described the fundamental notions of cuckoo search, how the test cases are useful in finding the optimal solution to maximize the problem.
References Model Driven Approach for Test Data Optimization Using Activity Diagram Based On Cuckoo Search Algorithm
- Christian Simons, Emerson Cabrera Paraiso "Regression Test Cases Prioritization using Failure Pursuit Sampling", IEEE,2011.
- Biswal.B.N., Nanda.P., Mohapatra.D.P., 2008 IEEE, "A Novel Approach for Scenario-Based Test Case Generation”, International Conference on Information Technology.
- Kaur Arvinder , Bhatt Divya ,“Hybrid Particle Swarm Optimization for Regression Testing”International Journal of Computer Science and EngineeringIJCSE),Vol.3,No.5,May 2011.
- Rauf Abdul et. al., “Automated GUI test coverage analysis using GA”, Seventh International conference on information technology. IEEE, 2010, pp. 1057-1063.
- X.S.Yang and S.Deb,”Cuckoo Search via Levy flights,”Proc.World Congress on Nature and Biologically Inspired Computing(NaBIC 2009),pp.210-214,2009.
- X.S.Yang and S.Deb,”Cuckoo Search:Recent advances and applications,”Neural Computing and applications,vol.24,no.1,pp.169-174,2013.
- V.Sumalatha,”Model-Based Test Case Optimization of UML Activity Diagrams using Evolutionary Algorithms”,International Journal of Computer Science and Mobile Applications,Vol.2,Issue.11,pp.131-142,2014.
- S.Anand et al.,”An Orchestrated Survey on Automated software test case generation”, Journal of Systems and Software,2013.
- R.K.Swain,V.Panthi and P.K. Behera , "Generation of test cases using activity diagram,"International Journal of computer science and informatics,ISSN 2231-5292 , Vol.3, 2013.
- Suri Bharti , Singhal Shweta(2011)" implementing Ant colony optimization for test case selection and prioritization" International journal of Computer Science and Engineering(IJCSE), India ,pp.1924-1932,2011.
- Santosh Kumar Swain, Durga Prasad Mohapatra and Rajib Mall, "Test case generation based on use case and sequence diagram, International journal of software Engineering , IJSE Vol.3 No-2 July 2010.
- A.V.K.Shanthil and G.Mohan Kumar "Automated Test cases generation from UML sequence diagram", 2012, International conference on software and computer applications (ICSCA.2012) IPCSIT Vol.41(2012) copyright (2012) IACSIT Press,Singapore.
- P. Samuel, R.Mall, A.k.Both , 2008, "Automatic test case generation using unified modeling Language(UML) state diagrams". Published in IET Software.
- S. Shrivastava, S.Kumar, and A.K.Verma ,"Optimal path sequencing in basis path testing, "International journal of Advanced computational Engineering and Networking, ISSN(PRINT);2320-2106,Vol.1, issue.1 , 2013.
- Rajesh Kumar Sahoo, Santosh Kumar Nanda, Durga Prasad Mohapatra, Manas Ranjan Patra, ”Model Driven test case optimization of UML combinational diagrams using Hybrid bee colony algorithm”, International Journal of Intelligent Systems and Applications,Vol.9,No.6,pp.43-54,2017.
- P.N. Boghdady , N.L .Badr , M. Hashem and M.F. Tolba, "A proposed test case generation technique based on activity diagrams, "International Journal of Engineering & Technology IJET-IJEN, Vol.2, No.3.
- Sapna P.G. and Hrushikesha “Automated Scenario Generation based on UML Activity diagrams”, International conference on information technology,IEEE,2008, pp.209-214.
- Wang Linzhang, Yuan Jiesong,Yu Xiaofeng, Hu Jun,Li Xuandong and Zheng Guoliang “Generating Test cases from UML Activity diagram based on Gray- box Method”, Proceedings of the 11th APSEC’04,IEEE.
- Rajesh Kumar Sahoo, Deeptimanta Ojha, Satyabrata Das,”Nature-Inspired Metaheuristic Algorithms-A Comparative Review”,International Journal of Development Research,vol.6,Issue-07,pp.8427-8432,2016,ISSN:2230-9926.
- Rajesh Kumar Sahoo,Deeptimanta Ojha, Durga Prasad Mohapatra,Manas Ranjan Patra,”Automated Test case Generation and optimization:A Comparative Review”,International Journal of Computer Science & Information Technology,Vol.8,No.5,2016.
- Andrea Arcuri, “A Theoretical and Empirical Analysis of the Role of Test Sequence Length in Software Testing for Structural Coverage, ” IEEE Trans.Software Eng., vol.38, no.,2012, pp. 497-519.
- Namita.K and Chhilar.R.S(2016), A novel technique for generation and optimization of generation and optimization of test cases using use case, sequence, activity diagram and genetic algorithm,Journal of Software,Vol.11,No.3,pp.242-250,2016.
- Ajay. K.J, Santosh.K.S and Durga.P. M(2014). A novel approach for test case generation from UML activity diagram. Proceeding of the 2014, International conference on issues and challenges in intelligent computing techniques.
- Singh,A.,Garg,N. and Saini,T., 2014. A hybrid approach of genetic algorithm and particle swarm technique to software Test case generation, International journal of innovations in Engineering and technology, 3(4): 208-214.
- Rajesh Kumar Sahoo,Deeptimanta Ojha, Durga Prasad Mohapatra,Manas Ranjan Patra,”Automatic generation and optimization of test data using harmony search algorithm”,ACITY,pp.23-32,2016
- Rajesh Kumar Sahoo , Durga Prasad Mohapatra, Manas Ranjan Patra ,” A firefly Algorithm Based Approach for Automated Generation and Optimization of Test cases”,International Journal of Computer Sciences and Engineering,vol.4,Issue-8,pp.54-58,ISSN:2347-2693, 2016.
