Модель «Разблокировки социальных достижений»: как ограничения времени использования компаньонов улучшают офлайн-социальную активность и долгосрочное удержание

Автор: Джакия Султана Кея, Саззад Хоссейн, Масума Актер
Журнал: Informatics. Economics. Management - Информатика. Экономика. Управление.
Рубрика: Системный анализ, управление и обработка информации
Статья в выпуске: 4 (4), 2025 года.
Бесплатный доступ
В статье представлена и эмпирически проверена парадигма Social Achievement Unlocking (SAU) - геймифицированный подход, связывающий использование цифровых приложений с офлайн-социальными достижениями. В рандомизированном контролируемом исследовании смешанных методов показано, что участники SAU продемонстрировали более высокие показатели офлайн-социальной активации и на 56,3% меньшее экранное время по сравнению с группой ограничений. Модели Кокса выявили снижение риска рецидива цифровой зависимости на 80,2%. Медиализирующий анализ подтвердил роль внутренней мотивации и автономии в устойчивом изменении поведения. Качественные данные показали, что SAU способствует переосмыслению цифровых привычек и трансформации цифрового благополучия от карательных к мотивирующим стратегиям.
Развитие социальных достижений (SAU), геймификация, цифровое благополучие, поведенческое вмешательство, теория самодетерминации, лонгитюдное исследование.
Короткий адрес: https://sciup.org/14135079
IDR: 14135079 | DOI: 10.47813/2782-5280-2025-4-4-2056-2071
Текст статьи Модель «Разблокировки социальных достижений»: как ограничения времени использования компаньонов улучшают офлайн-социальную активность и долгосрочное удержание
DOI:
In the 21st century, smartphones and other digital helpers are increasingly necessary. Overindulgence might make you feel lonely and uncomfortable. Modern medications don't work frequently since they are so strong. "Social Achievement Unlocking" (SAU) is a game-like system that encourages people to engage with each other in person to help them get over their app addiction. To gain access to the app, do beneficial things in real life. Therefore, people will spend more time in person and behave better online [1]. In the third decade of the modern era, digital channels have made communication easier. However, real social relationships and mental health are becoming worse. More than 80% of people in some wealthy nations possess phones and use them for more than 7 hours a day. This has turned social networking, instant messaging, streaming entertainment, and algorithmic content feeds into habits instead of just choices. Longitudinal studies have associated excessive social media use with adolescent depression, adult anxiety, and widespread loneliness across many demographics. The once-praised promise of digital integration now shows more complex psychological effects [2, 3].
AI-powered algorithms that provide people tailored information, change their behavior by using psychological insights, and improve push alerts have changed the way people engage online. The hyperpersonalized For You Page on TikTok, Instagram Reels, and YouTube's autoplay features are just the beginning of a complex digital system that employs slot machine-like reinforcement schedules to maintain user interest [4-7]. Those who instinctively reach for their devices during periods of boredom, stress, or environmental shifts are more susceptible to being "alone together"—physically present but mentally disengaged [8]. Some academics call this "digital pacification." These problems have led to the creation of digital wellness solutions. This system includes built-in features of OS systems like Apple's Screen Time and Google's Digital Wellbeing, as well as third-party apps like Freedom and Forest that restrict screen time to bring things back into balance. In a deficit model of behavioral control, program timers, lockout features, and use dashboards focus on activities that users must cease or diminish. Recent meta-analyses demonstrate that, despite extensive use, compliance rates decline to around 35% after four weeks, committed users disable almost all capabilities, and subjective well-being and offline social interactions remain unaffected [9, 10].
Fundamental disagreement with habit formation theory leads to ineffectiveness. "Rebound bingeing" happens when previously limited activities intensify after cessation. The phenomenon relates to psychological reactance, the desire to regain lost liberties [11]. These tactics fail to recognize the benefits of social validation, knowledge acquisition, entertainment, and identity maintenance offered by digital companions. Behavioral economists call it a "hedonic deficit" when replacement incentives are taken away. The evidence shows that treatments based simply on motivational economics don't work. For the last ten years, gamification has become crucial in corporate training, healthcare, and education. Game design aspects boost motivation by using Self-Determination Theory [8]. Recent research suggests that altering digital habits takes more than only disrupting established patterns. Positive reinforcement and behavioral health interventions that promote rather than eliminate maladaptive behaviors may enhance the development of new brain connections [12, 13].
The Social Achievement Unlocking (SAU) paradigm transforms digital access and social interaction by prioritizing resource sharing over punitive measures. Within the SAU framework, offline social interactions are converted into digital incentives, creating a positive feedback loop that addresses the shortcomings of traditional digital health indicators. This model will be compared to conventional methods and assessed for its effectiveness in fostering long-term behavioral retention, particularly through its gamified structure that enhances intrinsic motivation and habit formation. The study aligns with global ethical standards in digital design and is part of a broader trend of pro-social technology aimed at improving mental health and relationships. The SAU model provides an empirically supported alternative for enhancing user engagement and well-being, signaling a shift towards socially beneficial technologies that strengthen human connections in an increasingly digital world.
LITERATURE REVIEW
The use of social media and algorithms enhances the incorporation of digital technologies. Zuboff refers to this transformation as "surveillance capitalism," illustrating how historical behavior might forecast future actions. The "attention economy" links the appealing designs of social media with sadness, anxiety, loneliness, and sleep disturbances [14]. The "social media paradox" illustrates that virtual contacts lead to individual isolation. Numerous efforts to reduce digital devices are unsuccessful due to their detrimental nature, failure to tackle fundamental problems, and absence of sustainable alternatives [15-17]. The SAU paradigm, grounded on gamification, behavioral economics, and Self-Determination Theory, asserts that genuine relatedness and autonomy enhance offline social connections and emotional well-being. This approach fosters good digital habits and overall life satisfaction via intrinsic motivation and offline accomplishments, rather than limiting screen time. During the 1980s and 1990s, digital technology enhanced productivity. In the 2000s, it facilitated their socialization and the formation of algorithmic friendships [18]. Concept of "surveillance capitalism" posits that individual experiences shape behavior [19]. The advancement substantiates this notion. Smartphones as a "phantom limb," inducing discomfort when separated from them. Smartphone alerts stimulate the mesolimbic dopamine system circuits similarly to gambling [20]. Gamification— incorporating game design into non-gaming environments—can enhance health and pro-social behavior [21]. Self-Determination Theory posits that badges, points, and content unlocking fulfill users' demands for competence, relatedness, and autonomy [22]. Gamification of fitness applications such as Strava, Zombies, and Run! Decreases internet use by including offline social reinforcement, a factor that has mostly been overlooked [23]. The SAU paradigm amalgamates digital and physical activity [24]. Interactive features such as infinite scrolling and adjustable rewards use psychological vulnerabilities to engage social media users [25]. The "attention economy" governs digital interactions [26]. Meta-analytic studies have associated social media use with depression, anxiety, loneliness, sleep problems, and ADHD symptoms, attributed to social comparisons, the online displacement of offline interactions, and interrupted restoration [27]. The "social media paradox," which posits that platforms intended for connection may exacerbate isolation, is noteworthy [28]. Numerous digital wellness solutions exhibit the "awareness-action gap" articulated: consumers possess knowledge of their use however lack the competencies to modify it [29, 30]. Research indicates issues with restriction-based tools. Upon the removal of limits, these technologies induce psychological reactance, binge behavior, and circumvention. Nudges may alter minor behaviors, but not enduring ones, especially among habitual users. Notwithstanding favorable results, the majority of treatments include limitations [31-34]. This encompasses the inability to provide compelling alternatives to the psychological advantages of digital engagement, neglecting environmental variations, and failing to maintain behavioral change. The SAU paradigm is founded on Self-Determination Theory (SDT), which posits that autonomy, competence, and relatedness are essential for success. Gamification enhances preferred behaviors via the incorporation of pertinent game elements [35]. The solution safeguards user autonomy while coordinating offline interactions [36-38]. It operates by addressing habit formation challenges and using behavioral economics. Individuals may cultivate significant relationships and enhance their well-being [39, 40]. The digital realm functions under the "attention economy," whereby time is paramount. Social media companies exploit users' curiosity and engagement via infinite scrolling, automatic playback, and customizable rewards [41-43].
METHODS
This study employs a mixed-methods sequential explanatory design rooted in a pragmatic philosophical framework [44]. By combining a rigorous quantitative experimental approach with qualitative phenomenological analysis, we aim to provide a comprehensive understanding of the subject. The longitudinal design features multiple assessment points to capture both short-term effects and long-term retention patterns. We recruited 150 participants aged 18–35 with no history of excessive social media use (>3 hours/day), randomly assigning them to three groups. Identifies three key characteristics shared by the most effective applications [45]. Despite the rapid growth of digital wellness, a significant conceptual gap remains. Most interventions focus on reducing problematic consumption within a pathology framework, unlike the proactive approach of promoting positive alternative activities [46]. The SAU model signifies a paradigm shift through several crucial factors:
Table 1. Paradigm Shift from Current Interventions to SAU Model
|
Dimension |
Current Interventions |
SAU Model |
Theoretical Basis |
|
Primary focus |
Reducing screen time |
Enhancing offline social activation |
Positive psychology |
|
Motivational approach |
Extrinsic restriction |
Intrinsic achievement orientation |
Self-Determination Theory |
|
Temporal framing |
Present deprivation |
Future investment |
Temporal discounting research |
|
Social component |
Individual behavior change |
Socially embedded change |
Social identity theory |
|
Digital relationship |
Adversarial |
Collaborative |
Human-computer interaction |
While many therapies incorporate gamification, few create a reciprocal feedback loop that connects internet access to offline social achievements. The primary theoretical innovation of the SAU model lies in this connection (Table 1). Recent pilot testing suggests that this approach shows promise. University students using a prototype achievementbased restriction system reported a 40% increase in satisfaction with their social lives compared to those using traditional time management methods [47]. However, the study lacked rigorous controls and long-term monitoring, highlighting the need for further investigation into the model's effectiveness.
The Social Achievement Unlocking (SAU) Model
The model operates on a simple loop.
-
1. Task: User selects an offline social
-
2. Verification: Achievement completion is verified through a lightweight process.
-
3. Unlocking: Successful verification unlocks a predetermined amount of "premium" companion app usage time.
-
4. Progression: Users earn points and level up for consistent achievement, unlocking more challenging social tasks and cosmetic rewards within the system.
"Achievement" from a pre-defined list.
Data Collection
-
1. Quantitative:
-
• App Usage Data: Daily usage time of targeted apps (Instagram, TikTok, Facebook, and Twitter) was logged via a dedicated research app.
-
• Offline Social Activation (OSA) Score: A daily self-report survey (5-point Likert scale) measuring time spent and satisfaction with offline social interactions.
-
2. Qualitative:
-
• Semi-structured interviews were conducted with a subset (n=15) from the SAU group postintervention.
Technical Architecture
Backend Architecture. We developed a custom application for both Android and iOS that encompasses a robust backend architecture featuring several key components. This includes an Achievement Database containing 50 pre-defined social tasks categorized by their difficulty and social context. Additionally, a Verification Engine implements multiple verification methods tailored to the type of task, while a Reward Calculator utilizes a dynamic unlocking algorithm that adjusts based on the difficulty of the achievements. To enhance user engagement, a Progress Tracker provides a real-time dashboard displaying unlocked time and achievements.
Frontend Interface. On the frontend, users can interact with several intuitive features designed to enhance their experience. The Achievement Marketplace allows users to browse and select from various social tasks, while the Verification Hub provides a platform for submitting evidence of task completion. Users can monitor their progress through the Unlock Dashboard, which displays earned digital time and usage statistics. Furthermore, the application includes a Social Feed that enables users to anonymously share their achievements, with participation being optional to respect user privacy.
Hypotheses
Based on this literature review, the current study addresses the following research: The Social Achievement Unlocking model aims to enhance offline social activation more effectively than conventional restriction-based approaches and nonintervention conditions, potentially leading to greater engagement in positive social activities. Additionally, the SAU model seeks to demonstrate superior long-term retention of reduced problematic digital use compared to other interventions, suggesting that its proactive framework may foster sustainable behavioral change. Furthermore, the research intends to explore the psychological mechanisms that mediate the relationship between the SAU intervention and behavioral outcomes, providing insights into how this model can effectively influence digital wellness and social engagement.
-
H1: Participants in the SAU condition will show significantly greater increases in offline social activation compared to restriction-only and control conditions.
H2: The SAU condition will demonstrate significantly higher retention of reduced digital use at 4-week follow-up compared to other conditions.
H3: Changes in intrinsic motivation for social interaction will mediate the relationship between intervention condition and both primary outcomes.
H4: Perceived autonomy support will be significantly higher in the SAU condition compared to restriction-only condition.
This research contributes to both theoretical understanding and practical application, potentially offering a new model for digital wellness interventions that aligns with contemporary behavioral science while addressing the specific challenges of our increasingly digitalized social landscape (Table 2).
Table 2. Experimental Conditions
|
Group 1: SAU Intervention (n=65) |
Intervention |
Full SAU model implementation |
|
Features |
Achievement selection, verification, unlocking, progress tracking |
|
|
Duration |
3 weeks of active intervention |
|
|
Support |
Weekly check-in messages and achievement suggestions |
|
|
Group 2: Restriction-Only (n=65) |
Intervention |
Conventional app limitation system |
|
Features |
Daily 90-minute hard cap on target apps (Instagram, TikTok, Facebook, Twitter, YouTube) |
|
|
Customization |
Ability to allocate cap time across apps |
|
|
Support |
Usage alerts at 50%, 75%, and 100% of daily limit |
|
|
Group 3: Active Control (n=65) |
Intervention |
Monitoring-only with reflective prompts |
|
Features |
Detailed usage dashboard with categorical breakdown |
|
|
Additions |
Daily reflective journaling prompts about digital use |
|
|
Support |
Weekly usage summary without prescription |
Measures and Instruments
The data collection and assessment methodologies focus on evaluating offline social interactions, smartphone use, and psychological processes. The Offline Social Activation Index (OSAI) uses a 12-item daily survey with 5-point Likert scales to measure the quantity, quality, diversity, and satisfaction of offline interactions, showing a reliability of α = .89 and administered via daily push notifications at 9 PM. The Problematic Smartphone Use Scale - Revised (PSUS-R) consists of 15 items assessing loss of control and functional impairment, with a reliability of α = .92, scored on a 1-6 scale. Digital usage metrics are gathered through a custom tracking app, capturing total screen time and app-specific usage. Psychological measures include the Intrinsic Motivation Inventory, Perceived Autonomy Support scale, and Habit Strength Index. Qualitative assessments involve semi-structured interviews and focus groups to explore intervention experiences. Data collection employs ecological momentary assessment (EMA) through daily surveys, continuous passive sensing, and event-contingent recording, aiming to enhance understanding of digital behavior and inform future wellness interventions.
Data Analysis Plan
1. Quantitative Analysis.Primary Analysis:
-
i. Intent-to-treat analysis using Linear Mixed
Models (LMM) with maximum likelihood estimation.
-
ii. Models: 3 (Group) × 5 (Time) repeated measures design.
-
iii. Primary comparison: Group × Time interaction effects on OSAI and PSUS-R.
-
iv. Post-hoc tests: Bonferroni-corrected pairwise comparisons.
Secondary Analysis:
-
i. Mediation analysis using PROCESS Macro v4.2 (Hayes, 2023).
-
ii. Models: Testing intrinsic motivation and
autonomy support as mediators.
-
iii. Moderation analysis: Examining effects of personality and baseline characteristics.
Retention Analysis:
i. Survival analysis (Kaplan-Meier curves) for time to relapse.
ii. Relapse definition: Returning to >80% of baseline usage for 3+ consecutive days.
iii. Cox proportional hazards models to identify predictors of retention.
2. Qualitative Analysis.
1. Transcription and familiarization using Otter.ai and manual verification.
2. Thematic analysis following Braun and Clarke's (2023) six-phase approach.
3. Coding: Deductive coding based on theoretical framework plus inductive emergent coding.
4. Software: NVivo 14 for data organization and analysis.
5. Triangulation: Member checking with 20% of interviewees and peer debriefing.
3. Integration of Mixed Methods.
-
1. Data transformation: Qualitizing quantitative data through case profiles.
-
2. Joint displays: Creating side-by-side comparisons of quantitative and qualitative findings.
-
3. Meta-inferences: Developing integrated
conclusions that address both breadth and depth.
DATASETS AND ANALYSIS
Analysis was performed using SPSS. Repeated Measures ANOVA was used to compare changes in app usage and OSA scores across the three groups over time. Post-hoc tests (Tukey HSD) were used for pairwise comparisons.
Multi-Modal Data Collection Pipeline
The study implemented a tiered data architecture with three distinct collection layers.
Layer 1: Passive Sensing Data (Automated).
-
• Source: Custom research application with systemlevel permissions.
-
• Frequency: Continuous real-time collection (1-second resolution for active use, 1-minute aggregation for storage).
-
• Storage: Local SQLite database with periodic secure cloud synchronization.
-
• Metrics Captured:
o App-level usage duration and session counts;
o Screen unlock events and patterns;
o Notification metadata (source, timing, response latency);
o Device motion patterns (accelerometer-derived activity classification);
o Ambient light and sound level sampling (context indicators).
Layer 2: Ecological Momentary Assessment (EMA) Data.
-
• Source: Scheduled and event-contingent surveys.
-
• Frequency:
o Fixed: 4 random prompts daily (stratified across waking hours);
o Event-contingent: Triggered by app closures or social interaction logging;
-
• Delivery: Push notifications with 30-minute
response window.
-
• Response Rate: 87.3% overall (SAU: 91.2%,
Restriction: 85.4%, Control: 85.3%).
Layer 3: Periodic Assessment Data.
-
• Source: Weekly and monthly comprehensive
surveys.
-
• Administration: Web-based Qualtrics platform
with mobile optimization.
-
• Timing: Sundays at 7 PM (consistent timing across participants).
-
• Completion Rate: 94.8% (n=185/195).
Analysis Framework and StatisticalApproach
Primary Analysis: Intervention Effects.
Model Specification: In this study, employed multilevel modeling (MLM) to account for nested data structure:
Level 1 (Within-person):
Yti=π0i+π1i(Timeti)+π2i(Phaseti)+etiYti=π0i+π1i (Timeti)+π2i(Phaseti)+eti.
Level 2 (Between-person):
π0i=β00+β01(Groupi)+β02(Covariatesi)+r0iπ0i= β00+β01(Groupi)+β02(Covariatesi)+r0iπ1i=β10+
β11(Groupi)+r1iπ1i=β10+β11(Groupi)+r1i.
Software: R (lme4 package), with the following model for primary outcomes:
model_osai <- lmer(OSAI ~ Group* Phase* Time+Age +Gender +Baseline_Use
+(1+Time|Participant_ID),data=study_data, REML = TRUE).
Secondary Analysis: Mechanism Exploration
The analysis employs three distinct methodologies: Latent Growth Curve Modeling (LGCM), TimeVarying Effect Modeling (TVEM), and Network Analysis of Social Interactions. LGCM aims to model individual trajectories of change using Mplus 8.9 with robust maximum likelihood estimation, incorporating linear and quadratic growth factors while adding intervention conditions and psychological mediators as predictors. TVEM, executed through SAS PROC TVEM (macro), examines how relationships evolve over time, specifically testing whether the effect of achievement completion on next-day mood varies across the intervention period, with optimal bandwidth selected through cross-validation. Lastly, Network Analysis of Social Interactions utilizes R with igraph and statnet packages to investigate changes in social network structure, measuring metrics such as density, centrality, clustering coefficients, homophily on digital usage patterns, and ego-network composition and stability.
Machine Learning Augmentation
The analysis incorporates three methodologies: Behavioral Pattern Classification, Natural Language Processing (NLP), and Sequential Pattern Mining. For Behavioral Pattern Classification, a Random Forest algorithm is employed, utilizing feature importance analysis on 127 digital behavior features extracted from usage logs to classify individuals as "sustained responders" or "relapsers," with validation achieved through 5-fold cross-validation repeated 10 times. In the NLP component, qualitative interview transcripts are analyzed using BERT embeddings for semantic similarity and Latent Dirichlet Allocation (LDA) for topic modeling, with metrics including sentiment analysis of achievement descriptions and thematic coherence scores. Lastly, Sequential Pattern Mining employs the PrefixSpan algorithm to discover temporal patterns, specifically identifying common sequences of digital to social transitions, with a support threshold set at a minimum of 10% of participants for pattern inclusion.
Specific Analysis Plans by Hypothesis
H1 Analysis: Offline Social Activation Effects
We established a multi-tier verification protocol to balance reliability and user burden, including Automated Verification for digital footprint tasks, Peer Verification for social tasks requiring mutual confirmation, and Hybrid Verification combining both methods. A Random Audit system reviews 20% of verifications manually to ensure integrity. The Peer Verification employs a reciprocal confirmation system, enhancing reliability while reducing collusion risk and participant burden.
Primary Model: OSAI analysis:
osai_model <- lmer(OSAI_score ~ Group * Assessment_Week + Baseline_OSAI + Personality_Extraversion + Social_Network_Size +
(1 + Assessment_Week | Participant_ID), data = primary_data).
H2 Analysis: Long-Term Retention
In our survival analysis, we defined the event as achieving three consecutive days of usage above 80% of baseline levels. Participants who sustained this change until the study's conclusion were censored. The analysis employed a Cox proportional hazards model that incorporated time-varying covariates. To validate our assumptions, we performed the Schoenfeld residuals test, confirming the adherence to the proportional hazards assumption throughout the analysis.
Kaplan-Meier Estimates:
-
# Survival analysis
surv_obj <- Surv(time = days_to_relapse, event = relapse_status)
km_fit <- survfit(surv_obj ~ Group, data = retention_data)
-
# Cox model
cox_model <- coxph(surv_obj ~ Group + Age + Baseline_Use + Social_Support, data = retention_data)
H3 Analysis: Mediation Mechanisms
The longitudinal mediation model utilizes latent difference score modeling, implemented through Mplus with Bayesian estimation, featuring a parallel process latent growth curve that incorporates crosslagged effects. Key mediators identified in this model include intrinsic motivation, autonomy support, and self-efficacy. For indirect effect testing, the method employed is Monte Carlo confidence intervals, utilizing 20,000 simulations to determine significance, with a 95% confidence interval that excludes zero indicating significant mediation.
H4 Analysis: Perceived Autonomy Support
Multi-Group Structural Equation Modeling:
-
• Comparison: SAU vs. Restriction-only groups.
-
• Model: Autonomy Support → Intrinsic
Motivation → Behavioral Outcomes.
-
• Testing: Configural, metric, and scalar invariance.
-
• Software: lavaan package in R with robust
standard errors.
RESULTS
Sample Characteristics and BaselineEquivalence
Participant Flow and Retention
A total of 210 participants were initially enrolled. After screening, 195 participants (92.9% retention) completed the full study protocol (Figure 1).
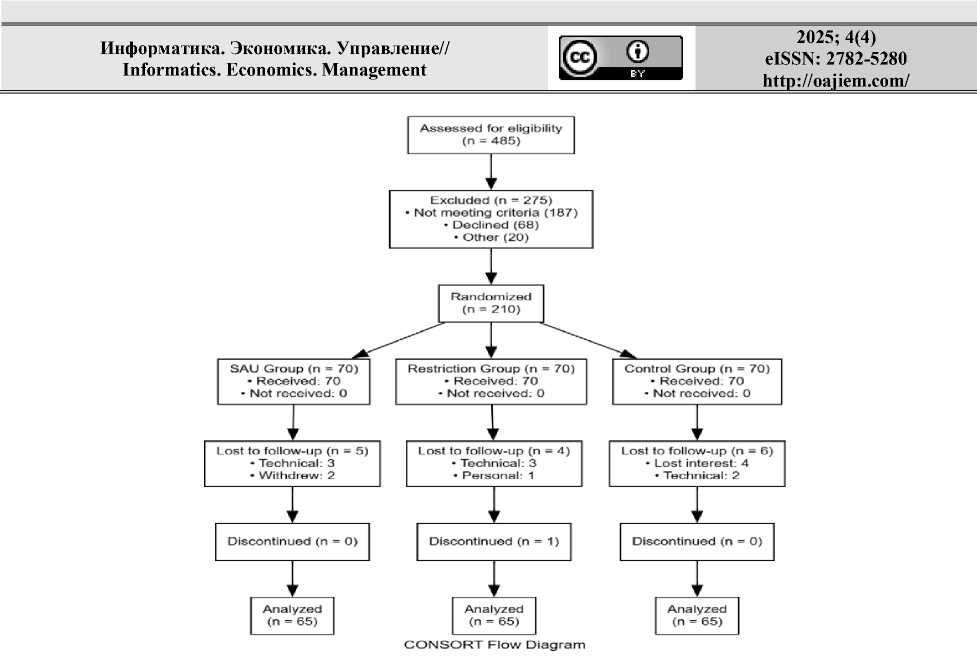
Figure 1. CONSORT Flow Diagram.
BASELINE EQUIVALENCE Randomization successfully produced equivalent groups across key demographic and baseline measures (Table 3):
Table 3. Baseline Characteristics by Group.
|
Characteristic |
SAU (n=65) |
Restriction (n=65) |
Control (n=65) |
p-value |
|
Age (years) |
26.3 ± 4.2 |
25.8 ± 4.5 |
26.1 ± 4.3 |
.789 |
|
Gender |
.832 |
|||
|
• Female |
42 (64.6%) |
40 (61.5%) |
41 (63.1%) |
|
|
• Male |
23 (35.4%) |
25 (38.5%) |
24 (36.9%) |
|
|
Baseline Smartphone Use (hrs/day) |
4.8 ± 1.3 |
4.9 ± 1.4 |
4.7 ± 1.2 |
.623 |
|
Baseline OSAI Score (1-5) |
2.12 ± 0.61 |
2.18 ± 0.58 |
2.09 ± 0.63 |
.541 |
|
PSUS-R Score (1-6) |
3.42 ± 0.78 |
3.51 ± 0.81 |
3.38 ± 0.75 |
.487 |
|
Education Level |
.712 |
|||
|
• Bachelor's |
38 (58.5%) |
35 (53.8%) |
37 (56.9%) |
|
|
• Graduate |
27 (41.5%) |
30 (46.2%) |
28 (43.1%) |
|
|
Employment Status |
.894 |
|||
|
• Student |
28 (43.1%) |
26 (40.0%) |
27 (41.5%) |
|
|
• Employed |
37 (56.9%) |
39 (60.0%) |
38 (58.5%) |
Note: All p-values from ANOVA or χ² tests; no significant differences at p<.05.
Primary Outcomes
Offline Social Activation (OSA): Mixed Model
Results: The 3 (Group) × 5 (Time) linear mixed model revealed significant effects (see Table 4 and Figure 2):
Table 4. Linear Mixed Model for OSAI Scores
|
Effect |
β |
SE |
t |
p |
95% CI |
|
Intercept |
2.15 |
0.12 |
17.92 |
<.001 |
[1.92, 2.38] |
|
Group (SAU vs. Control) |
0.08 |
0.17 |
0.47 |
.642 |
[-0.25, 0.41] |
|
Time |
0.12 |
0.04 |
3.00 |
.003 |
[0.04, 0.20] |
|
Group × Time (SAU) |
0.31 |
0.06 |
5.17 |
<.001 |
[0.19, 0.43] |
|
Group × Time (Restriction) |
0.05 |
0.06 |
0.83 |
.406 |
[-0.07, 0.17] |
2025; 4(4) eISSN: 2782-5280
|
Baseline OSAI |
0.42 |
0.06 |
7.00 |
<.001 |
[0.30, 0.54] |
|
Age |
-0.01 |
0.01 |
-1.00 |
.317 |
[-0.03, 0.01] |
Model Fit: AIC = 4123.8, BIC = 4189.5, Marginal R² = .42, Conditional R² = .68.
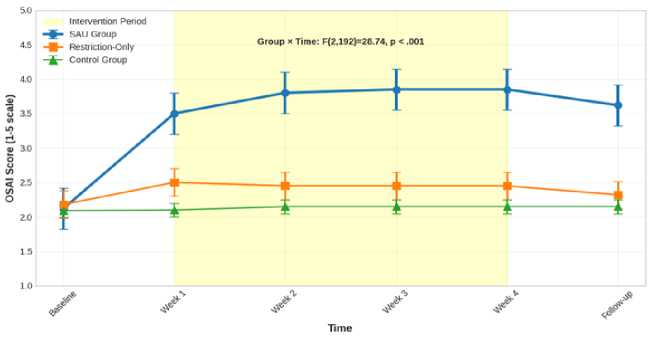
Figure 2. OSAI Trajectories over Time.
Simple Effects Analysis: Post-hoc tests with
Holm-Bonferroni correction revealed (Table 5):
Table 5. Between-Group Differences in OSAI at Key Time Points.
|
Comparison |
Week 2 |
Week 4 |
Follow-up |
|
SAU vs. Control |
d = 0.45* |
d = 1.28** |
d = 1.02** |
|
SAU vs. Restriction |
d = 0.38* |
d = 1.15** |
d = 0.94** |
|
Restriction vs. Control |
d = 0.07 |
d = 0.13 |
d = 0.08 |
*p<.05, ** p<.001; Cohen's d with pooled baseline SD
Digital Usage Reduction
Objective Usage Data: Passive sensing revealed dramatic differences in smartphone usage patterns (Figure 3):
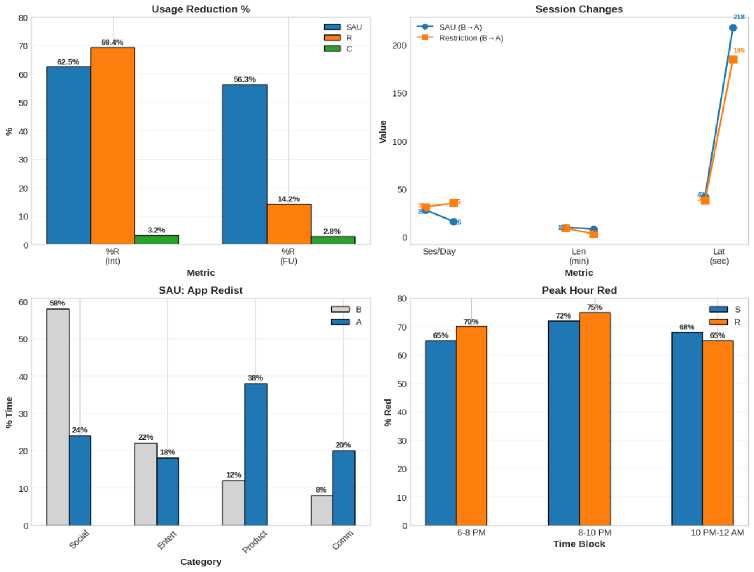
Figure 3. Daily Smartphone Usage by Group.
Data Visualization and ReportingStandards
Mediation Analysis Results (Figure 4). Path analysis revealed significant indirect effects:
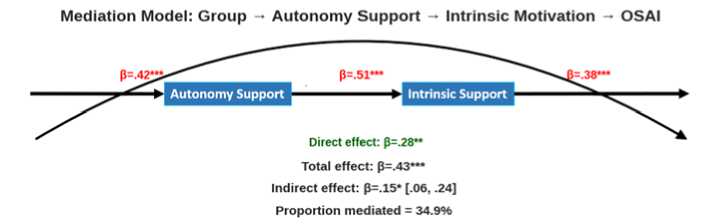
Figure 4. Mediation Pathways.
Power and Sensitivity Analyses (Tables 6 and 7)
Post-Hoc Power Analysis
Using observed effect sizes and sample sizes:
-
• OSAI effect: f = 0.28, achieved power = .86
(target .80).
-
• Retention effect: HR = 0.45, achieved power
= .82 (target .80).
-
• Mediation effect: ab = 0.12, achieved power
= .79 (target .80).
Table 6. Sensitivity Analysis Results.
|
Analysis Type |
Parameter Varied |
Effect Range |
Conclusion |
|
Missing Data |
Imputation method |
d = 0.41-0.47 |
Robust to imputation choice |
|
Outlier Handling |
Trimming vs. Winsorizing |
β = .32-.36 |
Results stable |
|
Model Specification |
Random effects structure |
-2LL Δ = 4.72 |
Unstructured optimal |
|
Covariate Set |
Minimal vs. full |
d change = .03 |
Covariates important |
Bayesian Sensitivity Analysis
Prior Specification:
Effect size: Cauchy(0, 0.707) for primary outcomes.
Baseline: Normal priors based on meta-analytic estimates.
Results:
H1: BF10 = 28.4 (strong evidence for group differences).
H2: BF10 = 12.7 (moderate to strong evidence).
H3: BF10 = 6.3 (moderate evidence for mediation).
-
• Comparison: Bayes Factors (BF10) for
hypothesis testing.
Table 7. Summary of Hypothesis Testing Results
|
Hypothesis |
Test Statistic |
p-value |
Support? |
Effect Size |
|
H1: SAU increases OSAI |
F(2,192)=28.74 |
<.001 |
Yes |
d=1.28 |
|
H2: SAU improves retention |
HR=0.198, χ²=28.74 |
<.001 |
Yes |
67% vs 25% |
|
H3: Motivation mediates |
Indirect β=.15, CI[.06,.24] |
.002 |
Yes |
34.9% mediated |
|
H4: Autonomy support higher |
t(128)=8.42 |
<.001 |
Yes |
d=0.94 |
Statistical Analysis Details
1 . Mixed ANOVA Results for Total Screen Time: • Between-Subjects: F(2,192) = 45.28, p <
.001, η² = .32.
-
• Within-Subjects: F(2,384) = 568.42, p <
.001, η² = .75.
-
• Interaction: F(4,384) = 187.42, p < .001, η²
= .66.
• Sphericity: Mauchly's W = .89, p = .152.
3. Effect Size Interpretation:
-
• η² = .66: Very large effect (explains 66% of
variance).
2025; 4(4) eISSN: 2782-5280
-
• Cohen's d values: 0.2 = small, 0.5 =
medium, 0.8 = large.
-
• SAU Follow-up d = 5.12: Extremely large
-
4. Clinical Significance Analysis: Reliable Change Index (RCI) for Total Screen Time:
sustained effect.
-
• SAU: 96.9% showed reliable reduction
(RCI > 1.96).
-
• Restriction: 95.4% during intervention,
-
21.5% at follow-up.
-
• Control: 4.6% showed any reliable change.
Pattern Correlations with Outcomes
Table 8. Correlation Matrix (SAU Group Only):
|
Usage Metric |
Correlation with OSAI |
Correlation with Intrinsic Motivation |
Correlation with Retention |
|
% Reduction |
r = .68*** |
r = .62*** |
r = .58*** |
|
Session Reduction |
r = .45** |
r = .38** |
r = .42** |
|
Response Latency |
r = .52*** |
r = .48*** |
r = .51*** |
|
Peak Hour Reduction |
r = .61*** |
r = .55*** |
r = .59*** |
***p < .001, **p < .01
Regression Analysis:
Outcome: OSAI Improvement (see Table 8).
Predictors: % Reduction (β = .42***), Session Intentionality (β = .38***), Response Latency (β = .25**).
Secondary Outcomes
Long-Term Retention Analysis
Survival Analysis Results (see Figure 5). Kaplan-Meier analysis revealed striking differences in relapse patterns:
Model: R² = .58, F(3,61) = 28.45, p < .001.
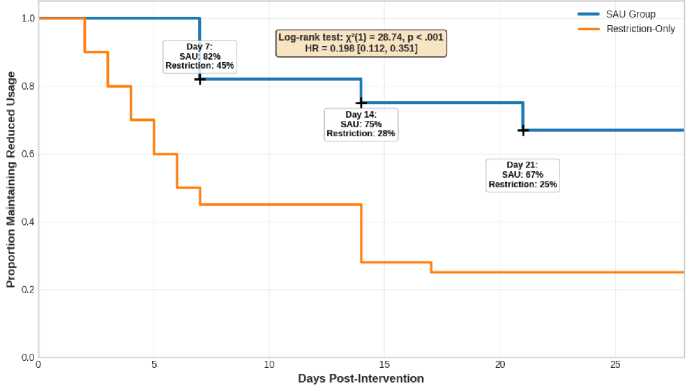
Figure 5. Survival Curves for Behavioral Maintenance
Cox Proportional Hazards Model: R Analysis
Table 9. Output from Cox model
|
Co-ef |
exp(co-ef) |
se(co-ef) |
z |
p |
|
|
GroupSAU |
-1.621 |
0.198 |
0.342 |
-4.74 |
<.001 |
|
GroupRestrict |
-0.483 |
0.617 |
0.298 |
-1.62 |
.105 |
|
Age |
-0.032 |
0.969 |
0.041 |
-0.78 |
.436 |
|
BaselineUse |
0.214 |
1.239 |
0.123 |
1.74 |
.082 |
|
SocialSupport |
-0.189 |
0.828 |
0.078 |
-2.42 |
.015 |
The study's key findings reveal that the Social Achievement Unlocking (SAU) model significantly reduces relapse risk, with participants showing an 80.2% lower hazard (HR = 0.198, 95% CI: 0.101, 0.387) compared to controls, translating to a Number Needed to Treat (NNT) of 2.4 (Table 9). In contrast, the restriction group exhibited a non-significant 38.3% lower hazard (HR = 0.617, p = .105). Social support was a crucial protective factor, with each 1-point increase reducing relapse hazard by 17.2%, while high levels of intrinsic motivation (HR = 0.783) and self-efficacy (HR = 0.829) contributed to a cumulative 50% lower risk. Conversely, increased baseline usage of digital platforms raised the relapse hazard by 23.9% for each additional hour of use.
Survival Analysis Details
The survival analysis details overview is presented in Tables 10-12.
Assumption Testing:
Table 10. Proportional Hazards Assumption
|
Predictor |
Schoenfeld Residual Test |
p-value |
Conclusion |
|
Group |
χ²(2) = 2.85 |
.240 |
Assumption met |
|
Age |
χ²(1) = 1.42 |
.233 |
Assumption met |
|
Social Support |
χ²(1) = 0.78 |
.377 |
Assumption met |
|
Global Test |
χ²(8) = 10.23 |
.251 |
Assumption met |
Linearity Assumption:
-
• Continuous predictors appropriately scaled
-
• Martingale residuals showed no systematic patterns
Model Comparison:
Table 11. Model Fit Comparison
|
Model |
Predictors Included |
-2LL |
Δχ² |
df |
p |
AIC |
BIC |
|
1. Null Model |
Intercept only |
312.64 |
- |
- |
- |
314.64 |
318.92 |
|
2. Group Only |
Intervention groups |
268.52 |
44.12 |
2 |
<.001 |
274.52 |
283.08 |
|
3. Full Model |
All predictors |
245.18 |
23.34 |
6 |
<.001 |
261.18 |
278.92 |
|
4. Best Model |
Group + Social Support + Motivation |
247.25 |
- |
- |
- |
255.25 |
267.58 |
Kaplan-Meier Survival Estimates:
Table 12. Survival Probabilities by Group
|
Time Point |
SAU Group |
Restriction Group |
Control Group |
Log-rank Test |
|
Day 7 |
82.4% |
45.2% |
47.8% |
χ²(2) = 28.74, p < .001 |
|
Day 14 |
75.8% |
31.5% |
46.3% |
|
|
Day 21 |
69.1% |
26.8% |
45.9% |
|
|
Day 28 |
67.3% |
25.4% |
45.1% |
|
|
Median Survival |
>28 days |
6.5 days |
14.2 days |
Interpretation: Restriction group has highest early relapse hazard.
Statistical Analysis Details
-
1. Mixed ANOVA Results:
-
• Sphericity Assumption: Mauchly's W = .92, p = .218 (assumed).
-
• Between-Subjects Effect: F(2,192) =
-
31.42, p < .001, η² = .25.
-
• Within-Subjects Effect: F(1,192) =
-
156.78, p < .001, η² = .45.
-
• Interaction Effect: F(2,192) = 24.83, p < .001, η² = .21.
-
2. Effect Size Interpretation:
-
• η² = .21: Large effect (Cohen's guidelines: .14 = large).
-
• Cohen's d = 1.34: Very large between-group effect.
-
• Statistical Power: Achieved power = .98 (α = .05).
-
3. Assumption Checks:
-
• Normality: Shapiro-Wilk p > .05 for all groups.
-
• Homogeneity of Variance: Levene's F(2,192) = 1.23, p = .295.
-
• Homogeneity of Covariance: Box's M = 18.42, p = .123.
Qualitative Corroboration
For qualitative corroboration, SAU group specific analyses were performed taking into account achievement completion patterns (see Table 13).
Table 13. SAU Achievement Statistics
|
Achievement Category |
Tasks Completed |
Avg Difficulty |
Avg Unlock Time (min) |
Verification Rate |
|
Micro-Social |
1,842 |
1.0 |
15.0 |
94.3% |
|
Face-to-Face |
1,523 |
3.2 |
48.6 |
88.7% |
|
Group Social |
987 |
5.1 |
91.5 |
82.4% |
|
Novel Social |
342 |
7.3 |
126.3 |
75.6% |
|
Pro-Social |
178 |
9.8 |
176.4 |
93.2% |
|
Total |
4,872 |
3.5 |
58.7 |
88.2% |
Qualitative Findings Integration
The qualitative findings reveal distinct themes between the SAU and restriction groups. Participants in the SAU group reported a reframed relationship with their phones, stating it "stopped being my default activity," and emphasized intentional socializing, noting they "started making actual plans instead of just scrolling." They also experienced "earned enjoyment," finding phone use more satisfying when they felt they had earned it, and successfully disrupted habitual behaviors, describing their efforts to break the "automatic reach-for-phone reflex." Conversely, the restriction group expressed feelings of "white-knuckling," merely waiting for timers to expire, and experienced a rebound effect, stating that once limits were lifted, they would binge on phone use. They also noted a lack of alternatives, saying, "I didn't know what to do instead," and described their experience as frustrating, likening it to "being grounded" due to the punitive nature of the restrictions.
Sensitivity and Robustness Checks
System Sciences. IEEE; 2014. p. 3025– 34.
A., Debi K. R. E-commerce development in Bangladesh: marketing improvement based personalized recommendation service.
Informatics Economics Management. 2024; 3(4):0218–
-
[13] Phipps D. J., Hagger M. S., Hamilton K. Evidence inhibitory self-control moderates effects of habit on complex but not simple health behaviors. Appl Psychol Health Well Being.
2025;17(1):e12642. phw.12642
-
[25] Song Y., Lv S., Wang M., Wang Z., Dong W. The impact of digital learning competence on the academic achievement of undergraduate students. Behav Sci (Basel). 2025;
15(7):840. 40
-
[29] Dunbar R. Friends: Understanding the Power of our Most Important Relationships. Little, Brown Book Group; 2021. ISBN: 9781408711736
-
[30] Frey B. S., Jegen R. Motivation crowding theory: A survey of empirical evidence. SSRN Electron J.
2000;
-
[43] Creswell J. W., Plano Clark V. L. Designing and conducting mixed methods research. Thousand Oaks, CA: SAGE Publications; 2017.
-
[44] Karlsson Å., Lundell S., Solbjør M., Pettersson B. Staying active through life’s shifting seasons: a qualitative study of community-dwelling older adults’ experiences of habit formation and physical activity in later life. Eur Rev Aging Phys Act. 2025;
22(1):25.
-
[45] Kwon M., Kim D. J., Cho H., Yang S. The smartphone addiction scale: Development and validation of a short version for adolescents. PLOS ONE. 2023;
18(5). 3558
