Modeling, Simulation and Control Studies on Photovoltaic-Converter System for Mechatronics Design of Solar Electric Application

Author: Farhan A. Salem, B. Saleh
Journal: International Journal of Intelligent Systems and Applications(IJISA) @ijisa
Article in issue: 1 vol.7, 2014.
Free access
This paper presents some considerations regarding design, modeling and control solutions for Photovoltaic Panel-Converter (PVPC) system. Different control approaches and corresponding models are derived, developed and tested, to control output characteristics and performance of both overall PVPC system and each subsystem to meet desired output characteristics, performance and both and/or either voltages and currents requirements. The proposed approaches and models allow designer have the maximum output numerical visual and graphical data to select, evaluate and control the PVPC system output characteristics for a given PVPC system parameters, under given working conditions of PV panel. The proposed models and approaches were implemented and tested in MATLAB/Simulink.
Mechatronics, Photovoltaic (PV) Cells, DC/DC Converter, Modeling, Simulation
Short address: https://sciup.org/15010643
IDR: 15010643
Text of the scientific article Modeling, Simulation and Control Studies on Photovoltaic-Converter System for Mechatronics Design of Solar Electric Application
Published Online December 2014 in MECS
Fig.1(b) Circuit diagram of proposed PVPC system's subsystems
PV Cell
DC/DC Converter
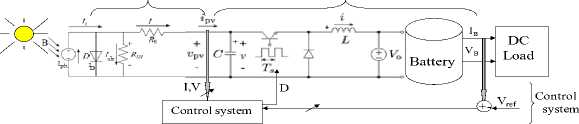
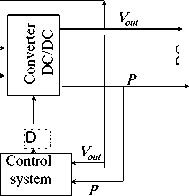
Fig.1(c) Generalized circuit diagram of proposed PVPC system's subsystems and control
Fig.1(a)(b)(c) Block and circuit diagrams of proposed control approaches of Photovoltaic panel-Converter systems
Table 1. Nomenclature and electric characteristic
|
Solar cell parameters |
|
|
Isc=8.13 A , 2.55 A , 3.8 |
The short-circuit current, at reference temp 25◦C |
|
I A |
The output net current of PV cell ( the PV module current ) |
|
I ph A E g : =1.1 V t = KT / q |
The light-generated photocurrent at the nominal condition (25◦C and 1000 W/m2), The band gap energy of the semiconductor The thermo voltage of cell . For array :( V^ = N KT / q ) |
|
I s ,A |
The reverse saturation current of the diode or leakage current of the diode |
|
Rs=0.001 Ohm |
The series resistors of the PV cell, it they may be neglected to simplify the analysis. |
|
Rsh=1000 Ohm |
The shunt resistors of the PV cell |
|
V |
The voltage across the diode, output |
|
q=1.6e-19 C B o =1000 W/m 2 β =B=200 W/m 2 Ki=0.0017 A/◦C |
The electron charge The Sun irradiation The irradiation on the device surface The cell's short circuit current temperature coefficient |
|
Vo= 30.6/50 V |
Open circuit voltage |
|
Ns= 48 , 36 |
Series connections of cells in the given photovoltaic module |
|
Nm= 1 , 30 |
Parallel connections of cells in the given photovoltaic module |
|
K=1.38e-23 J/oK; |
The Boltzmann's constant |
|
N=1.2 |
The diode ideality factor, takes the value between 1 and 2 |
|
T= 50 Kelvin |
Working temperature of the p-n junction |
|
T ref =273 Kelvin |
The nominal reference temperature Buck converter parameters |
|
C=300e-6; 40e-6 F |
Capacitance |
|
L=225e-6 ; .64e-6 H |
Inductance |
|
Rl=RL=7e-3 |
Inductor series DC resistance |
|
rc= RC=100e-3 |
Capacitor equivalent series resistance, ESR of C , |
|
V in = 24 V |
Input voltage |
|
R=8.33; 5 Ohm; |
Resistance |
|
Ron=1e-3; |
Transistor ON resistance |
|
KD=D= 0.5, 0.2, |
Duty cycle |
|
Tt=0.1 , 0.005 |
Low pass Prefilter time constant |
|
V L |
Voltage across inductor |
|
I C |
Current across Capacitor |
-
II. PVPC System Modeling
Approaches are shown in Fig.1, the PV panel and converter parameters used in simulations are listed in Table 1.
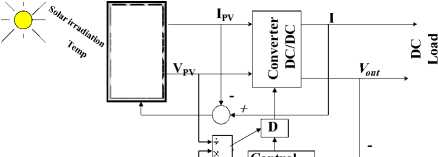
The proposed system consists of three subsystems shown in Fig.1, including; PV panel, DC/DC converter with battery and control subsystems. A detailed description, fundamentals, mathematical and Simulink models of PV cell-panel and converters can be found in many recourses including [2-25] The PVPC system mathematical and Simulink models considered in this paper, are in reference to [2-3].
-
A. PV panel system modeling
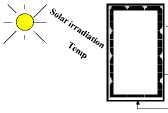
The simplest equivalent circuit of a PV solar cell consists of a diode, a photo current, a parallel resistor expressing a leakage current, and a series resistor
describing an internal resistance to the current flow all is shown in Fig.2(a), the output voltage, current and power of PV array vary as functions of solar irradiation level β, the temperature of the module T, (output decreases as temperature rises) and load current or the voltage at which the load is drawing power from the module.
The output net current of PV cell I , referring to [2] and (a), is given by Eqs.(1)(wqw),
( q (V + IR S )
NKT
I = I ph I s I e
— 1
—
V + RSI
R sh
The cell photocurrent ISC , is given by Eq.(2):
I ph = ( I sc + K i ( T — T e ) ) 1 ^ 0
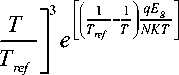
The cell saturation current IS , varies with the cell
temperature, which is described as by Eq.(3)
Is (T ) = Is
given PV module function model, will be given by Eq.(10), where the current now is prefilter current.
The reverse saturation current I S at reference temperature can be approximately obtained by Eq.(4):
G ( - ) = IjilteL = k
IPV T- + 1
I s (T 1 ) =
I sc (T 1 )
f \ 1 )
I NSKAT I 1
e L S 1 J - 1
I = N p ( I ph ) - N p I s
V + * filter RS )
NSN
NKT - 1
N p V- + Rs
N S S
Ifilter
Rsh
In the basic equation to represent the actual I-V characteristics of a practical PV module and to pick up real operation losses, a third current based on R s and R sh , called shunt current IRsh and given by Eq.(5), is added:
1RSH
V + RSI
R sh
Based on derived equations, the net current of the cell given by Eq.(1) and depends on the PV cell voltage V , solar irradiance β on PV module, and ambient temperature T . The power produced by a single PV cell is not enough for general use, where, each solar cell generates approximately 0.5V; therefore the PV cells are connected in series-parallel configuration [2] . The current output of given PV module considering the number of parallel and series connections of cells ( N S , N P ) is given by Eq.(6)

I = N p I ph
- N P I s e NKT
- 1
-
N Г
NV + RJ
NS S
R sh
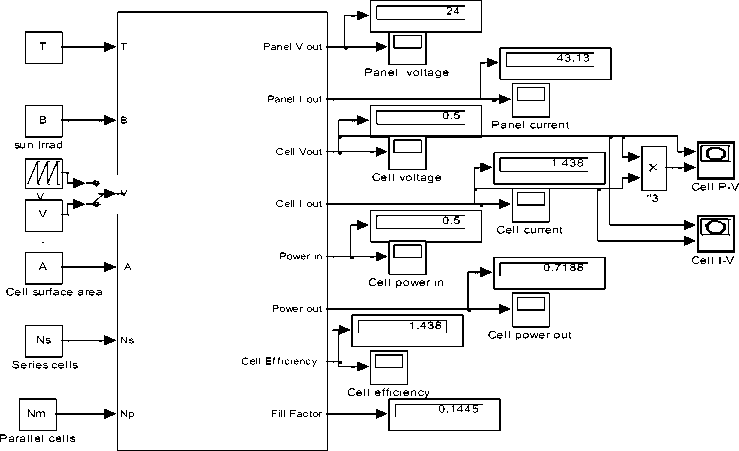
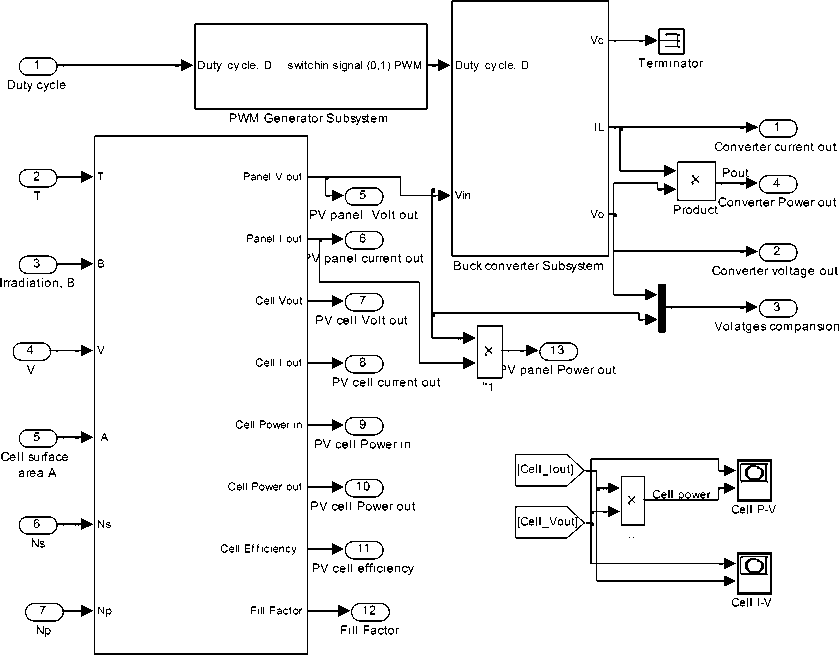
For Mechatronics design of solar electric applications, model shown in Fig.2(d), is modified to result in a generalized PV module and shown in Fig.2(e) [2], this generalized model returns the maximum required numerical, visual and graphical data for design, analysis and verification of a given PV panel for given parameters, manufacturing tolerance and working conditions.
Running this model for PV subsystem parameters given in Table 1, including Ns=36, Np=30 , cell surface area A=0.005 m2 , at β=200 , T=50 , will return P-I and VI characteristics shown in Fig.2(e) and visual data results shown in Fig.2(e), including; PV panel output voltage 24 V, panel output current 43.13 A , cell volt V=0.5 , cell current= 1.43 A , cell input and output powers, efficiency and fill factor. P-I and V-I characteristics shown in Fig.2 (e)(f) show that, this is 0.755 Watt PV cell, I SC = 1.7 A , Vo= 0.587V , I max =1.51 A , V max =0.5 V, (MPP = I max * V max =0.755).The P-V and I-V curves, show that with increase in temperature at constant irradiation, the power output reduces , also, by increasing operating temperature, the current output increases and the voltage output reduces.
The PV cell efficiency is insensitive to variation in shunt resistance R SH , the effect of parallel resistance R SH can be neglected in Eq. (1), to have the form, given by Eq.(7)
f V_
NKT
11 ph 1 s I e 1
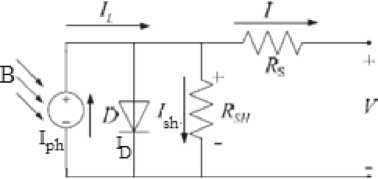
Fig. 2 (a) Single diode (exponential) model of the PV model
The maximum PV voltage can be represented by Eq. (8),
V = NKT in f I p- + I - + I L IR
s q I I- )
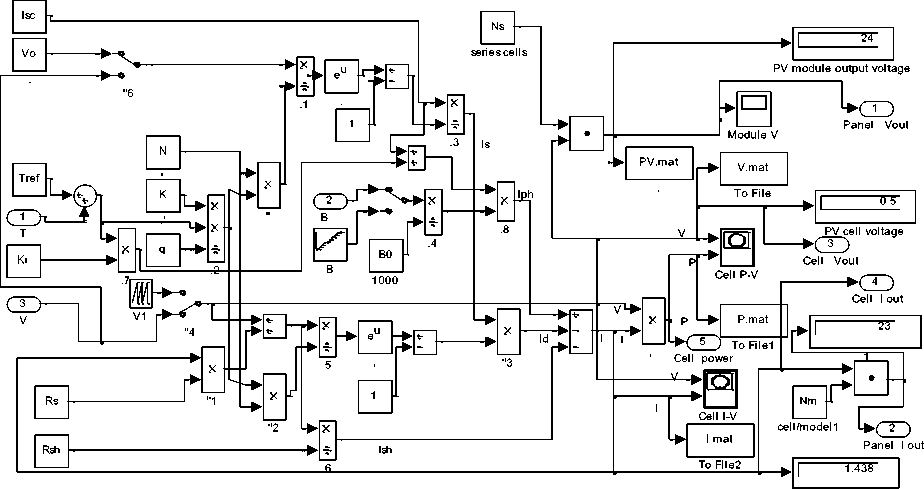
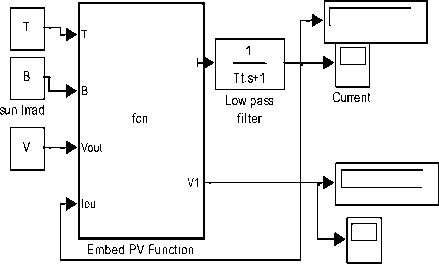
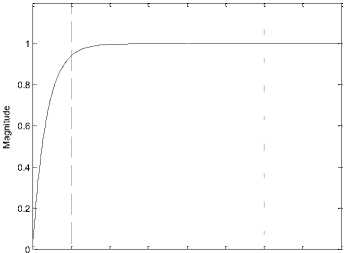
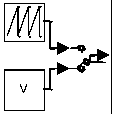
Based on these equations, and referring to [ 2], Simulink model shown in Fig.2 is developed, with corresponding two mask-blocks shown in Fig.2(c)(d), also, based on derived equations, PV module can be represented in MATLAB/Simulink using user defined function block as shown in Fig.2(b), where the PV system is given as a function of (V,I) = f(V,G,T) with three inputs V, β , and T and two outputs; PV voltage and current. In this model, a low pass filter is added to convert static model into a dynamic model (and to overcome algebraic loop problem). The transfer function of low-pass filter is given by Eq.(9) , with prefilter the current output of
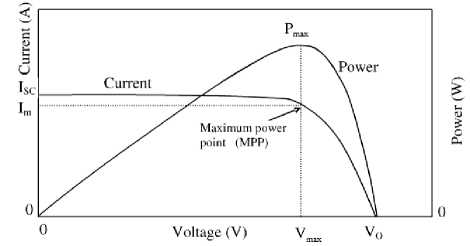
Fig .2 (b) Typical characteristic I-V and P-V curve of a practical photovoltaic device and the three remarkable points [2]
cell current
Fig. 2(c) PV cell (panel) MATLAB/Simulink subsystem model [2].
Volt
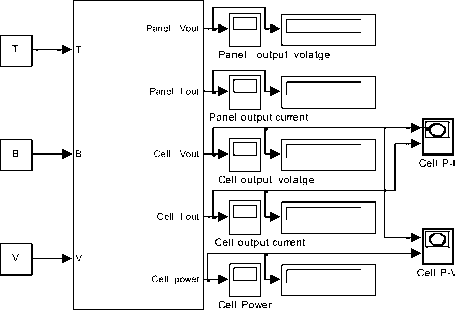
PV Panel Subsystem
Fig.2(e) PV cell MATLAB/Simulink model [2]
Fig.2(d) PV cell (panel) MATLAB/Simulink subsystem model as used defined function [2]
PV Panel Subsystem
Fig.2 (f) Generalized PV Cell-Panel models
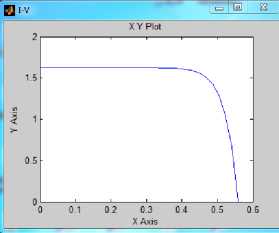
Fig.2 (g)V-I Characteristics for β=200, and T=50
-
B. DC/DC Converter system modeling.
Converters can be classified intro three main types; step-up, step-down and step up and down. Most used and simple to model and simulate DC/DC power converter include Boost, Buck and buck-boost converters . [2-3] . In this paper step-down DC/DC Buck converter s is used. In [2], different models of Buck converter are derived, developed in Simulink and tested, including Buck converter circuit diagram shown in Fig.3(a) and Simulink sub-models and masks shown in Fig.3(b)(c).
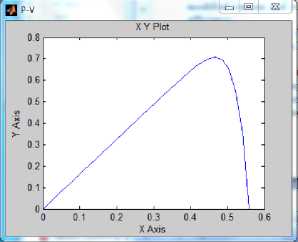
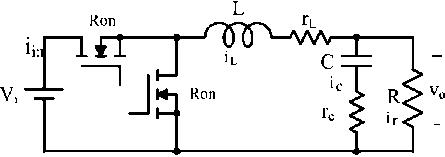
Fig.3(a) Buck converter circuit diagram[2]
Fig.2 (h)P-V Characteristics for β=200, and T=50
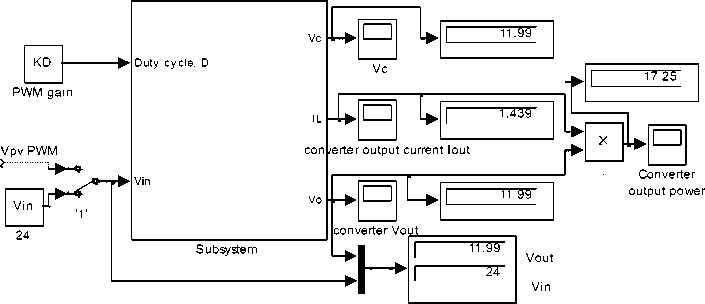
Fig.3 (b) Buck converter Simulink model, based on refined math model[2]
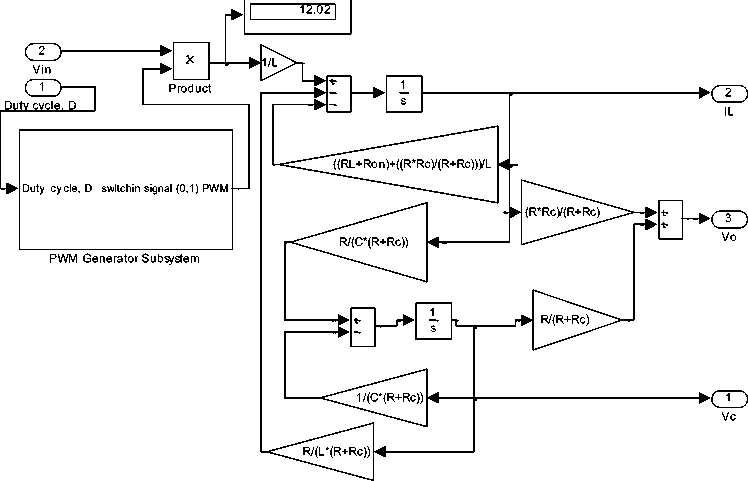
Fig.3 (c) buck converter subsystems model [2]
-
C. Generalized PVPC system model
In [2] generalized Photovoltaic panel-Converter ( PVPC) system Simulink model, shown in Fig.4(a), is developed by integration both PV panel and converters subsystems sub-models shown in Fig.3 and Fig.2 (e) with corresponding sub-models of subsystems shown in Fig.4(b). Another similar PVPC system Simulink model, is proposed and shown in Fig.4(c) will also be used to save space in present paper
Generalized PVPC system model shown in Fig.4(a), will be used in this paper to select, apply, test and analyze different control approaches to control output characteristics to meet desired values, the inputs to this model are solar irradiation β, T, V, cell surface area A, NS, NP and duty cycle D, by which the converter will operate to control outputs. The outputs of this generalized model are the maximum data required to test and analyze PVPC system characteristics including; P-I and P-V characteristics, the overall system, as well as each subsystem output current and voltage, voltage ,currents, power and efficiency ( this is shown in Fig.4(a)). Running this model for defined parameters in Table 1 will return the same visual numerical values shown in Fig.4(a) and P-I and P-V characteristics shown in Fig.2 (e)(f)
Duty cycle, D
|
D |
Step D
Duty cy cle
T
B
Irradiation, B
sun Irrad
V
.
Cell surface area A
Ns
Np
Converter current out
Converter voltage out
Volatges comparision
Converter Power out
PV panel Volt out
1.439

Converter current Iout
11.99
out
Vin
System Vin-Vout comparision

PV cell output curr
PV panel current out L
PV cell Volt out
PV cell current out
PV cell Power in
PV cell Power out
PV cell efficiency
Fill Factor
PV panel Power out
PV-Converter Subsystem


11.99
Converter Volt Iout
17.25

Converter Power out
[panel_Vout]
0.5
PV cell output volt
ell_Vout]

0.5
PV panel power in
0.6956

PV cell efficiency

1035 1 ___________
PV panel Power out
43.13

PV panel output current
1.438

PV cell output current
0.7188

PV cell output power
0.1445

PV Fill factor
Fig.4(a) Generalized PVPC system model
PV Panel Subsystem1
Fig.4(b) Generalized PVPC system sub-models consisting of three subsystems
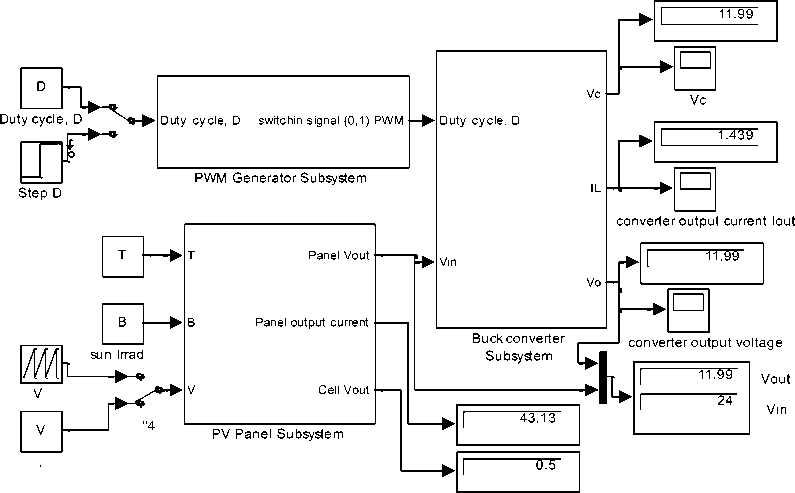
Fig.4(c) Photovoltaic panel-Converter PVPC system Simulink model consisting of three subsystems
-
III. PVPC System Proposed Control Approaches
-
A. Maximum Power Point, MPP and tracking MPPT
The power delivered by a PV system is dependent on the irradiance β, temperature T, and the current drawn from the cells V. To maximize a PV system's output power, it is necessary continuously tracking the maximum power point (MPP) in the I-V characteristic of the PV system, therefore, in a direct-coupled to the PV array systems, the PV array must usually be oversized to ensure that the load’s power requirements can be supplied, this lead to an overly expensive system. To overcome this problem, a switch-mode power converter, can be used to maintain the PV’s operating point at the Maximum Power Point MPP. The Maximum Power Point tracker MPPT, does this by controlling the PV array’s voltage or current independently of those of the load [20].
Maximum Power Point , MPP , is the operating point at which the power is maximum across the load and given by Eq.(11):
dP slope \mpp = =0 = 0
dP
-^- > 0 , at the left of MMP dP
-^- < 0 , at the right of MMP
This equation can be written in terms of voltage and current as follows:
P = V * I max max max
dP d (V*I) I * dV V * dI dI
= =+= I +V dV dV dV dV dV
Efficiency of solar cell is the ratio between the maximum power Pmax and the incident light power, and given by Eq.(12), where Pin is taken as the product of the solar irradiation of the incident light (G=p/1000), measured in W/m2, with the surface area ( A ) of the solar cell in m2 [22], and given by Eq.(13)
Based on this , for the operating point is at the MPP:
slope MPP
— = I + V d- = 0
dV dV
I + V — = 0 ^ — =
dV dV
I
V
П _ out _ max
For the operating point at the left side of the MPP:
in
in
P in
_ A * в
= 1000
slope left _ MPP
dP = I + vd- > 0
dV dV
dI dI
I + V --> 0 ^-->
To make best use of PV system, the output is maximized in two ways. The first is mechanically tracking the sun and always orienting the panel in such a direction as to receive maximum solar radiation under changing positions of the sun. The second is electrically tracking the operating point by manipulating the load to maximize the power output under changing conditions of insolation and temperature [23-26].
A maximum power point tracker (MPPT) is a technique used to get the maximum possible power from PV system, it is a high efficiency DC/ DC converter which functions as an optimal electrical load for a PV cell, most commonly for a solar panel or array, and converts the power to a voltage or current level which is more suitable to whatever load the system is designed to drive [23]. The goal of the MPPT is to match the impedance of load to the optimal impedance of PV array, the block Diagram of MPPT tracker is similar to one shown in Fig.1(a). In order to operate a PV system within its MPP, a maximum power point tracking algorithm is needed to search and maintain the peak power [4], the MPP in the I-V characteristic is not known a priori. It must be located, either through model calculation or by search algorithm, different MPPT algorithms are proposed in different sources [16-21]. Most of the MPPT algorithms search the MPP by comparing the output power of the PV module before, and after the duty cycle of the converter is changed [18], this algorithm can be explained as follows: Referring to Fig.2 (f), the property that is utilized to track the MPP , is based on that, from the shown shape of P-V characteristic, is that the slope ( dP/dV ) of P-V curve becomes zero at the MPP, where the slope ( dP/dV ) is the derivative of the PV module’s power with respect to its voltage, and has the following relationships with the MPP.
dV dV
I
V
For the operating point at the right side of the MPP:
slope lright _ MPP
dP dI
---= I + V-- dV dV
dI dI
I + V --< 0 ^--
dV dV
<
I
V
Practically, as shown in Fig.5(a),(d), Voltage is adjusted and power output is sensed; Voltage is increased as long as dP/dV is positive . If dP/dV is sensed negative , the operating voltage is decreased, if dP/dV is near zero, the voltage is held adjusted
Based on this, for any temperature and solar irradiation level, the proposed controller circuit is shown in Fig.5(b), where the output power is obtained by multiplying I PV by VPV , the power signal is derived ( dP/dt ), also the VPV is derived and then inverted to obtain signal 1/( VPV/dt) , then to obtain signal (dP/dV PV ) is obtained by multiplying 1/(dV/dt) by dP/dt , finally the signal (dP/dV PV ) is compared to zero and result is fed to PI controller.
Similarly, can be accomplished as follows; the power output of a PV system is given by:
P = V * I
With incremental change in current ΔI ,and voltage ΔV, the modified power is given by Eq.(14), by solving and then ignoring small terms, Eq.( 14) simplifies to Eq.( 15), since no changes power at peak point, that is ΔP=0,by manipulating and in the limits , will result in Eq.(mbn)
( P A P ) = ( V + A V ) * ( I +А / ) (14)
N P =A V *V +A I * I A V *V =-A I * I
( 15)
From this equation, two expressions may be used to calculate the error in power to be zero (∆P=0)
A V _dV _ V
Ai " di " I ’ d--L(16)
dII
Similary
A I _ di _ I
AV"" dVV ’ dII dV ” V
Vout
V PV
I PV
DC
Fig.5(b)
Maximum power point is obtained when dI/dP =0 . The present value and the previous value of the solar module voltage and current are used to calculate the values of dI and dP .
Perturb and observe algorithm; A detailed Simulink model of perturb and observe algorithm is shown in Fig.5(e). The VPV and IPV are taken as the inputs to MPPT unit, duty cycle D is obtained as output. In this perturb and observe algorithm a slight perturbation is introduced to the system. Due to this perturbation the power of the module changes. If the power increases due to the perturbation then the perturbation is continued in that direction, after the peak power is reached the power at the next instant decreases and hence after that the perturbation reverses. When the steady state is reached the algorithm oscillates around the peak point [20]
Fig.5(a)(b) block diagram installation of MPPT control system
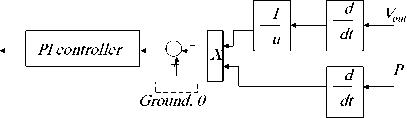
Fig.5(c)
V PV
I PV
3 Q
D
Control system
Fig.5(a)
I out
V out
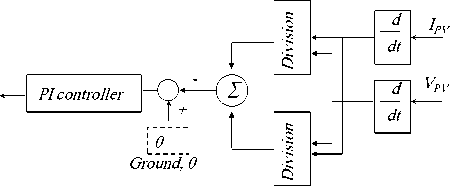
Fig.5(d)
Fig.5(c)(d) controller Two different circuits
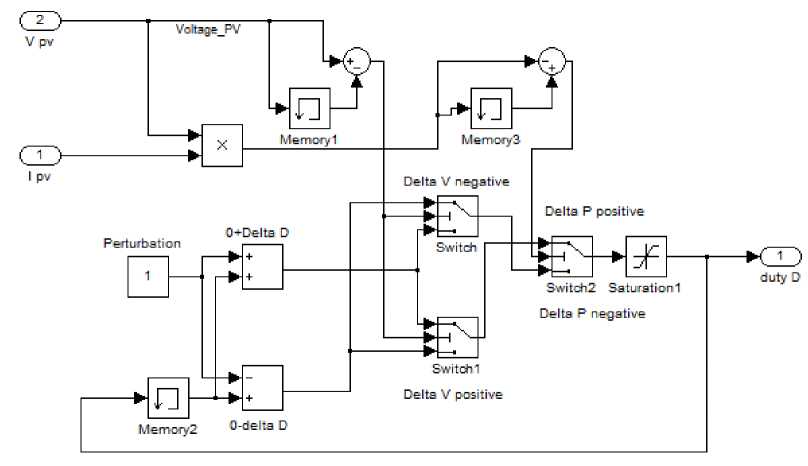
Fig.5(e) Perturb and Observe Algorithm simulation [20]
-
B. Matching converter's output (load's) current
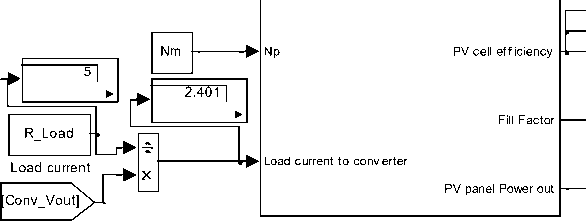
The Generalized Photovoltaic panel-Converter (PVPC) system shown Fig.4(a) can be used to match the load's output current, this is accomplished by introducing the output load as both load resistance RLoad and load current Iload to be matched, the proposed approach is shown in converter subsystem model in Fig.6(a), and Fig.6(b)(c) using feedback, the comparison between load's an converter's currents is used to match the currents, wher the output load is introduced as load resistance RLoa multiplied by converter output voltage resulting in loa current Iload (see Fig.6(b)), which is fedback to converter and compared with the converter output current Iconv, the difference is used to match the load's current.
Running this model for defined parameters in Table 1 and load resistance of Rload =5 Ohm , will result in matching the output load current of 2.396 A , converter's output voltage of 11.99 V , efficiency 0.4999 . Using the model of buck converter lying the same approach, similar results are obtained.
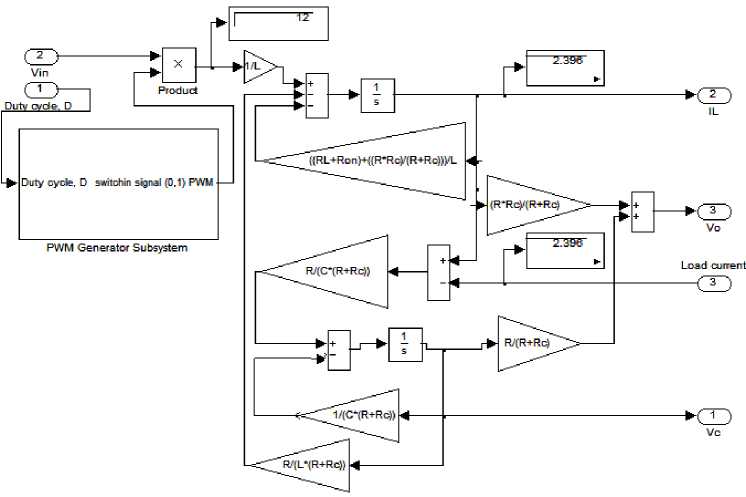
Fig.6(a) comparing load and c
PV-Converter Subsystem
Fig.6(b) Part of generalized model showing; the load resistance R Load , multiplied by converter output voltage resulting in load current ( 2.401 A ) , which is fedback to converter and compared with the converter output current
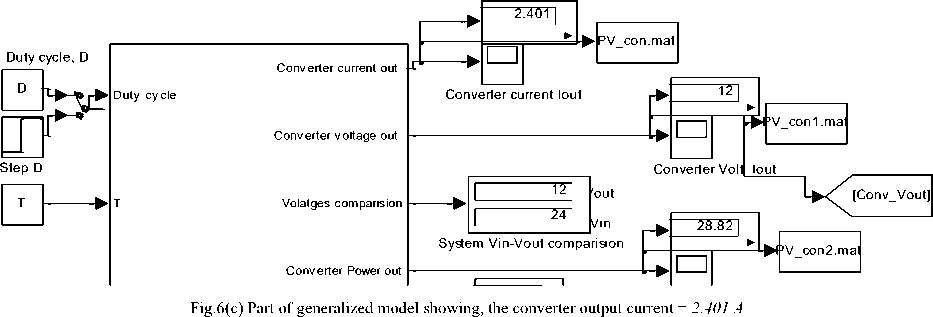
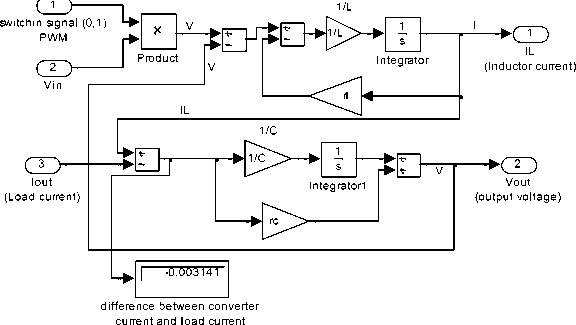
Fig.6(d) Matching output converter current using moderate accuracy model
C. Controlling the converter's output voltage to meet desired output (load) voltage
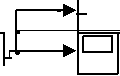
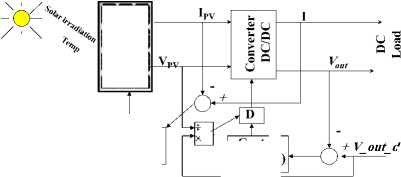
The block diagram of proposed system is shown in Fig.7(a), the generalized PVPC system model is used, and modified as shown to include control system and approach. The corresponding Simulink model is shown in Fig.7 (b). Generally, the duty cycle D is given by Eq.(17):
D =
V
Conv
out
desired
V
Panel
out
V . _ I outin
^ outin inout
TT
^ D =-- on— = o
Ton + Toff
Vv -v t = v ,(T- t )
in out on out on
Correspondingly, the buck converter voltages equation is given by Eq.(18):
VOMt = DVin
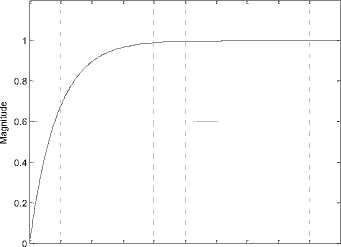
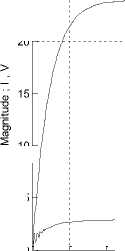
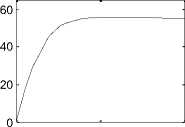
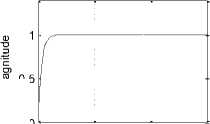
Testing the proposed model for desired converters output voltage , V out_desired = 12 V , at irradiation B= 200 and temperature T=75, and PVPC system parameters values defined in Table 1, will result in all data required to analyze the PVPC system performance and outputs, including converter output volts of 12 V, PV panel output voltage of 24 V, and duty cycle of D= 0.5 , these values and other are numerically shown in Fig.7 (b), the plots of PV panel output voltage, converter output voltage and converter output current are shown in Fig.7(c), the control signal is shown in Fig.7(d). Since the converter desired output voltage and converter actual output voltage are compared and used by PI-controller, the D block can be removed and the controller will generate the D signal to control Converter to meet desired output voltage.
By varying the duty cycle D , of the converter switch, the converter output voltage V out can be controlled, in the proposed model, the duty cycle D cycle is calculated automatically ,as the ratio of converter's voltage to desired output voltage, and given by Eq.(19). The desired converter output voltage and the converter actual output voltage are compared to calculate the error signal, used by PI controller to drive the converter switch according to the calculated duty cycle. The PV panel is given as a function of V = f(V,G,T), the load current R load is not considered.
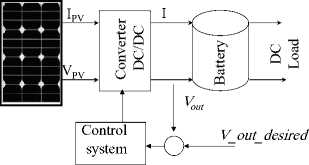
Fig.7 (a) Block diagram installation of proposed control system
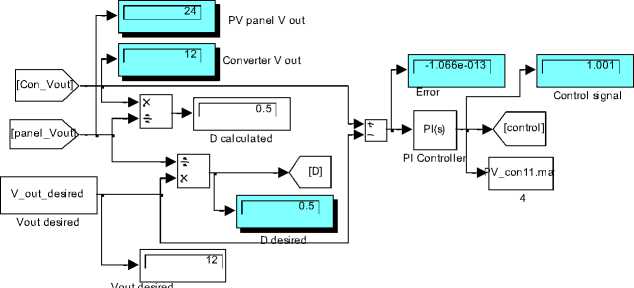
Fig.7 (b) the simulation of control system
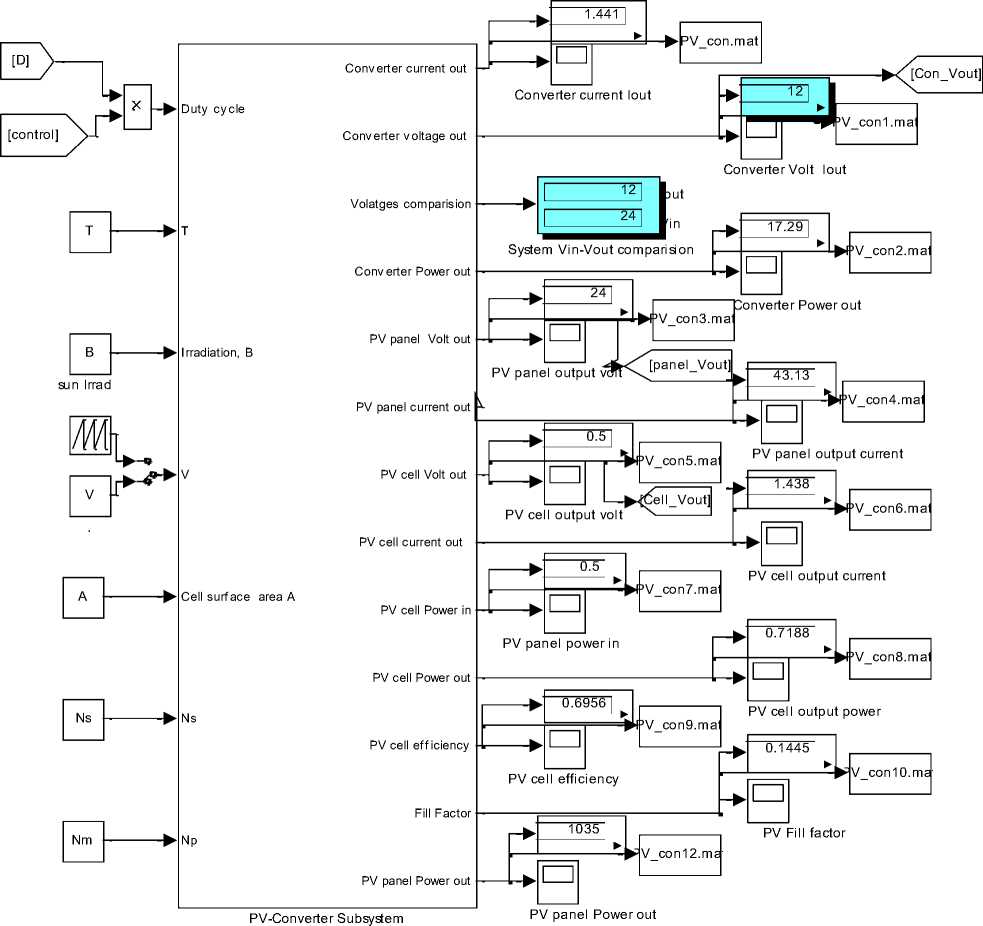
Fig.7 (b) Proposed model for converter output V control to meet desired output load voltage
Model readings PV_Vout , Conv_Vout, Conv_Iout
Input Voltage to Converter; PV_Vout
Magnitude ; I , V
Converter output Voltage; Vout
Converter output current; Iout
X: 0.324
Y: 12
Control signal
0 0.01 0.02 0.03 0.04 0.05 0.06 0.07 0.08 0.09 0.1
Time (s)
Fig.7 (d) Control signal
0 0.05 0.1 0.15 0.2 0.25 0.3 0.35 0.4
Time (s)
Fig.7 (c) PVPC system output readings ;voltage, converter output voltage and current
D. Controlling the converter's output voltage to meet desired output voltage according to the measured load current.
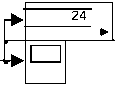
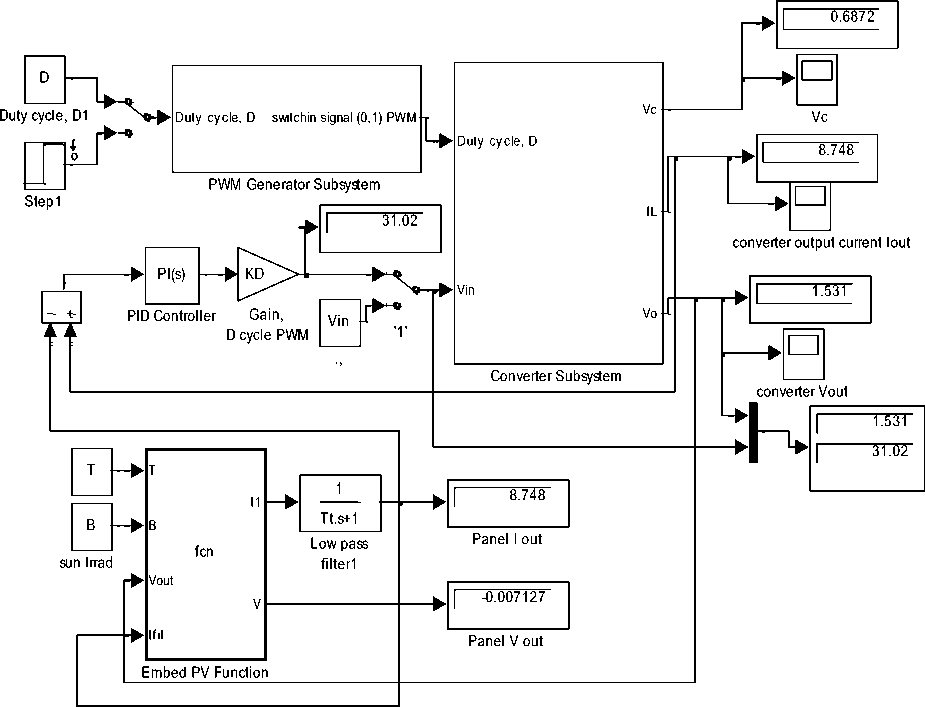
The block diagram of proposed system is shown in Fig.8(a), The corresponding Simulink model is shown in
Fig.8 (b)(c).In the proposed model, the duty cycle D, is calculated by model automatically, by dividing the PV panel output voltage over desired converter output voltage.
Converter's output voltage and current are measured, the Converter's current is compared with PV panel output current and the difference is fedback to PV panel to calculate the PV panel output voltage , where PV panel is given as a function of V = f(I,G,T) , with two outputs including PV panel current, the generated PV panel voltage is fed to converter. The PI controller measures the error between desired output voltage and converter actual output voltage and used it to drive the converter to meet desired output voltage.
Testing the proposed model for values of V_out_desired= 6 V, at irradiation B=200 and input temperature T=75., will result in output volts of 6 V, output current of 0.7203 A, duty cycle of D=0.25 , these values and other are visually shown in Fig.8 (b)(c) , the plots of PV panel output voltage, converter output voltage and converter output current are shown in Fig.8 (d), the control signal is shown in Fig.8 (e)
+V o u td esired
Control system
Fig.8(a)block diagram installation of proposed control system
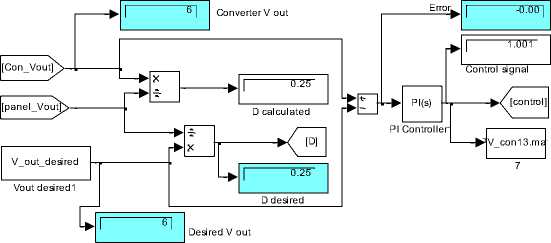
Fig.8(b) control system model
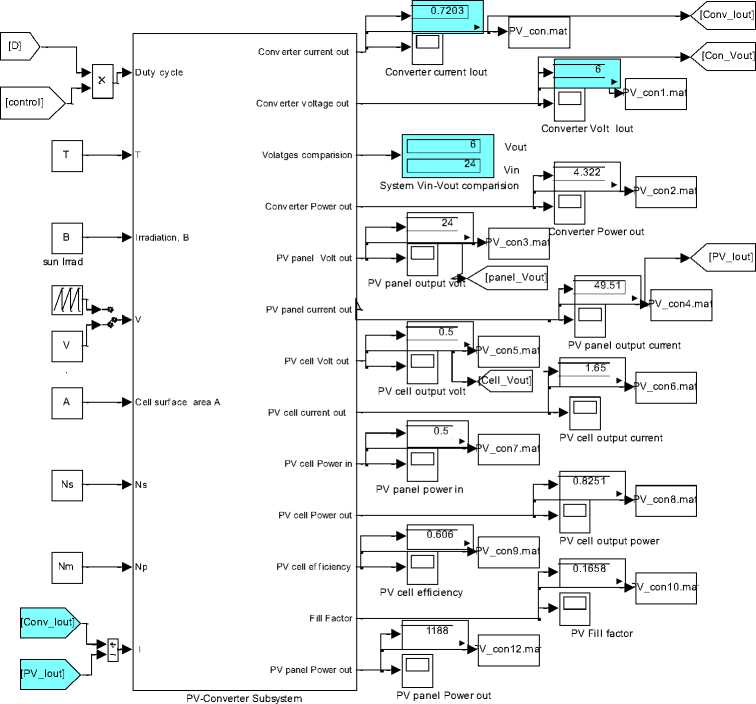
Fig.8(c) model for Controlling the converter's output voltage to meet desired output (load) voltage according to the measured load current
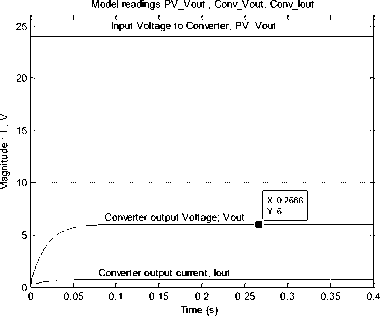
Fig.8(d) PVPC system output readings ;voltage, converter output voltage and current
control signal of 1.001, the control signal is shown in
Fig.9 (e)
I

V PV
I PV
$ 9
о В
D
Control system
+

-
I
V out
В J
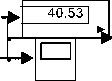
Fig.9(a) The block diagram of proposed system
Model readings PV_Vout , Conv_Vout, Conv_Iout
Input Voltage to Converter; PV_Vout
Control signal
0.05 0.1 0.15 0.2 0.25 0.3 0.35 0.4
Time (s)
Converter output Voltage; Vout
Converter output current; Iout
X: 0.1906
Y: 2.881
0 0.02 0.04 0.06 0.08 0.1 0.12 0.14 0.16 0.18 0.2
Time (s)
Fig.8(e) The control signal
Fig.9 (c) model output readings; voltage, converter output voltage and current
E. Controlling both PV panel's and converter's output voltages based on the converter's output current.
The block diagram of proposed system is shown in Fig.9(a), the corresponding Simulink model is shown in Fig.9 (b).In proposed model, the converter's output voltage and current values are measured, the PV panel output voltage is controlled and calculated according to the measured converter's output current , where the converter's output current is fed to PV panel, which is given as a function of V = f(I,B,T,V)). Both, the PV panel output voltage and the converter's output voltage are fed to PI controller, to calculate the error between them, and generate an appropriate both control signal and duty cycle D, by which the converter will be controlled.
Testing the proposed model for load current values, at irradiation β=200 and temperature T=75 ., will result in output volts of 24 V of both PV panel and converter and converter output current of 2.881 A and control signal of 2.01 , these values and other are visually shown in Fig.9 (b) , the plots of PV panel output voltage, converter output voltage and converter output current are shown in Fig.9 (c), the control signal is shown in Fig.9 (d). Since the output desired voltage and converter output voltage are compared and used by PI-controller, the D block can be removed and the controller will generate the appropriate duty cycle D signal to control Converter to meet desired output voltage. Running the model with the D block removed will result in same results but with
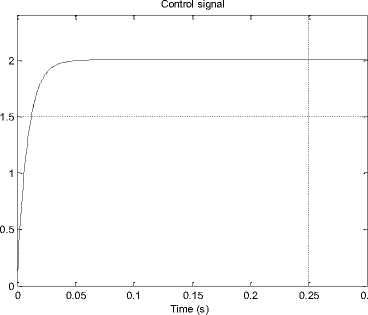
Fig.9 (d) Control signal with D block inserted
Control signal
0.8

0.6
0.4
0.2
0.05 0.1
0.15 0.2 0.25 0.3 0.35 0.4
Time (s)
Fig.9 (e) Control signal without duty cycle D block
[control]

Duty cycle
Converter voltage out
T
Irradiation, B sun Irrad
V
.
Cell surface area A

Ns

Np
[Conv_Io]
I
Converter current out
Volatges comparision
Converter Power out
PV panel Volt out
2.881
Converter current Iout

out
Vin
24 ]
PV cell output current
PV panel current out L
PV cell Volt out
PV cell current out
PV cell Power in
PV cell Power out
PV cell efficiency
Fill Factor
PV panel Power out
PV-Converter Subsystem
0.5]

Converter Volt Iout
System Vin-Vout comparision

69.15

nv I o]
nv V o]
Converter Power out
^^^^
[panel_Vout]
PV cell output volt
ell_Vout]
PV panel output current
1.351"1


PV panel power in


PV cell efficiency
972.6

PV cell output current

0.6754
^^^^
PV cell output power
0.1357 1

PV Fill factor
PV panel Power out
Fig.9 (b1) model for controlling the PV panel and converter output voltages based on the converter's output current.
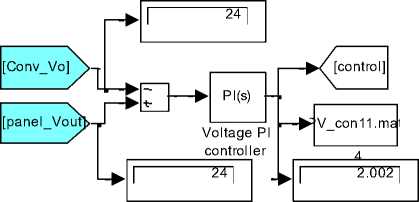
Fig.9 (b2) control system model
As shown in Fig.10, The load is introduced as resistance R Load =5 ohm, the duty cycle D cycle is calculated in two ways and the switch 4 is to select between them, first model automatically, calculate D by Eq.(20), or by Eq.(21) as the ratio of converter's output voltage and defined desired output voltage
V
Conv __ out
V
Panel
out
F. Sub-block to test and analyze the effect of feeding PVPC system output currents to PV panel to control or match converters outputs.
To study and analyze the effect of feeding any or combination of converter and PV panel currents to PV panel, the model shown in Fig.10 is used, where switches are used to select the desired current to be fed to PV panel, which is given as a function of V = f(I,B,T,V)), to generate the panel volt.
D =
V
Conv
out
desired
V
Panel
out
Testing the model for Matching converter's output voltage by feeding to PV panel the current difference between the converter's and PV panel output currents, shows by switching switches 2 and 3 to pass the current difference to PV panel , will result in converter's output voltage of 24 V and current of 2.881 A(Fig.10)
Testing the model ut current, shows; By fe to PV panel by switching it, the converter' output c he value of 2.881 A and voltage of 24 V, Similarly, these switches can be used to study the effect of feeding different values to PVPC system
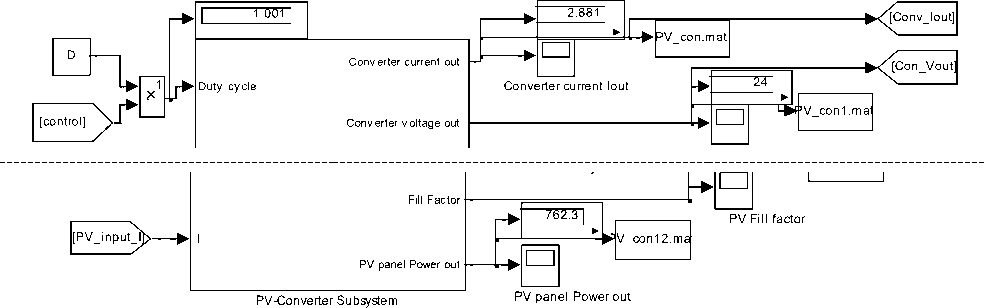
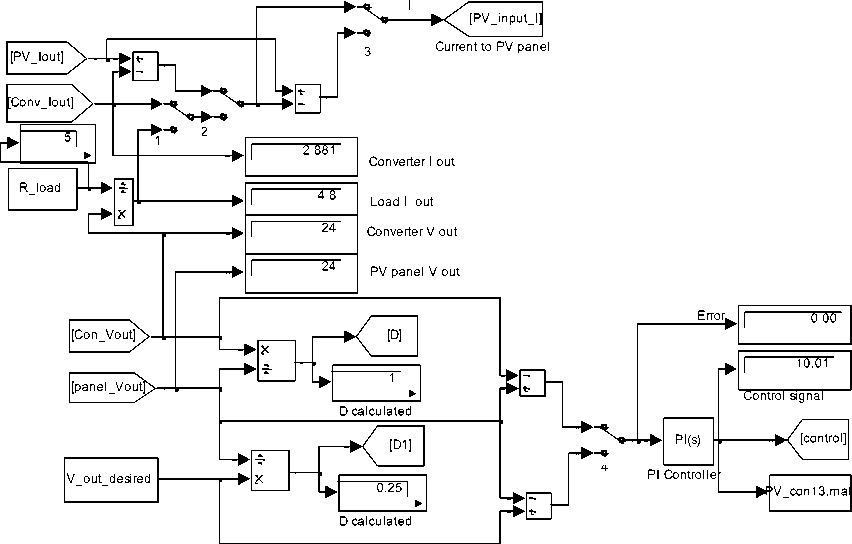
Fig.10
G. Controlling the converter's both output voltage and current to meet desired output voltage under given irradiation B and temperature T.
The block diagram of proposed system is shown in Fig.11(a), to save space in this paper, another similar Simulink model is proposed and shown in Fig.11 (c). In proposed model, the desired output voltage value is selected, the duty cycle D, is calculated as ratio of converter's output voltage and desired output voltage as given by Eq.( 21). The duty cycle can also be calculated as the ratio of input current to desired output current in case of output current control, and correspondingly, the desired output current value is to be selected. The converter's output voltage and current values are measured. Next, both, the converter's and PV panel output currents are fed to PI-current controller to calculate the error between them, and generate control signal to control PV input current, the PV panel is given as a function of V = f(I,B,T) to result in corresponding panel output voltage. On the other hand, as shown in Fig.11(b) the converter's and desired output voltages are fed to PI voltage controller to calculate the error between them, and generate control signal to control converter according to calculated duty cycle D.
VI
-uty- = D = n ^ V
V in
I out
I
' . = D *V_ ^ I . = out in out
Testing the proposed model for desired output converter's voltage 18V,at irradiation β=200 and temperature T=75, will result in converter's output voltage of 18V and converter-load current of 2.161 A , PV-panel output current of 2.161 A, these values are held constant, other values are visually shown in Fig.12(a) , the plots of PV panel output voltage, converter output voltage and converter output current are shown in Fig.12 (b), the control signals are shown in Fig.12 (c)
D desired
Control system(1)

Control
System(2)
Fig.11(a) The block diagram of proposed system
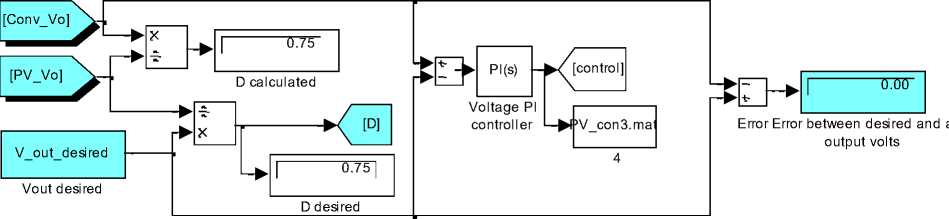
Fig.11(b) Simulink model of proposed system
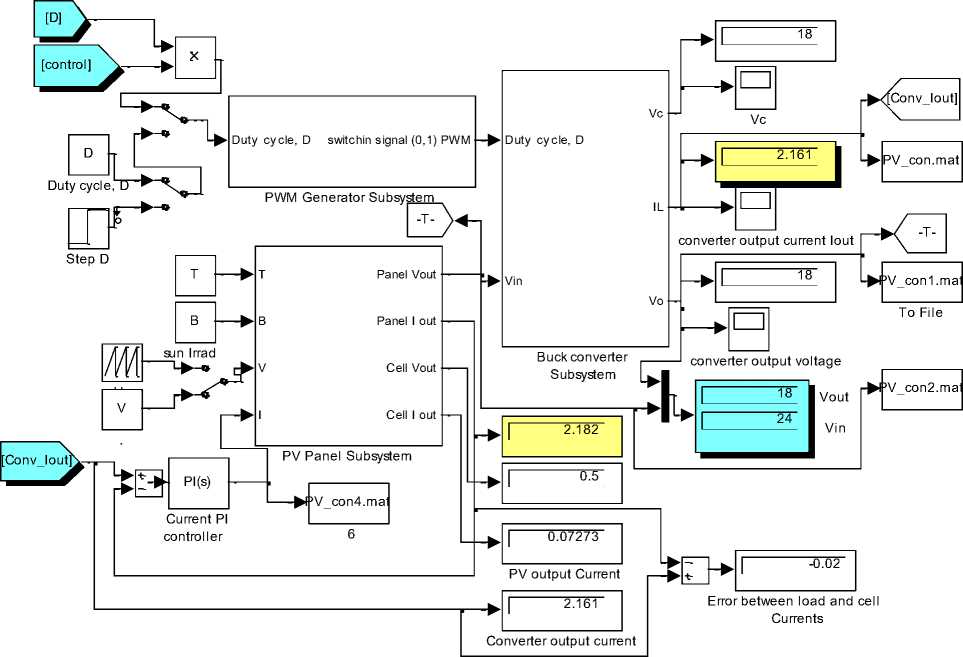

Fig.11(c) Simulink model of proposed system
Model readings PV_Vout , Conv_Vout, Conv_Iout
Input Voltage to Converter; PV_Vout

Converter output Voltage; Vout
Converter output current; Iout
X: 0.1836
Y: 24

0 0.02 0.04 0.06 0.08 0.1 0.12 0.14 0.16 0.18 0.2
Time (s)
Fig.12 (b) PVPC system output readings;
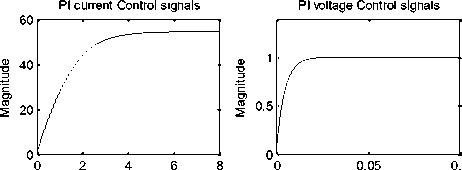
PI current and volt Control signals
0 0.5 1
Time (s) x 10 -3
Fig.12 (c) PI control signals (current and voltage control)
PI voltage Control signals
0.5
0 0.1 0.2 0.3
Time (s)
with PV panel output voltage and the difference is fed to PI voltage controller to generate signal to control converter to result in desired converter's output voltage. Similarly the converter's output current is compared with PV panel output current, the difference is fed to second PI current controller to generate signal to control converter to result in desired current.
Testing the proposed model for meeting both output converter's voltage and current at irradiation β=200 and temperature T=75 , and defined in Table 1 parameters, will result in panel's and converter's output voltage of 24V and current of 2.881 A , other values are visually shown in Fig.13 (a) , the plots of PV panel output voltage, converter output voltage and converter output current are shown in Fig.13 (c), the control signals are shown in Fig.13 (d), tuning PI current control will reduce time to steady state error and result in control signals shown in Fig.13 (e).
V PV
Control
System(2)
I PV
I
V out
+
H. Controlling the converter's both output voltage and current to meet both voltage and current.
The proposed Simulink model shown in Fig.11 (a), can be modified to have the form shown in Fig.13 (a)(b) , and be used to control both converter's both output voltage and current, the converter's output voltage is compared
Control system(1)
Fig.13 (a)
+
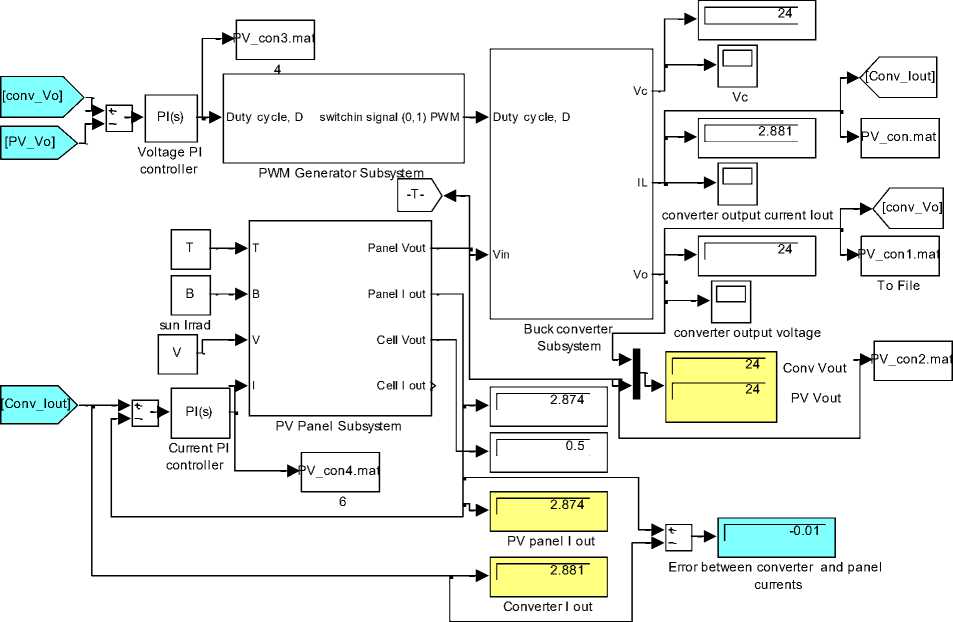
Fig.13 (b) Simulink model of proposed system
Model readings PV_Vout , Conv_Vout, Conv_Iout
Input Voltage to Converter; PV_Vout
Vout
Converter output Voltage;
Converter output current; Iout

0 0.02 0.04 0.06 0.08 0.1 0.12 0.14 0.16 0.18 0.2
Time (s)
Fig.13 (c) PVPC system output readings
Time (s)
Time (s)
Fig.13 (d) The control signals
PI current Control signals
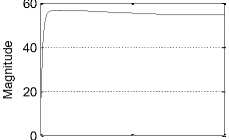
0.5
Time (s)
1 x 10⁻³
PI voltage Control signals
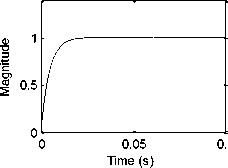
Fig.13 (d) The control signals
-
I. Controlling PVPC system outputs applying PV panel as defined as user defined function
As shown in Fig.2(b) PV cell (panel) can be represented in MATLAB/Simulink as user defined function[2], with three inputs V, β, and T and two outputs current and voltage , a low pass filter is added to convert static model into a dynamic model (and to overcome algebraic loop problem). The transfer function of low-pass filter is given by Eq.(19) , where the current now is prefilter current. This PV panel model is integrated with control system and buck converter model (refined or simplified) to result in general model shown in Fig.14, the prefilter current is fed to PI-controller and the control signal is used according to is duty cycle to control converter switch, this proposed model can be used to apply different approaches to control outputs pf PVPC system including PV panel output current. Also PV panel model shown in Fig.2(a) can be modified to return both PV panel current and volt at given β,T,V, and used to built similar model a. Controlling converter's output current to match PV panel output current, the approach is shown in Fig.14, using two different representations of buck converters (simplified and refined buck converters models taken from reference [2]), in this approach, the panel output filter current is fed , simultaneously, to PV panel which is given as a function of two inputs and two outputs, and the PV current is compared with converter current, and the difference is fedback to PI controller to drive the converter switches with duty cycle D, to result in desired output current. Testing this model for defined parameters in Table 1 , will result in output current of 8.748 A, of both converter and PV panel, these values are shown in visual data readings in Fig.14.
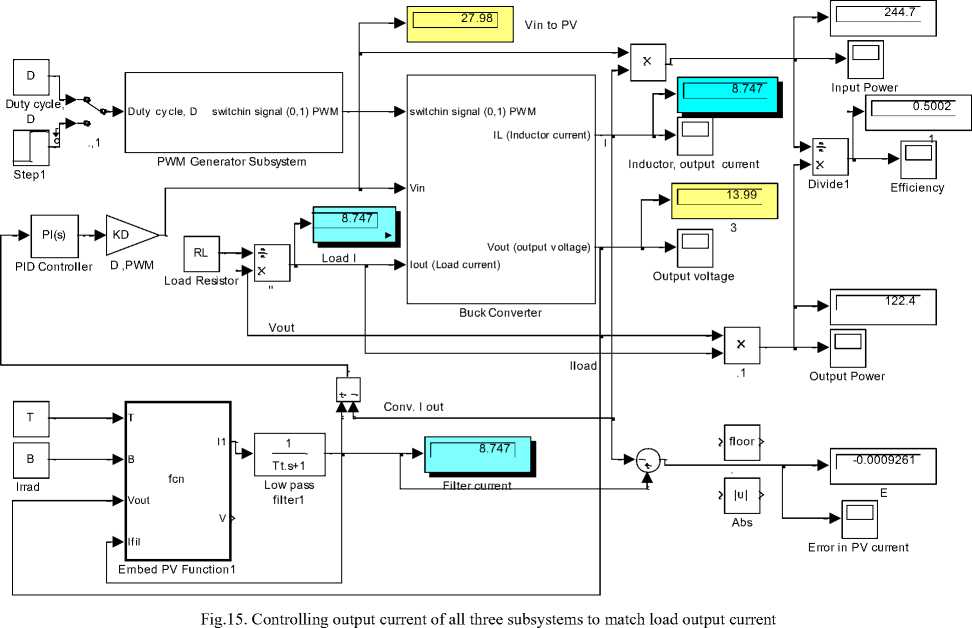
b. Controlling output current of all three subsystems to match load output current
The proposed Simulink model is shown in Fig.15, this accomplished by in introducing output load as load resistance RLoad and load current Iload to be matched, the output load resistance R Load , is multiplied by converter output voltage resulting in load current I load , which is compared with the converter output current I conv , the difference is fedback to converter and used to match the load current . On the other hand the PV panel output current is compared with converter output current and the difference is used by PI control to math both currents
Testing this model for defined parameters in Table 1 , and load resistance of R Load =1.6 Ohm, will and current of 8.747 A, will result in matching and subsystems current to be 8.747 A and converters output voltage of 13.99 V at duty cycle of D= 0.5 , these all are shown in visual data readings in Fig.15.
-
IV. Conclusion
Different control approaches and corresponding models are derived, developed and tested, to control both outputs of overall Photovoltaic-converter system and each subsystem outputs, for a given system parameters, under given working conditions and variable input from PV panel, to meet overall PVPC system desired output characteristics, performance and desired values of voltage and current. The proposed models and control approaches were implemented and tested using MATLAB/Simulink.
As a future work, Photovoltaic-Converter system to developed, the proposed scenarios to be tested.
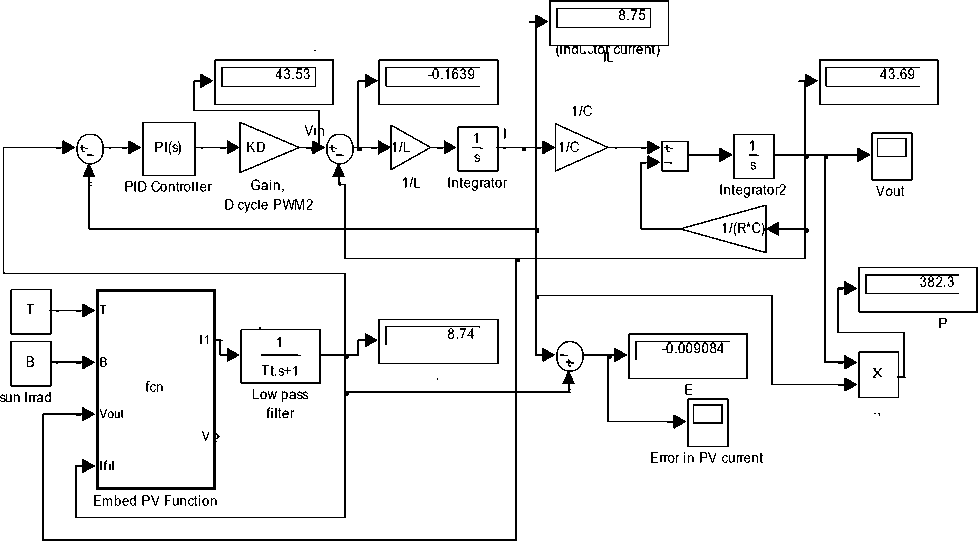
Fig.14(a) PV panel as user defined function, with simplified converter model for controlling output current of 8.784 A
Vout
Vin
Fig.14(b) controlling currents 8.748 A using refined converter model
References Modeling, Simulation and Control Studies on Photovoltaic-Converter System for Mechatronics Design of Solar Electric Application
- Farhan A. Salem, Ahmad A. Mahfouz , A Proposed Approach to Mechatronics Design and Implementation Education-Oriented, Innovative Systems Design and Engineering , Vol.4, No.10, pp 12-39,2013.
- Farhan A. Salem , Modeling and Simulation issues on Photovoltaic modules, for Mechatronics design of solar electric applications, IPASJ International Journal of Mechanical Engineering (IIJME),Volume 2, Issue 8, August 2014
- Farhan A. Salem New Generalized Photovoltaic panel-Converter system model for Mechatronics solar electric applications, International Journal of Scientific & Engineering Research, Volume 5, Issue 8,August-2014
- Walker G.. Evaluating MPPT converter topologies using a MATLAB PV model. Journal of Electrical and Electronics Engineering, Australia, IE Aust. 21(1): 49-56,2001.
- J. Surya Kumari , Ch. Sai Babu,Mathematical Modeling and Simulation of Photovoltaic Cell using Matlab-Simulink Environment, International Journal of Electrical and Computer Engineering (IJECE), Vol. 2, No. 1, pp. 26~34, Feb. 2012.
- E.M.G. Rodrigues,, R. Melício,V.M.F. Mendes3 and J.P.S. Catalão ,Simulation of a Solar Cell considering Single-Diode Equivalent Circuit Model, The International Conference on Renewable Energies and Power Quality (ICREPQ'14), Cordoba 8-10 April, 2014.
- Basim Alsayid, Modeling and Simulation of Photovoltaic Cell/Module/Array with Two-Diode Model, International Journal of Computer Technology and Electronics Engineering (IJCTEE), Volume 1, Issue 3, June 2012.
- Ramos Hernanz, JA., Campayo Martín, J.J., Zamora Belver, I.,, Larrañaga Lesaka, J.,, Zulueta Guerrero, E., Puelles Pérez, E. Modelling of Photovoltaic Module. International Conference on Renewable Energies and Power Quality(ICREPQ’10), Granada (Spain), 23th to 25th March, 2010.
- Dorin PETREUS, Cristian FARCAS, Ionut CIOCAN, modeling and simulation of photovoltaic cell, ACTA TECHNICA NAPOCENSIS Electronics and Telecommunications, Volume 49, pp 42-47,N. 1, 2008
- F. Yusivar, M. Y. Farabi, R. Suryadiningrat, W. W. Ananduta, and Y. Syaifudin ,Buck-Converter Photovoltaic Simulator, International Journal of Power Electronics and Drive System (IJPEDS) , Vol.1, No.2, December 2011, pp. 156~167
- Samer Alsadi, Basim Alsayid ,Maximum Power Point Tracking Simulation for Photovoltaic Systems Using Perturb and Observe Algorithm, International Journal of Engineering and Innovative Technology (IJEIT), Vol 2, Issue 6, pp80-85,December, 2012
- Mukesh Kr. Gupta, Rohit Jain , Design and Simulation of Photovoltaic Cell Using Decrement Resistance Algorithm, Indian Journal of Science and Technology , pp 4537-4541Vol 6 (5) , May 2013
- N. Pandiarajan and Ranganath Muthu,Mathematical Modeling of Photovoltaic Module with Simulink, International Conference on Electrical Energy Systems (ICEES 2011), pp314-319, 3-5 Jan 2011
- M. G. Villalva, J. R. Gazoli, E. Ruppert F.,MODELING AND CIRCUIT-BASED,SIMULATION OF PHOTOVOLTAIC ARRAYSBrazilian Journal of Power Electronics, 2009 vol. 14, no. 1, pp. 35--45, ISSN 1414-8862.
- Huan-Liang Tsai, Ci-Siang Tu, and Yi-Jie Su, Member, IAENG,Development of Generalized Photovoltaic Model Using Matlab/Simulink, Proceedings of the World Congress on Engineering and Computer Science, WCECS 2008, October 22 - 24, 2008, San Francisco, USA
- M. K. Gupta, Rohit Jain, Anjali Goswami, design and simulation of photovoltaic system using advance MPPT , International Journal of Advanced Technology & Engineering Research (IJATER), pp.73-77,Vol. 2, Issue 4, July 2012
- A.Pradeep Kumar Yadav , S.Thirumaliah , G.Haritha, Comparison of MPPT Algorithms for DC-DC Converters Based PV Systems, International Journal of Advanced Research in Electrical, Electronics and Instrumentation Engineering Vol. 1, Issue 1, July 2012
- Issam Houssamo,. Maximum power tracking for photovoltaic power system: development and experimental comparison of two algorithms, Renewable Energy. pp. 2381-2387. 2010.
- M. Abdulkadir, A. S. Samosir, A. H. M. Yatim and S. T. Yusuf , A new approach of modeling and simulation of MPPT for photovoltaic system in Simulink model, ARPN Journal of Engineering and Applied Sciences, VOL. 8, NO. 7, pp, 488- 494, July,2013
- Samer Alsadi, Basim Alsayid ,Maximum Power Point Tracking Simulation for Photovoltaic Systems Using Perturb and Observe Algorithm, International Journal of Engineering and Innovative Technology (IJEIT), Vol 2, Issue 6, pp80-85,December, 2012
- Sree Manju B , Ramaprabha R , Mathur B.L Design and Modeling of Standalone Solar Photovoltaic Charging System, International Journal of Computer Applications, Vol.18, No.2, pp.41-45,March 2011
- S. Sheik Mohammed, Modeling and Simulation of Photovoltaic module using MATLAB/Simulink, International Journal of Chemical and Environmental Engineering, Volume 2, No.5 , 2011,
- Abu Tariq, Mohammed Asim, Mohd.Tariq, Simulink based modeling, simulation and Performance Evaluation of an MPPT for maximum power generation on resistive load, 2nd International Conference on Environmental Science and Technology IPCBEE vol.6 (2011)
- H. D. Maheshappa 1998, J. Nagaraju e.t M.V. Krishna Murthy. “An Improved Maximum Power Point Tracker Using Step- Up Converter With Current Locked Loop”. Renewable energy, vol.13, N°22, 1998, pp195-2011
- Altas. I, A. M. Sharaf, 2007 “A photovoltaic array (PVA) simulation model to use in Matlab Simulink GUI environment.” IEEE I-4244-0632 -03/07.
- Khan, B.H., (2006), Renewable energy resources,TataMcGraw-Hill Publishing Company Limited, New Delhi, India.
