Моделирование ночных свечений красной и зеленой линий атомарного кислорода для умеренно возмущенных геомагнитных условий на средних широтах

Автор: Тащилин А.В., Леонович Л.А.
Журнал: Солнечно-земная физика @solnechno-zemnaya-fizika
Статья в выпуске: 4 т.2, 2016 года.
Бесплатный доступ
В работе представлены результаты исследования среднеширотных сияний на основе оптических измерений и теоретического моделирования. Моделирование показало, что высыпания могут вызывать свечение в красной и зеленой линиях атомарного кислорода опосредствованно, путем увеличения скоростей ионообразования и нагрева тепловых электронов, что приводит к увеличению скорости диссоциативной рекомбинации и возбуждения уровней 1 D и 1 S при столкновениях с тепловыми электронами.
Ионосферное возмущение, свечение верхней атмосферы, геомагнитные бури, моделирование
Короткий адрес: https://sciup.org/142103622
IDR: 142103622 | УДК: 550.338 | DOI: 10.12737/21491
Текст научной статьи Моделирование ночных свечений красной и зеленой линий атомарного кислорода для умеренно возмущенных геомагнитных условий на средних широтах
An analysis of observational data on atmospheric 557.7 and 630-nm atomic oxygen emissions, which were acquired in Eastern Siberia (52 ° N, 103 ° E) during moderate geomagnetic storms, has revealed disturbances of intensity variations [Leonovich et al., 2012; Leonovich et al., 2015]. Figure 1 illustrates the behavior of parameters of near-Earth space ( B z component of the interplanetary geomagnetic field, solar wind proton density, Dst variations and nocturnal emission intensity of atomic oxygen in the red (630 nm) and green (557.7 nm) lines during weak (April 4–6, 2008: K p max =5, A p max =45, Dst =–40) and moderate (September 23–24, 2006: K p max =7, A p max =45, Dst =–60; April 5–8, 2010: K p max =7, A p max>100, Dst =–80) geomagnetic storms. By comparison, Figure 2 shows variations in the intensity of the emissions for quiet geomagnetic conditions. We can note an increase in the red emission intensity by ≥100 R which is significant for middle latitudes.
To interpret the observed intensity of the atomic oxygen nightglow in the 557.7 nm and 630 lines, model calculations were performed for vertical profiles of volume and integral emissions, which can occur in the nighttime mid-latitude ionosphere under the impact of incoming electron fluxes with different mean and integral energies.
This interpretation is based on the assumption [Leonovich et al., 2015] that electrons penetrate into mid-latitude L shells, where they are trapped, while drifting from the inner magnetosphere under strengthening of the convection electric field during a preceding magnetic storm. Then, during the 94
next geomagnetic storm, the trapped electrons are intensively scattered by magnetosonic waves [Hasegawa, 1976; Goertz, 1984; Leonovich, Mazur, 1989]. This causes them to precipitate into the lower ionosphere. It is known that trapped charged particles undergo an azimuthal drift, which leads (provide) to their longitudinal distribution up to the daytime sector during strong magnetic storms.
The aim of this work is to study the dependence of the vertical structure of the ionosphere and oxygen emissions on characteristics of precipitating electrons, which can affect the nighttime mid-latitude ionosphere during magnetic storms of varying intensity.
PROBLEM FORMULATION AND METHOD OF INVESTIGATION
Let us consider the mid-latitude upper atmosphere at 90–700 km, which consists of neutral particles (N 2 ,
O 2 , O, N, NO), thermal electrons, and ions N2 + ,O2 + ,O + ,N + ,NO + .
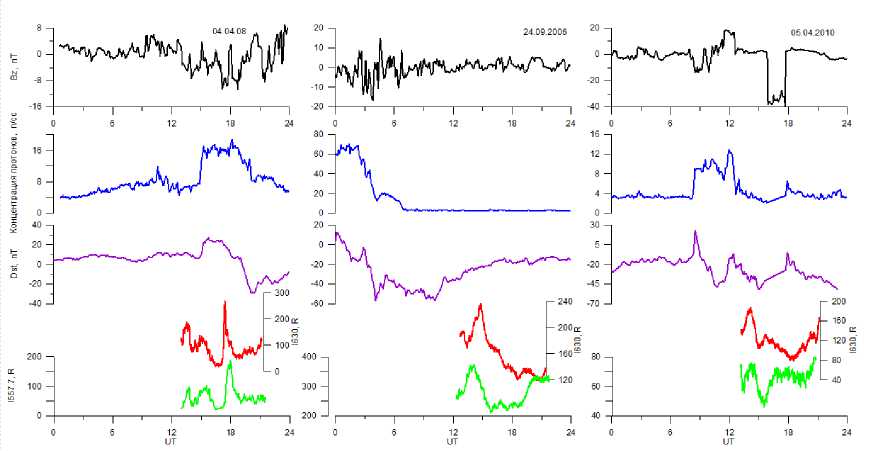
Figure 1. Parameters of near-Earth space and intensities of atomic oxygen emissions in the 557.7 and 630 nm lines during weak and moderate geomagnetic storms
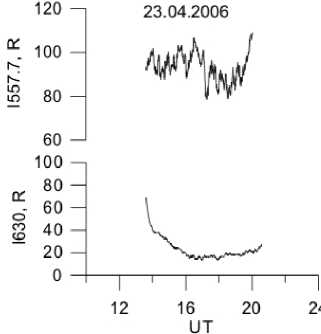
Figure 2. Behavior of the intensity of atomic oxygen emissions in the 557.7 and 630 nm lines under quiet geomagnetic conditions
At night when photoionization is absent, sources of charged particles are the O + flux from the plasmasphere P * through the upper boundary of the ionosphere ( h *=700 km) and the impact ionization of neutral particles by superthermal electrons (STE) precipitating from the inner magnetosphere. We assume that the precipitating electron beam is isotropic in pitch angles and has a Maxwell energy distribution
ДР I I .
I ( E ) = PE exp I--I , cm-2s-1eV-1, 3
E aver V. E aver 7
where E is the energy, P e is the integral energy flux in the beam, E aver is the average energy of the beam.
These sources in the ionosphere can ensure stationary height distributions of ionic composition, electron and ion temperatures, energy spectra of STE and oxygen atoms in excited metastable 1 D and 1 S states. The last ones generate oxygen emissions in the red (630 nm) and green (557.7 nm) lines respectively.
Ionic composition
Stationary vertical profiles of O + O2, N + , NO + ions are calculated using equations for continuity and motion along geomagnetic field lines in the diffusion approximation [Krinberg, Tashchilin, 1984]:
d- ( nV ) = Q i + Q c - n , ds т i
- k d (nT) - k d (neTe) + G mini ds mine ds ||
= V^v„ + £v*(V -Vj), nj where s is the distance along the field line related to the height h as h = s • sin I; I is the magnetic field line inclination; ne = ^ ni is the electron density; Te and Ti are electron and ion temperatures; mi, ni, Vi are the mass, density, and velocity of i-type ions; Qi is the rate of ion formation under corpuscular ionization; Qich is the rate of ion formation by chemical reactions; τi is the characteristic time of recombination of i-type ions by chemical reactions; k is the Boltzmann constant; vin and vj are frequencies of collisions of i-type ions with neutrals and with each other; G || is the projection of the total acceleration of gravity and centrifugal forces on the field line.
The ion density N + is estimated in the local equilibrium approximation by the formula
[N + ] = т +( Q + + Q ch ).
-
2 n + N + N +
Chemical reactions between charged and neutral particles, which are included in the model, are listed in the Table.
The rate of ion formation Qn under impact ionization of n -type neutral particles by energetic (superthermal) electrons is described by [Кринберг, Тащилин, 1984]
Q n ( E , h ) = 4 n N ( h ) J I n ( E p , E ) Ф о ( E p , h ) dE p ,
where I n ( E p , E ) is the differential cross-section of ionization of n -type neutral particles by electron impact with resulting formation of a secondary electron with the energy E ; Ф о( E p , h ) dEp is the isotropic part of the superthermal electron flux with energies from E p to E p + dE p at h .
Ionospheric temperatures
If no distinction is made between temperatures of individual ionic components, equations for heat balance of charged particles in the nighttime ionosphere can be written as [Krinberg, Tashchilin, 1984; Schunk, Nagy, 2009]


= Q + £ ^e V*, ( T - T* )-E Г., imi n
d ( dT ) — I к i— I ds( ds J
V *. ( T . - T ) + 2 " n. „ n,, m n + mi
( T n - T ) ,
where к * and к , are coefficients of electron and ion thermal conductivity along the magnetic field; Q * STE is the thermal electron heating rate in Coulomb collisions with superthermal electrons; v *, , v * are frequencies of Coulomb collisions between electrons and ions of different types; L * en is the electron cooling rate in inelastic collisions with n -type neutrals. As cooling processes we consider the excitation of rotational and vibrational levels of O 2 and N 2 molecules, as well as the excitation of fine-structure transitions of the level 3 P and electronic level 1 D of oxygen atoms. Temperature dependences of L * en are taken according to [Schunk, Nagy, 2009]. Expressions for collision frequencies and heat conductivity coefficient are taken from [Krinberg, Tashchilin, 1984].
The heating rate of thermal electrons, which is included in heat balance equation (5), is determined by [Krinberg, Tashchilin, 1984]
Q * CT3 ( h ) = 4 пк n * ( h ) x
Г dE
Ф о ( E m , h ) + J Ф о ( E , h )--
where к = 2.6 -10 12cm2eV2; EM is the energy at which the general function of distribution of heat and superthermal electrons begins to significantly deviate from the Maxwell one.
Intensity of the red line emission
Emission at 630 nm (red line) occurs during the oxygen atom transition from 1 D to the ground state 3 P . The volume emission (photon∙cm–3s–1) of the red line can be calculated from the following relation:
П бзо = ^ бзо [0( 1 D )] = А 6зо 2 [O( 1 D ) k ], k = 1
where A 630 =0.00563 s–1 is the Einstein coefficient (the probability of O(1 D ) spontaneous emission); [O(1 D )] is the density of excited oxygen atoms in 1 D at a height h , determined from the condition of balance between rates of excitation and deexcitation of the metastable level 1 D . For nighttime mid-latitude conditions we can assume that oxygen atoms in 1 D are formed due to three processes:
-
• collisions with thermal electrons [Mantas, 1994]:
[O( D )k, = 0.596^3291 2 ^ x exp I- 22756 I [O n .;
’k = (51813 + T , )3 ' 4 T , J L 630
-
• dissociative recombination of molecular ions O 2+ :
[O( * D )] k = 2 = f ( D ) a d O n ; L 630
-
• collisions of oxygen atoms with superthermal electrons:
[O(l D )] k = 3 = 4 n [O' J I O D ) ( E ) Ф о ( E ) dE .
L
630 E
1 D
Here, f (1 D )=1,2 is the efficiency of formation of excited atoms O(1 D ) in the O2+ dissociative recombination reaction (quantum yield) (its coefficient α d is given in the table (line 13)); I O (1 D ) is the differential cross-section of 1 D excitation by electron impact; E 1 D = 1.96 eV is the excitation energy of 1 D ; L 630 is the probability of 1 D deactivation due to spontaneous emission and quenching in collisions with N2, O2, O and electrons, which is determined as [Mantas, 1994]:
r 1 I 1 1
L 6 30 = A' D + 10 - 11 ( 0.16 T,0"1 n , + 0.8[O] + 2.9exp I 68 I [O2] + 2.0exp l -^8 | [ N 2 ] I , s - 1,
n
n
where A 1 D = 0.00745 s–1.
The intensity of the integral nightglow in the red line (in Rayleigh) is determined by
1 630 = 10 - 6 A 630 J [O(1 D )] dh = 1 6h0 + 1 6 d 3 s 0 s + 1 6 e 30 , h 0
Reactions considered in the model ( T ,T i ,T n in K)
|
Reactions |
Reaction rate coefficients cm3s–1 |
Source |
|
|
1 |
O ++ O2 ^ O 1 + O |
0.52
0.92 9.0 - 10 — 12 1 Ti^- I , T > 900K ( 900 J ' |
[Hierl et al., 1997] |
|
2 |
O + + N2 ^ NO + + N |
0.45 1.2 -Ю- 12 I 300 I , T < 1000K 1 T J 1 T 2.12 7.0 - 10 — 13 1 -T— I , t > 1000 к ( 1000 J ‘ |
[Hierl et al . , 1997] |
Intensity of the green line emission
Emission at 557.7 nm (green line) occurs during the oxygen atom transition from the state 1 S to the metastable state 1 D . The volume emission (photon∙cm –3 s–1) of the green line can be calculated as follows
4 557, = ^ 557 [O( 1 S )] = A 557 £ [O( 1 S ) t ], k = 1
where A 557 =1.18 s–1 is the Einstein coefficient (the probability of spontaneous emission of O(1 S ); [O(1 S )] is the density of excited oxygen atoms in the 1S state. For nighttime mid-latitude conditions we assume that oxygen atoms (O(1S)) are formed due to the following processes:
-
• triple collisions triple collisions of the ground-state O(3P) atoms [de Meneses et al., 2008]:
[O(1 S )] = 4.7 -10" ( 300/ T . ) 2 [O]3 < [O2] + [N2] ) ;
k " ' ( A1 S + 4.0 - 10 - 12 exp( - 865 / T . )[O 2 ]) ( 15[O 2 ] + 211[N 2 ] ) ’
-
• dissociative recombination of molecular ions O2 + :
[O( 1 S )] k = 2 = f ( 1 S ) a d O ' | n ;
L 557.7
-
• collisions of oxygen atoms with superthermal electrons:
[O( 1 S )] k = 3 = 4 n -[°]- J i O S ) ( E ) Ф о ( E ) dE . (15)
L 557.7 E
1 S
Here, f (1 S )=0.02 is the quantum yield of excited atoms O(1 S ) in the O 2 + dissociative recombination reaction; I O (1 S ) is the differential cross-section of 1 S excitation by electron impact; E 1 S =4.17 eV is the excitation energy of 1 S ; L 557.7 is the probability of 1 S deexcitation due to spontaneous emission and quenching in collisions with O 2 , O [de Meneses et al . , 2008]
L 557.7 = A 1 S + 10
I f ) 1
-
12 X 0.02[O] + 4.9exp - 885 [O2] , 5 - 1,
I 4 T . ) )
where A 1 S =1.35 s–1
The intensity of the integral nightglow in the green line (in Rayleigh) is determined from
h *
I 557.7 = 10 A 557.7 J [O( S )] dh = I 557.7 + I 557.7 + I 557.7 , h 0
where I 535O7.7, I 5d5is7s.7, I 5e5l7.7 are integral intensities caused by triple collisions, dissociative recombination of
-
O 2 + and STE respectively.
STE energy spectra
It follows from expressions (4), (7), (11), (15) that to calculate the rate of corpuscular ionization and heating, as well as densities of oxygen atoms in the metastable 1 D and 1 S states, we need to know the isotropic part of the superthermal electron flux.
Фо(E, h) = 2/ф(E, ц, h)dц, where ц = cos 9, 9 is the electron pitch angle. Ф0(E, h) can be calculated using an approximate method [Krinberg, 1978] which represents the pitch angular dependence of STE fluxФ(E, ц, h) as a series of Legendre polynomials. If we limit ourselves to two terms of the series (the diffusion approximation) and take
Ф ( E , ц , h ) = Ф о ( E , h ) + цФ 1 ( E , h ), (16)
then the accuracy of the calculation in the precipitation region Ф 0 ( E , h ) appears to be sufficient to determine the above integral characteristics describing effects of precipitating STE. Since during inelastic collisions caused by impact ionization and excitation of neutral atoms and molecules the incident superthermal electron deviates little from its travel direction (forward scattering), and the secondary electron is emitted mainly in a perpendicular direction, in order to calculate coefficients in expansion (16) we can obtain the following system of equations [Krinberg, 1978]:
-
1 дФ, d1
--1 = — (M Фо) - A Фо+ — (Qs + Go), (17) 3 d5 dE 0 0 4n
-
= A (M ф ) - B Ф + — G ,(18)
-
d5 dE4
where M ( E , h ) = s e n e ; A £ o ( ) N n ; B = о e n e + + £ ( o ( + o n ) Nn ; o n , o n are cross-sections of nn
STE scattered by n- type neutral particles in elastic and inelastic collisions respectively; s e = Eо e ; о e = к / E 2; к = 2.6 ■ 10 - 12 см2эВ2. The values of Qs and G k on the right side of (17) describe respectively the secondary electron production rate and the electron production rate in the energy range from E to E + dE due to precipitating superthermal electron energy losses in inelastic processes of impact ionization and excitation of neutral particles. They have the following form [Krinberg, 1978]:
от
Q s ( E ) = 4 n ^ N n £ J Г+, ( E ‘ , E ) Ф 0 ( E ‘ ) dE ‘ , (19)
n Y En y+2 E
G k ( E ) = 4 n £ N „
n
E
£ J I n +Y ( e , E ‘ ) Ф k ( £ ) dE ‘ + £ о n a ( E + E n a ) Ф k ( E + E n a )
Y 0 a where s = E + EnY + E‘; In+Y (E‘, E) is the partial cross-section of ionization of n-type neutral particles by an incident electron with energy E' with resulting production of a secondary electron with energy E and n-type ion in the energy state Enγ; σ nα(E) is the partial cross-section of n-type neutral particle excitation from the ground state to the Enα state by an incident electron with energy E.
Energy dependences of scattering cross-sections for elastic collisions c^ ( E ) were taken from [Rees, 1989]. Differential and total cross-sections of ionization, excitation, and inelastic scattering of electrons in collisions with neutrals I ^ ( E ‘ , E ), c n a ( E ), c® ( E ) are calculated using the analytical expressions presented in [Banks et al., 1974].
The system of equations (2), (3), (5), (6), (17), and (18) is solved numerically with the methods described in [Krinberg, Tashchilin, 1984]. Boundary conditions are specified as follows.
At the lower boundary (h0=90 km), ion densities are defined in the local equilibrium approximation as the solution of algebraic equations n^A Qi+ Qh.
Electron and ion temperatures are found from the heat equilibrium condition T e =T i ,=T n , and the superthermal electron flux is assumed to be isotropic, i.e. Ф 1 ( E , h 0 ) = 0.
At the upper boundary ( h * =700 km), we preset an oxygen ion flux incoming from the plasmasphere such that P *=108 cm–2 s-1. Fluxes of other ions are set equal to zero. Electron and ion heat balance equations are solved under the condition of absence of heat fluxes at the upper boundary. STE transport equations (17), (18) are solved in the energy range from 1 eV to E max =104 eV with the energy boundary condition Φ 0 ( E max , h )=Φ 1 ( E max , h )=0. At the upper boundary h *, we prescribe the isotropic spectrum of precipitating electrons of the form of (1).
MODEL RESULTS
The response of the nighttime mid-latitude ionosphere to energetic electron precipitation events is modeled for the geographic point with coordinates 52 ° N and 105 ° E under moderately disturbed geomagnetic conditions ( K p =4, A p =30) and moderate solar activity ( F 10.7=110) in the equinoctial season. To describe spatio-temporal variations of temperature and densities of neutral components O, O 2 , N 2 , N, and NO, we employ the global empirical model of the thermosphere NRLMSISE-00[Picone et al., 2002] Parameters of the ionosphere and oxygen emissions are computed for the following characteristics of beams of incoming superthermal electrons:
-
• the integrated energy flux P e = 0.И.5 with a step of 0.1 (erg^cm 2^s ' );
-
• the average beam energy E aver=0.1, 0.5, 1.0, 2.0, 4.0 (keV).
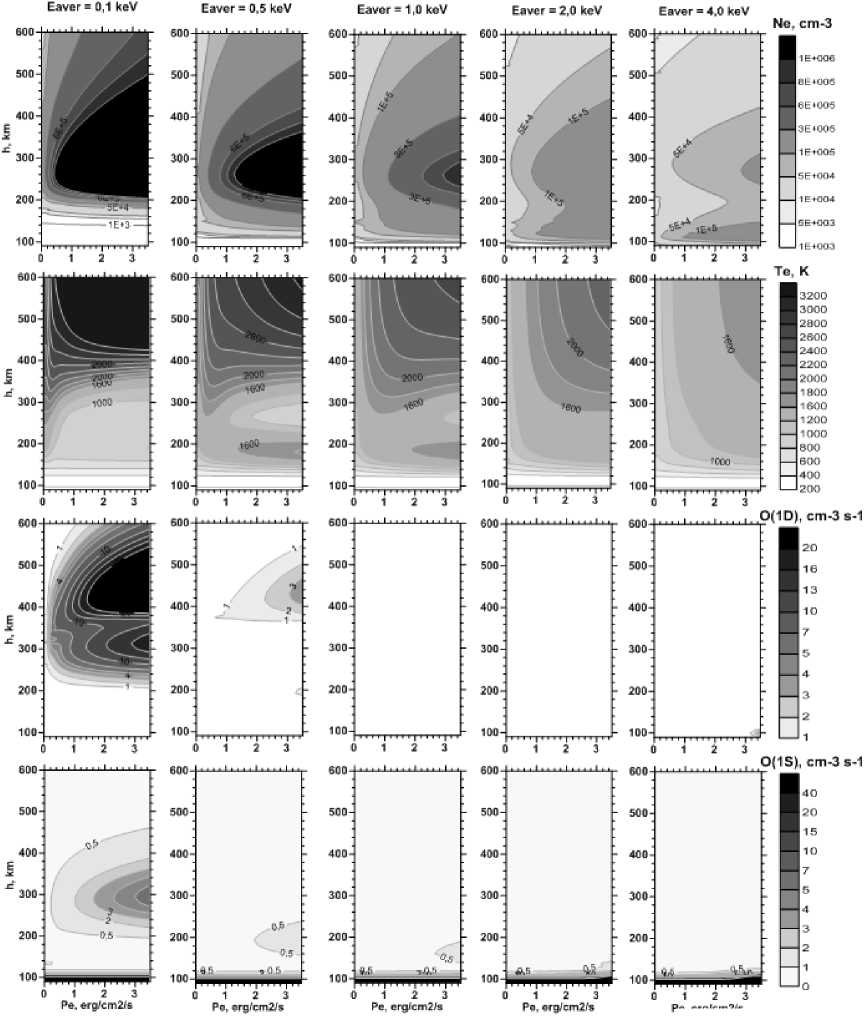
Figure 3 shows estimated distributions of the electron density n e , electron temperature T e , volume emissions in the red O(1 D ) and green O(1 S ) lines in coordinates h – P e with different average energies of precipitating electrons.
Let us consider the properties of the ionosphere and oxygen emissions obtained from the modeling, which are formed under the action of only two factors – the inflow of thermal ions from the overlying plasmasphere and superthermal electron precipitation.
Figure 3 indicates that the dependence of the ionosphere structure and airglows on the energy of precipitating electrons at E aver ≤1 keV (“soft” precipitation) greatly differs from the similar dependence at E aver ≥1 keV (“hard” precipitation). In the first case, n e ( h ) profiles have one peak with quite high values ne max~106 cm–3, which are proportional to Pe and localized above 200 km, i.e. substantially below the height of the nighttime maximum of the normal F2 layer. This is explained by the fact that low-energy precipitating electrons begin to lose their energy at fairly great heights ( h ≥300 km) due to large cross-sections of their interaction with thermal electrons and neutrals.
Рл. erg/cmirs
Figure 3. Estimated distributions of electron density n e , electron temperature T e , volume emission in the red O( 1 D ) and green O( 1 S ) lines at different average energies of precipitating electrons
Below ~200 km there are virtually no effects from precipitation of “soft” electrons. Above and below the height of the maximum, the electron density drops sharply to n e ≤105 cm–3.
The electron temperature during very “soft” precipitation events ( E aver=0.1 keV) increases abruptly to Te ≥3000 K at h ≥300 km, where precipitating electrons lose their energy most effectively. As the mean beam energy rises, STE penetrate into lower heights with a high content of neutral atoms and molecules, which in turn leads to the rapid formation of secondary electrons. This produces an additional heating source in the lower ionosphere ( h ≤200 km), which causes T e to increase at these heights.
For “hard” precipitation events ( E aver ≥1 keV), the STE penetration depth into the atmosphere increases. In this case, the area of effective energy losses is shifted down to h ≤150 km, thus providing secondary electrons with the predominant role in the interaction of STE with thermal electrons and neutrals. As a result, vertical ne ( h ) profiles acquire two maxima – the upper one near 250 km and the lower one between 120–140 km. The vertical electron temperature gradient above 150 km decreases as both E aver and P e increase. In general, the level of electron density and temperature in the ionosphere produced by “hard” precipitation is approximately two times smaller than that produced by “soft” precipitation.
Two bottom rows of panels in Figure 3 illustrate variations in vertical profiles of volume emission in the atomic oxygen red and green lines, which are associated with variations in the integrated flux of precipitating electrons and their average energy. The figure shows that the “hard” precipitation ( E aver≥1 keV) does not generate atomic oxygen airglow. In the presence of “soft” precipitation, the vertical profile of volume emission in the red line exhibits two maxima.
630 TOTL
630 (Te)
630 (O2)
630 (prec)
Energy= 10.0 keV
Pe(erg/cm2/s) Pe(erg/cm2/s)
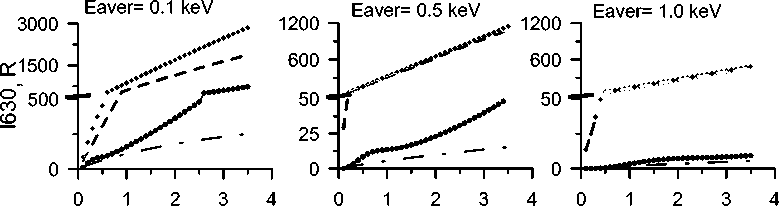
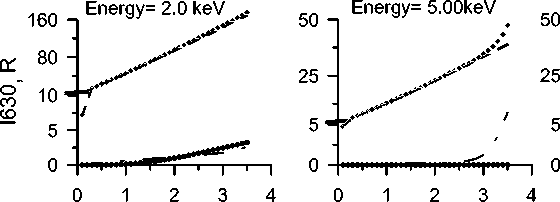
Figure 4. Estimated integrated emission intensity of the atomic oxygen red line O( 1 D ) as a function of beam energy at different average energies of precipitating electrons
•we^eeee^ewe^eew^wee^Kle^eeee^
01234 Pe(erg/cm2/s)
The upper maximum with the most intense emission is located above 400 km and is due to two factors – the 1 D excitation by heated thermal electrons and the impact ionization by precipitating electrons, whereas the lower maximum arises from dissociative recombination of O 2 + ions. The vertical profile of volume emission in the green line also has two maxima for “soft” precipitation. The lower maximum existing regardless of the presence of precipitation events is caused by triple collisions; and the upper one arises from the О2+ dissociative recombination. With increasing average beam energy (“hard” precipitation) the upper maximum disappears.
Figure 4 shows the estimated integrated intensity of the atomic oxygen red line as a function of the integral beam energy P e and with different average energies of precipitating electrons E aver . The calculations are made taking into account the following three processes of excitation of the atomic oxygen level 1 D :
-
• collision with thermal electrons, formula (9); in Figure 4, to it corresponds the 630 nm line ( T e );
-
• dissociative recombination of molecular ions O2+, formula (10); in Figure 4, to it corresponds the 630 nm line (O2);
-
• collision of oxygen atoms with superthermal electrons, formula (11); in Figure 4, to it corresponds the 630 nm line (prec).
Figure 4 shows that the main contribution to the integrated intensity of the atomic oxygen red line emission is made by the reaction of dissociative recombination of the molecular ions O 2 +. It may also be noted that for the events displayed in Figure 2, the increase in the red line emission intensity to ≥200 R can be caused by the influence of precipitating electron fluxes with average energies E aver≤1 keV.
Thus, precipitation events generate airglow in red and green lines not through the direct excitation of the metastable 1D and 1S levels by electron impact, but indirectly, through an increase in rates of ion production and thermal electron heating which, in turn, cause an increase in the rate of dissociative recombination and excitation of 1 D in collisions with thermal electrons.
This work was supported by the Russian Foundation for Basic Research, grant No. 16-05-00563.
Список литературы Моделирование ночных свечений красной и зеленой линий атомарного кислорода для умеренно возмущенных геомагнитных условий на средних широтах
- Кринберг И.А. Кинетика электронов в ионосфере и плазмосфере Земли. М.: Наука, 1978. 215 с.
- Кринберг И.А., Тащилин А.В. Ионосфера и плазмосфера. М.: Наука, 1984. 188 с.
- Леонович Л.А., Михалев А.В., Леонович В.А. Проявление геомагнитных возмущений в свечении среднеширотной верх-ней атмосферы//Солнечно-земная физика. 2012. Т. 20. С. 109-115.
- Banks P.M., Chappell C.R., Nagy A.F. A New model for the interaction of auroral electrons with the atmosphere: Spectral degradation, backscatter, optical emission, and ionization//J. Geophys. Res. 1974. V. 79, iss. 10. P. 1459-1470.
- de Meneses F.C., Muralikrishna P., Clemesha B.R. Height profiles of OI 630 nm and OI 557.7 nm airglow intensities measured via rocket-borne photometers and estimated using electron density data: comparison//Geofisica Internacional. 2008. V. 47, N 3. P. 161-166.
- Goertz C.K. Kinetic Alfv'en waves on auroral field lines//Planet. Space Sci. 1984. V. 32. P. 1387-1392.
- Fox J.L., Sung K.Y. Solar activity variations of the Venus thermosphere/ionosphere//J. Geophys. Res.: Space Phys. 2001. V. 106, iss. A10. P. 21305-21335.
- Hasegawa A. Particle acceleration by MHD surface wave and formation of aurorae//J. Geophys. Res. 1976. V. 81, iss. 28. Р. 5083-5090.
- Hierl P.M., Dotan I., Seeley J.V., et al. Rate constants for the reactions of O+ with N2 and O2 as a function of temperature (300-1800 K)//J. Chem. Phys. 1997. V. 106, N 9. P. 3540-3544.
- Leonovich A.S., Mazur V.A. Resonance excitation of standing Alfven waves in an axisymmetric magnetosphere (monochromatic oscillations)//Planet. Space Sci. 1989. V. 37. P. 1095-1108.
- Leonovich L.A., Tashchilin A.V., Leonovich V.A. Response of 557.7 and 630 nm atomic oxygen emissions to sharp variations in solar wind parameters//Atmos. Ocean. Optics. 2015. V. 28, N 4. P. 376-380.
- Mantas G.P. Large 6300-Å airglow intensity enhancements observed in Ionosphere Heating Experiments are excited by thermal electrons//J. Geophys. Res.: Space Phys. 1994. V. 99, iss. A5. P. 8993-9002.
- Picone J.M., Hedin A.E., Drob D.P., Aikin A.C. NRLMSISE-00 empirical model of the atmosphere: Statistical comparisons and scientific issues//J. Geophys. Res. 2002. V. 107, iss. A12. P. SIA 15-1-SIA 15-16.
- Rees M.H. Physics and Chemistry of the Upper Atmosphere. Cambridge University Press., 1989. 289 p.
- Richards P.G. Reexamination of ionospheric photoche-mistry//J. Geophys. Res. 2011. V. 116, iss. A8. A08307.
- Schunk R., Nagy A. Ionospheres. Cambridge University Press, 2009. 628 p.
