Моделирование влияния магнитосферных потоков тепла на температуру электронов в субавроральной ионосфере

Автор: Гололобов А.Ю., Голиков И.А., Варламов И.И.
Журнал: Солнечно-земная физика @solnechno-zemnaya-fizika
Статья в выпуске: 2 т.3, 2017 года.
Бесплатный доступ
Представлены результаты моделирования распределения температуры электронов в области F субавроральной ионосферы для разных гелиогеомагнитных условий с учетом магнитосферных потоков тепла. Показано, что для спокойных геомагнитных условий в зимний период в утреннем и вечернем секторах формируются «горячие» зоны повышенной температуры электронов, а для возмущенных - кольцеобразная «горячая» область в интервале 04-06 часов мирового времени в результате притока тепла из магнитосферы вдоль силовых линий геомагнитного поля. Анализ данных, полученных с помощью спутника DE-2, показывает возможность формирования такой зоны в период геомагнитных возмущений.
Субавроральная ионосфера, электронная температура, поток тепла, трехмерная модель, кольцевой ток, область f2, зоны повышенной температуры электронов, долготные особенности
Короткий адрес: https://sciup.org/142103644
IDR: 142103644 | УДК: 550.34.01:551.510.535 | DOI: 10.12737/22595
Modeling the influence of magnetospheric heat fluxes on the electron temperature in the subauroral ionosphere
We present results of modeling of the electron temperature distribution in the F region of the subauroral ionosphere for different helio-geomagnetic conditions with consideration for magnetospheric heat fluxes. It is shown that under quiet geomagnetic conditions during a winter period in the dawn and dusk sectors “hot” zones with a higher electron temperature are formed, and under disturbed geomagnetic conditions an annular “hot” region is formed in a time interval 04-06 UT as a result of heat inflow from Earth’s magnetosphere along magnetic field lines. The analysis of the DE-2 satellite data demonstrates that such zones can be formed during geomagnetic disturbances.
Текст научной статьи Моделирование влияния магнитосферных потоков тепла на температуру электронов в субавроральной ионосфере
In [Koffman, 1984], the effects of electron temperature elevation in the subauroral ionosphere, i.e. “hot spots” ( T e≥5000 K), were revealed by experimental data. Numerical simulation of the thermal regime of the high-latitude ionosphere based on Lagrange approach has been discussed in a number of works [Schunk et al., 1986; Klimenko et al., 1991; Mingalev et al., 2002], which analyzed, in particular, the reasons for the formation of hot spots.
In this work, the effect of magnetospheric heat fluxes is studied based on the Euler approach with consideration for the displacement of poles in the electron temperature distribution in the F2 region of the high-latitude ionosphere during a winter period. We use a three-dimensional model of the high-latitude ionosphere (HLI) in Euler variables in terms of its thermal regime [Golikov et al., 2012; Gololobov et al., 2014]. The displacement of geomagnetic and geographic poles, which causes the longitudinal effect in electron density distribution, is taken into account [Kolesnic et al., 1983]. Here, we present the results of space-time distribution of the electron temperature in the F2 region for 05 and 17 UT when the Eastern and Western hemispheres were on the illuminated side. Calculations have been made for winter solstice conditions, solar minimum ( F 10.7 =70), and moderate geomagnetic activity ( K p =3).
RESULTS
Figure 1 illustrates the electron temperature Te distribution at a height of 300 km at 05 and 17 UT for different heat flux values (P) in geographic coordinates. The electron (ion) densities are shown as isolines. Concentric circles with a 10° step correspond to geographic latitudes. The numbers near the outer circle are local time, and the numbers in brackets are geographic longitudes. The dashed upper line is the location of terminator at a zenith angle χ = 90°. The point with two perpendicular lines is the geomagnetic pole. The arrows indicate the electron velocities caused by the electric field of magnetospheric origin. The dash-and-dot circle is a plasmаpause position which corresponds to the equatorial boundary of the magnetospheric convection region according to the “A” Heppner model [Heppner, 1977]. At 05 UT, the geomagnetic pole is near the midnight meridian, and at 17 UT it is near the midday one. It is seen that at 300 km the terminator and the photoioniza tion boundary are shifted to high latitudes by ~10° (Figure 1, a, b). At 05 UT (Figure 1, a), the plasmаpause is outside the illuminated zone. The elevation of Te up to 2000 K is observed in the auroral oval region. At 17 UT, since the convection area appears to be almost half on the illuminated side, the picture of electron temperature distribution becomes complicated. Thus, at 17 UT in the area of anti-solar convection between two terminator positions in the dawn and dusk sectors (Figure 1, b), the elevated Te regions are formed. The mechanisms of manifestation of these effects are considered in [Gololobov et al., 2014]. When setting the downward heat flow P = –5∙109 eV∙cm–2∙c–1 being formed during the period of geomagnetic disturbances due to the ring current at 58–62° geomagnetic latitudes (Figure 2, c, d) at 05 UT when the convection area is located completely on the night side, an annular zone of elevated Te is formed in the subauroral ionosphere (Figure 2, c).
At 17 UT, the elevation of T e has a form of sickleshaped zone coinciding with the location of the main ionospheric trough (Figure 2, d ). T e reaches 4000 K and higher in these zones and 6000 K (Figure 2, e , f ) with increasing flux up to P = –1010 eV∙cm–2∙c–1.
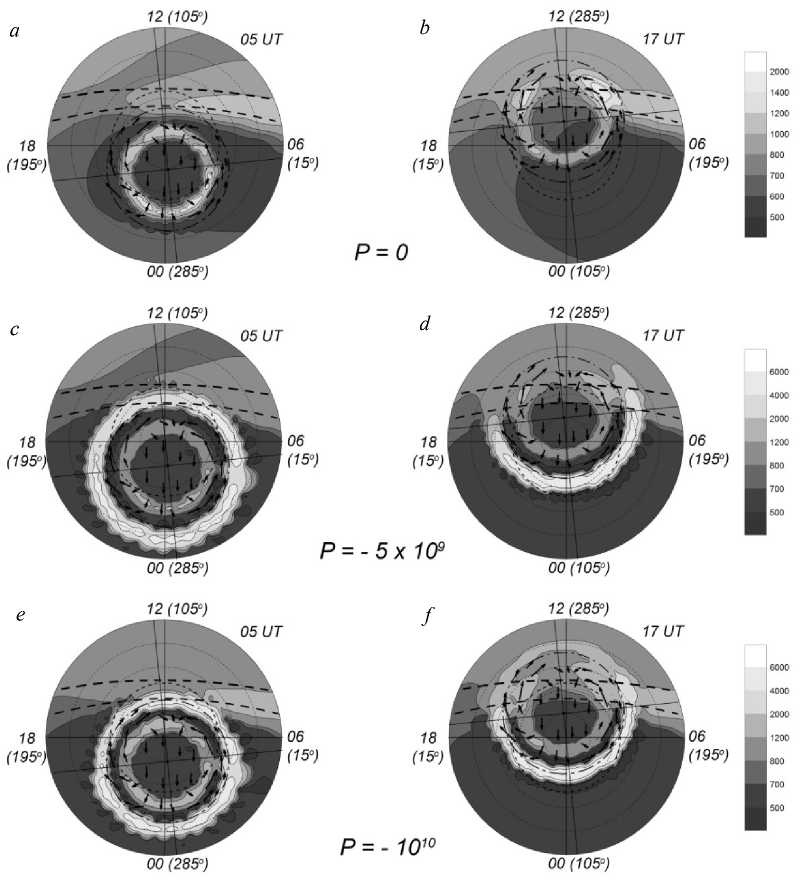
Figure. 1. Electron temperature distribution at a height of 300 km at 05 and 07 UT for different values of heat flux P (eV∙cm–2∙c–1)
Figure 2 shows the DE-2 satellite measurement data for December and January 1982 at different levels of geomagnetic activity. The trajectory of satellite passage is marked with the thick line. The arrow on the trajectory is the satellite direction from the dawn sector to the dusk one. The arrows indicate the T e elevation observed in the subauroral ionosphere. As illustrated, the satellite passes above the pole and crosses the subauroral ionosphere in the dawn and dusk sectors. The T e elevations at K p= 0÷1 are weakly pronounced at latitudes of about 74° and 43°, and reach approximately 1280 K and 1800 K respectively. At higher geomagnetic storminess, the T e increases in the ionization depletion regions of the sub-auroral ionosphere, temperature peaks are well marked and reach 1300 and 2050 K at K p =2÷3 (Figure 2, b ); 1800 and 2800 K at K p ≥ 4 respectively (Figure 2, c ). Detection of two T e peaks in the dawn and dusk sectors in the regions where the satellite crosses the subauroral ionosphere (the regions coincide in position with the main ionospheric trough) testifies that an annular ”hot” zone can be formed during geomagnetic storms.
CONCLUSION
We have studied the influence of the magnetospheric heat flux on the space-time distribution of the electron temperature in the F2 region of the high-latitude ionosphere, using a numerical simulation method with a three-dimensional model of the ionosphere developed on the basis of the Euler approach. It is shown that at minimum solar activity during the winter solstice the displacement of poles causes regular longitudinal features in the T e distribution during the diurnal rotation of Earth. At 05 UT, when the Eastern Hemisphere is illuminated the elevated T e zone is formed only in the dawn sector, and at 17 UT, when the Western Hemisphere is illuminated it occurs in both the sectors. At 05 UT, during the heat inflow from the plasmasphere, the for mation of an annular “hot” zone can be expected. The analysis of the DE-2 satellite data shows that such zones can be formed during geomagnetic disturbances.
The work is supported by RFBR grants N 15-45-05090-p-vostok_a and 15-45-05066-p_vostok_a.
Modeling the influence of magnetospheric heat fluxes on the electron temperature in the subauroral ionosphere
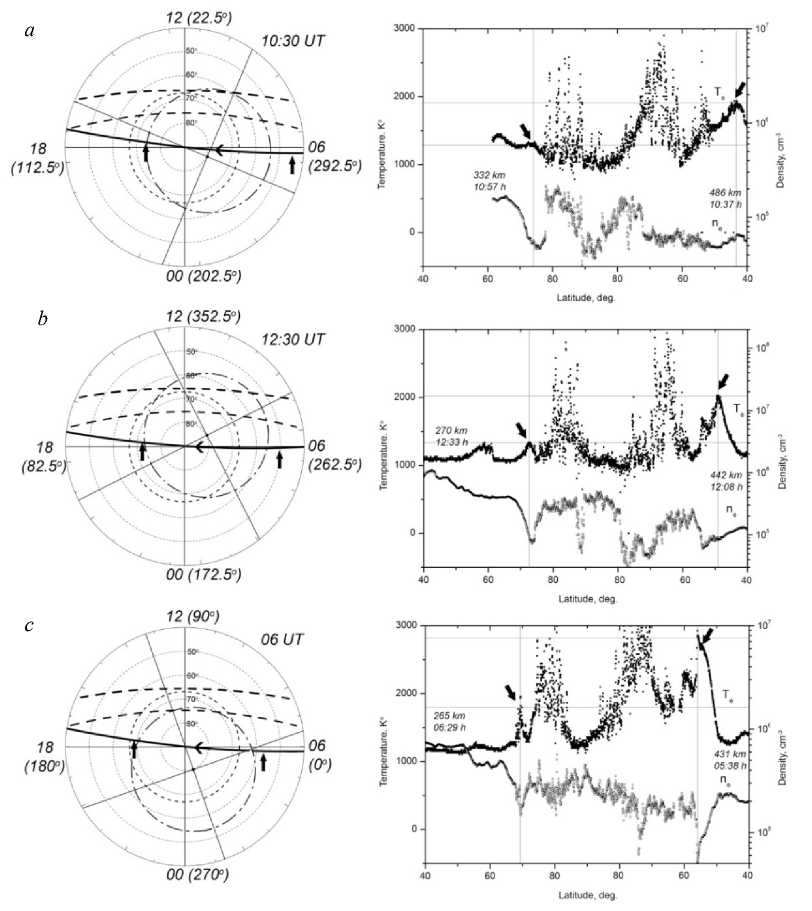
Figure. 2. Trajectory of the DE-2 satellite (left) and measured electron temperature and density profiles (right) during different levels of geomagnetic activity K p =0÷1 ( a ), K p =2÷3 ( b ), and K p ≥4 ( c )
Список литературы Моделирование влияния магнитосферных потоков тепла на температуру электронов в субавроральной ионосфере
- Golikov I.A., Gololobov A. Ju., Popov V.I. Numerical modelling of heat regime of high-latitudinal ionosphere. Bull. of North-Eastern University. 2012, vol. 9, no. 3, pp. 22-28.
- Gololobov A.Yu., Golikov I.A., Popov V.I. Modelling of high-latitudinal ionosphere with the account of displacement of geographycal and geomagnetic poles. Bull. of North-Eastern University. 2014, vol. 11, no. 2, pp. 46-54. (In Russian).
- Heppner J.P. Empirical model of high electric field. J. Geophys. Res. 1977, vol. 82, no. 7, pp. 1115-1125.
- Klimenko V.V., Koren'kov Ju.N., Namgaladze A.A., Karpov I.V., Surotkin V.A., Naumova N.M. Numerical modelling of "hot spots" in the Earth’s ionosphere Geomagnetism and Aeronomy. 1991, vol. 31, no. 3, pp. 554-557..
- Kolesnik A.G., Golikov I.A. Mechanism of a formation of main ionospheric trough in the region F Geomagnetism and Aeronomy. 1983, vol. 23, no. 6, pp. 909-914..
- Koffman W., Wickwar V.B. Very high electron temperature in the daytime F region at Sondrestrom. Geophys. Res. Lett. 1984, vol. 1, no. 9, pp. 912-922 DOI: 10.1029/GL011i009p00919
- Mingalev G.I., Mingaleva V.S. Simulation of the spatial structure of the high-latitude F-region for different conditions of solar illumination of the ionosphere. Proc XXV Annual Seminar "Physics of Auroral Phenomena", Apatity. 2002, pp. 107-110.
- Schunk R.W., Sojka J.J., Bowline M.D. Theoretical study of the electron temperature in the high-latitude ionosphere for solar maximum and winter conditions. J. Geophys. Res. 1986, vol. 91, no. A11, pp. 12041-12054.
