Modelling and Simulation of Hydro Power Plant using MATLAB & WatPro 3.0

Автор: Jahnvi Tiwari, Ashish Kumar Singh, Ashish Yadav, Rakesh Kumar Jha
Журнал: International Journal of Intelligent Systems and Applications(IJISA) @ijisa
Статья в выпуске: 8 vol.7, 2015 года.
Бесплатный доступ
Increase in demand of electricity and clean drinking water has produced a chronic need of a promising and reliable technology for the supply of both commodities, which should be entirely based on renewable sources of energy. The authors, in their previous work, had proposed a design of a hybrid power plant which used graphene membrane for power generation using reverse osmosis process. The proposal included removal of arsenic, poorly biodegradable pollutants using TiO2 nanoparticles. Chlorine production using the process of electrolysis. The plant was also electronically implemented and included pump control, fouling detection modules and decision module for the volume of effluents to be discharged. The performance of a power system is essential to be analyzed for control, stabilization and efficient modelling. In the present research paper, simulation model of the hybrid plant is analyzed. The chemical behavior is analyzed with 'Watpro 3.0' industrial software and turbine governance system is studied via MATLAB. This plant is a potential replacement of chemical purification techniques with high overhead and excess cost. It is a better, efficient, safe and reliable system to produce clean and safe drinking water and electricity simultaneously.
Reverse Osmosis, Graphene Membrane, Chlorine, Electrolysis, Pump Control, Fouling Detection, TiO2 Nanoparticles
Короткий адрес: https://sciup.org/15010736
IDR: 15010736
Текст научной статьи Modelling and Simulation of Hydro Power Plant using MATLAB & WatPro 3.0
Published Online July 2015 in MECS DOI: 10.5815/ijisa.2015.08.01
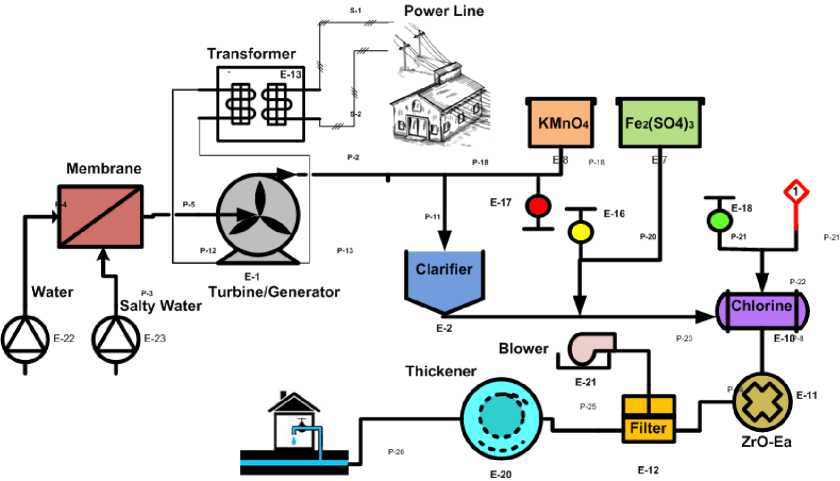
Fig. 1. Hybrid Model
Here, the salty water and fresh water enters the osmosis chamber simultaneously for the process of reverse osmosis. The pressure generated in the chamber is used to rotate the turbine which in turn, generates electricity which is transmitted to the power line. The water from the turbine chamber is then directed to the clarifier, which separated solid from the water and primarily removes some micro-organisms. The clean effluent is treated with Fe 2 (SO 4 ) 3 and KMnO 4 to reduce metal levels, taste and odor causing compounds.
In processing plant, channels are working as a storage which contains large quantities of fluid which is to be treated. This fluid should be treated as quickly as possible to maintain the flow rate for reducing contamination.
Water container collects raw water and its quantity is controlled electrically with advanced chemical governance system and self-excited induction generator. From chemical container the disinfectants are injected in appropriate amount, dosage is calculated and automatically valves opens for a fixed time. As shown in figure 2, the height of water container is ‘h’ with its area ‘A’ and let us assume the pressure at top of container be
, pressure at out valve be , diameter of orifice be and lower limit of minimum water level be ℎ .For simple analysis fluid is taken as incompressible. Applying Bernoulli’s equation we get [1].
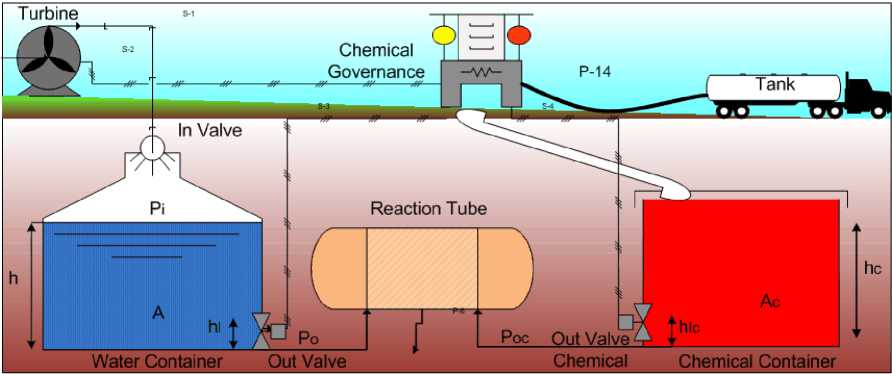
Fig. 2. Model for governance system
|
11 + + ℎ= + + ℎ (1) |
() = ( ) |
|
Where ℎ and is the height and velocity of fluid at top of container respectively whereas ℎ and is the height and velocity of fluid at bottom of container respectively. Velocity of fluid at surface is taken to be negligible. 1 + ℎ( )= + + ℎ (2) - √2×( + ×(ℎ()- ℎ))= (3) With this velocity fluid comes out of container. So, the amount of fluid transferred to reaction tube will be required for chemical addition. |
- ( ) (7) Mass flow out of container ( ) = v0 x Area of оrif ice x p (8) do = × (9) Here, we have assumed inlet mass of fluid to be constant . () = - d,t _____________________________________________ √2×( - + ×(ℎ()- ℎ )) (10) |
|
Fluid Mass = Fluid Volume x Fluid Density (4) ()= × ℎ() (5) () ℎ() = × (6) dt at Rate of change of mass inside container can be expressed as difference of fluid mass entering and mass flow out [1]. |
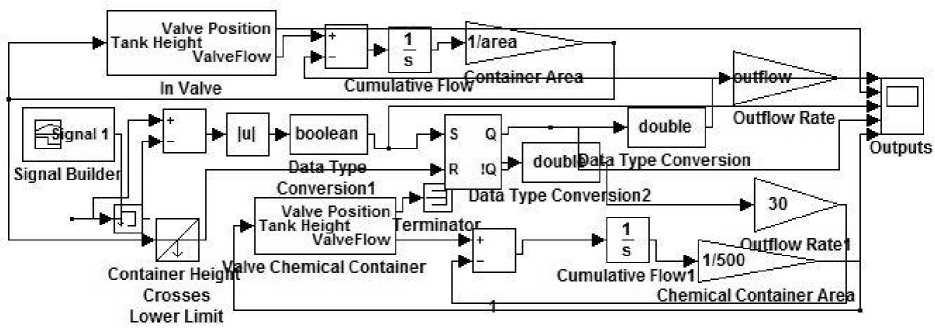
From comparing (6) and (10) we get ℎ() dt pA 1 - √2×( + ×(ℎ()- ℎ )) (11) Similarly, chemical additive is also analyzed and numerical model is constructed using Simulink/MATLAB software GUI system. We have |
designed a GUI system, shown in figure 4, interconnected to Simulink model, as show in figure 3.
>3Utfl0W
Outputs
In Valve
Valve Position Tank Height
ValveFlow
Outflow Rate
> double ignal 1
Signal Buildei
■ |*]-S| Data Type Convei|sion2
> 30
|U| DOOiean -|_
-----Data Typ e—
Conversion 1
Valve Position
-► Tank Height ValveFlow
► Г 1 г——Outflow Rate
1—^—11--- ► 1/500 --
Cumulative Flowl L———~ ___________ Chemical Container Area
R !q ^ doublpa ta Type Conversion
Terminator---
Container HeigY?lve Chemical Container Crosses
Lower Limit
1 j->1 /area\ZZ^==-TumUTatTveHTo^^^
Fig. 3. MATLAB model for chemical control
This plant includes variable fluid container whose dimension is controlled using GUI. Slider are provided to change the area of container, input rate of flow, output flow rate, height of the container and lowest limit unto which system will be force to shut-down. With different parametric value, the rate of diffusion of chemical is different and hence, its level is displayed on the LED screen. Chemical container is also connected with power valve which is controlled using chemical governance system. From simulation point of view parameters are fixed using slider panel, as shown in figure 4.
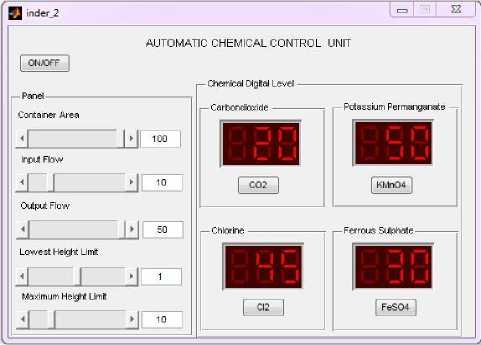
Fig. 4. GUI for chemical additives
-
II. R elated W ork
Many research works have contributed to design quality measuring devices for treatment of water [2].The statkraft decided to set up a promising critical components as membranes and pressure recovery devices which lead to the world’s first prototype plant in spring 2009 in the southeast of Norway [3].The wastewater treatment plants market in India is expected to grow at a CAGR of 15% till 2018, the “Deep Pond System” in Hyderabad treats 37,854 liters of wastewater per day; this system was implemented as a low-cost wastewater treatment unit in 2004 at the Jawaharlal Nehru Technology University campus in Hyderabad, India[4].
-
III. G raphical A nalysis of G enerated R esults
Using MATLAB, graph has been plotted and detailed analysis of these graphs is explained in Table 1.
Table 1. Detail Analysis
|
Time(s) |
Observation and conclusion |
|
0 - 45 |
Inlet valve to fluid container is ON, as a result of which, container height keeps on increasing. Out valve status is OFF and flush pulse is not active. Amount of chemical calculated and injected automatically by GUI decrease the level of chemical. |
|
45 - 49.5 |
Container reaches its maximum value i.e. 10 m and Input valve is automatically closed i.e. transition from ON to OFF. Flush pulse is not active and out valve status remains constant in OFF mode. GUI transfer chemical in appropriate amount hence level decrease. |
|
49.5 - 50 |
Container is at its maximum and flush pulse is deactivated, input valve status changes from OFF to ON as a result of ON out valve. Chemical level still keeps on decreasing i.e. chemical is injected. |
|
50 - 53 |
Container fluid level starts decreasing as out valve is in ON mode while input value is ON but with different flow rate. Flush pulse gets active as chemical additive matches fluid requirement. Chemical level starts increasing. |
|
53 - 72.3 |
Container fluid level keep on decreasing with input valve ON. Out valve status is ON with rise in chemical level. Flush pulse not triggered. |
|
72.3 - 150 |
Container fluid level start increasing and input valve status is ON with output valve switched OFF. Decrease in level of chemical occurs with flush pulse to be deactivated. |
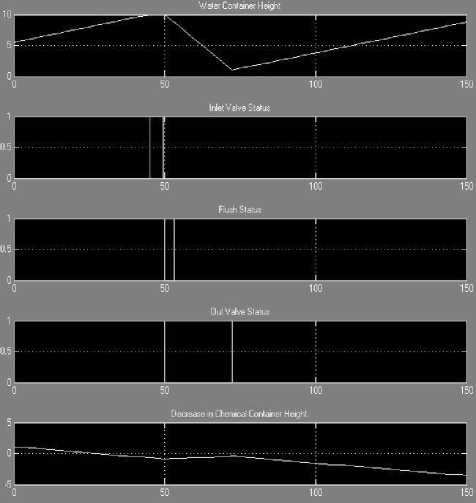
Fig. 5. Graphical Status of Chemical Governance System
-
IV. C hemical A nalysis using W at P ro 3.0
Chemical addition to water is again a very important work to be done with exact concentration value dosage of additives. This can be dreadful if human error occurs which is highly probable. Therefore, an automated system is developed for governance of concentration of chemical additives with appropriate fluid concentration. Governance system is simulated using WatPro [5] and analyzed for better results, so for small prototype we have assumed some parameters and observed the result. Watpro software model of chemical addition is show in figure 6. From figure 6, different block position is expressed: A1 (Raw Water Influent), A3 (Measurement), B3 (Channel), C3 (Flocculator), D1 (Addition Ferrous Sulfate), D3 (Membrane), E3 (Settling Basin), F1 (Addition CO2), F3 (Transfer/Distribution Pipe), G1 (Potassium Permanganate), G3 (Filtration), H3 (Ultraviolet Contactor), H4 (Calcium Hydroxide) I1 (Disinfect Addition Chlorine), J3 (Measurement), K3 (Final Treated Water Effluent). We will discuss independently every single step involved for water purification.
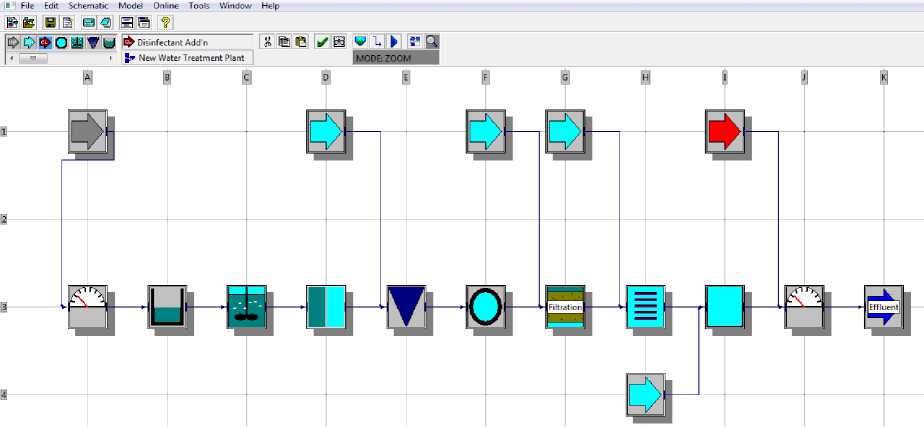
Fig. 6. Chemical Analysis
A1 Raw Water Influent
The outlet of turbine is connected to advance electronic system which is designed to remotely access the chemical and disinfectant additives. Small prototype of this hybrid plant is stimulated using WatPro 3.0 a water treatment simulation software. For simulation propose, raw water influent which is further transferred to small channel for suspension of heavy sediment.
A3 Measurement
Raw water which is to be treated is measured for different properties. We have assumed input flow rate to be 64800 m3/day at a temperature of 10 0C with other parameters stated in table 2. It can be observed that water pH is around 7.5 and hardness 100 mg/L which contributes to the scaling of water boiler.
Table. 2. Initial properties of contaminated water
|
Property |
Value |
Unit |
|
Flow |
64800 |
m3/day |
|
Temperature |
10 |
0C |
|
pH |
7.5 |
|
|
Turbidity |
0.5 |
NTU |
|
UV254 |
0.1 |
1/cm |
|
Total Organic Carbon |
3 |
mg/L |
|
Carbonates (aq) |
218.17 |
mg/L |
|
Calcium |
80 |
mg/L |
|
Magnesium (aq) |
20 |
mg/L |
|
Alkalinity |
100 |
mg/L |
|
Hardness |
100 |
mg/L |
|
Ammonia as N |
5 х 10 " 2 |
mg/L |
|
Bromide |
0.10 |
mg/L |
|
Giardia |
1.00 |
cysts/100L |
Turbidity allowed is maximum 5 NTU. Above 5 NTU, consumer acceptance decreases. The permissible limit of pH is 6.5 to 8.5, beyond this range it affects mucous membrane and water supply systems. Presence of calcium carbonates which is also the measure of hardness can be maximum 300 mg/L. Above this level Encrustation in water supply structure takes place and it also has adverse effects on domestic use. Alkalinity measured in mg/L, can be maximum upto 200. Beyond this limit taste becomes unpleasant.
B3 Channel
Fluid container is used for storing water and to control the rate of flow of fluid toward pipeline. In MATLAB model we have assumed a variable channel whose length and area can be adjusted using GUI.
Table. 3. Water storage tank dimension
|
Property |
Value |
Unit |
|
Length |
10.0 |
M |
|
Depth |
10.0 |
M |
|
Width |
10.0 |
M |
C3 Flocculator
Flocculator chamber is used for separating small particles. In this chamber, a process take place where colloids are separated from suspension in form of flakes. Turbidity of raw water is decreased from 0.5 to 0.2 NTU which
Table. 4. Turbidity details
|
Property |
Value |
Unit |
|
Volume |
200.00 |
m3 |
|
Turbidity |
0.20 |
NTU |
D1 Addition Ferrous Sulfate
Distribution pipe drives water to chamber for treatment with Fe2 (SO4)3 for removal of heavy metals. It is more efficient coagulant which removes chromium (89.58%), Ni (99.73%), Zn (68.42%) and Mn (35.29%) from fluid with 13 mg/L dosage [6].
Table. 5. Chemical amount of Fe 2 (SO 4 ) 3
|
Property |
Value |
Unit |
|
Chemical Dosage |
22.5 |
mg/L |
D3 Membrane
Molecular weight cut-off can be defined as the molecular weight at which 80% of the analytes (or solutes) are prohibited from membrane diffusion. Here, user specifies the water production percentage through membrane and optionally the effluent turbidity [7].
Table. 6. Fluid properties at membrane
|
Property |
Value |
Unit |
|
Molecular weight cut-off |
500.0 |
g/mol |
|
Operating pressure |
300.0 |
kPa |
|
Recovery |
30.00 |
E3 Settling Basin
Settling basin is used for settlement and to reduce the outlet turbidity.
Table. 7. Turbidity details
|
Property |
Value |
Unit |
|
Volume |
200.00 |
m3 |
|
Measured Turbidity |
0.15 |
NTU |
F1 Addition CO2
CO 2 addition in water causes leaching of various elements which could be hazardous to life. It is used to reduce the effect of arsenic, zinc, lead etc. Raw water absorbs CO 2 and due to chemical reaction reduction in pH and carbonate ion concentration is observed.
Table. 8. Carbon dioxide dosage
|
Property |
Value |
Unit |
|
Chemical Dosage |
10.00 |
mg/L |
F3 Transfer/Distribution Pipe
Dimension of pipe is estimated for appropriate addition of chemical additives which reduces the chance of excess chemical concentration.
Table. 9. Dimension of pipeline
|
Property |
Value |
Unit |
|
Length |
100.00 |
m |
|
Diameter |
1.00 |
m |
G1 Potassium Permanganate (KMnO4)
This is used for the removal of taste and odor from flowing water, to oxidize a wide variety of inorganic and organic substances and to completely inactivate bacteria. Water borne diseases are major threat which can be decreased by controlling dosage of KMnO 4 from 0.25 to 20 mg/L [3].
Table. 10. Dosage of KMnO 4
|
Property |
Value |
Unit |
|
Dosage |
4.00 |
mg/L |
G3 Filtration
Filter type used is conventional because it follows coagulation and sedimentation and it can be used for variable turbidity and bacteria level. Fluid flow rate should be maintained, if flow rate is very high sediments will cross the pores.
Table. 11. Filtered output fluid
|
Property |
Value |
Unit |
|
Volume |
300.00 |
m3 |
|
Measured Turbidity |
0.1 |
NTU |
H3 Ultraviolet Contactor
It is the most commonly used for disinfection of water by causing damage to the genetic structure of bacteria, viruses, and other pathogens, making them incapable of multiplication [8]. Non-biodegradable substance is treated in presence of titanium oxide nanoparticle [9].
Table. 12. Properties of fluid after ultra violet treatment
|
Property |
Value |
Unit |
|
Log Inactivation Giardia |
2.00 |
log(10) |
|
Log Inactivation Virus |
4.00 |
log(10) |
|
Log Inactivation Cryptosporidum |
2.00 |
log(10) |
-
I1 Disinfect Addition Chlorine
In contaminated water it is necessary to kill sever harmful microorganisms and for this chlorination of water is necessary. In this plant, chlorine is produced using brackish water for electrolysis and generating free chlorine. It reacts with ammonia if present in raw water and forms chloramines. For simulation purpose, 2 mg/L chlorine dosage is used for chlorination.
Table. 13. Fluid chlorination dosage
|
Property |
Value |
Unit |
|
Chemical Dosage |
2.00 |
mg/L |
For chlorination the main disinfecting agents can be produced from the naturally occurring ions found in the waste salty water (unpressurised water) itself as stated by Chen-Yu Chang Yi-Tze Tsai [10].
J3 Measurement
This indicator flashes output and treats fluid with appropriated chemical addition, stabilization and mineralization. Rate of flow is decreased to maintain the flow in pipeline and for reaction time. Drinking water pH is around 7 which is near to ideal. The high energy associated with short wavelength UV energy, primarily at 254 nm, is absorbed by cellular DNA can damage the DNA of living organisms by creating nucleic acid dimers [11].
Table. 14. Properties of treated fluid
K3 Final Treated Water Effluent
Finally raw water after crossing numerous process gives pure and safe drinking water. One of the major factor is turbidity which is reduced from 0.5 to 0.1 NTU. It is measured by scattering of light, if intensity is low turbidity is less while, high intensity leads to high turbidity.
Table. 15.
|
Disinfection |
Criteria |
Status |
Result |
Unit |
|
Req. Giardia Reduction |
4.00 |
OK |
4.50 |
log(10) |
|
Req. Virus Reduction |
5.00 |
OK |
6.00 |
log(10) |
|
Req. Crypt Reduction |
2.00 |
OK |
4.00 |
log(10) |
|
Max Chlorine Allowed |
4.00 |
OK |
2.00 |
mg/L |
|
Max Turbidity Allowed |
0.50 |
OK |
0.10 |
NTU |
V. C onclusion
The paper here proposes and analyses an efficient, productive hybrid plant for power generation and water purification. The central idea is to combine two separate efficient entities for the purpose.
Stage
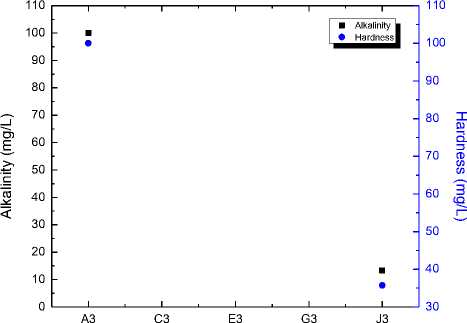
Fig. 6. Alkalinity and Hardness of water at different stages
Electricity production with purification of water with this eco-friendly advance system is a cost effective proposed solution for lack of clean water and electricity. Raw drinking water is finally converted to pure form with proper balancing of hardness and alkalinity. This can be shown in figure 6. Water pH is another important parameter for drinking. Initially raw water is taken whose pH was not safe therefore due to treatment through different stages its pH value is brought down towards neutral. Treatment process on different versus pH is shown in figure 7.
Manganese (as Mn) mg/L can be nearly 0.3-0.4. Beyond this range taste/ appearance are affected which
-
7.5 к ■
-
7.4 к„
-
7.3
-
7.2
7.1
-
7.0 к■
-
6.9 I___________________I___________________I___________________I___________________I___________________I___________________I___________________I___________________1___________________IJ
A3 C3 E3 G3J3
Stage
-
Fig. 7. pH of water at different stages
0.5
0.4
0.3
0.2
0.1
Water turbidity is measure of water clarity. Here different filtration technique is used for the proper separation of suspended particles from water and make it pure enough to drink. This suspended particle are not visible from naked eyes and from below figure 8, it can be seen that finally turbidity is 0.1 NTU.
S I-
A3 C3 E3 G3 J3
Stage
-
Fig. 8. Turbidity of water at different stages
This system is designed to operate in any situation irrespective of fault occurrence like scaling, fouling and clogging. WatPro 3.0 and MATLAB simulated result shows that raw water is treated and finally can be used for safe drinking water. The automated chemical and valve control reduces the risk of human error and over or under dosing of effluents. This also reduces the manpower to be employed for the smooth working of the hybrid hydro power plant.
A cknowledgment
The authors acknowledge the use of Water Treatment Simulation Model Version 3.0 program developed by Hydromantis Environmental Software Solutions, Inc.
Список литературы Modelling and Simulation of Hydro Power Plant using MATLAB & WatPro 3.0
- Germeles, A. E. "Forced plumes and mixing of liquids in tanks." Journal of Fluid Mechanics 71.03 (1975): 601-623.
- Pawan Whig, Syed Naseem Ahmad,"Performance Analysis of Various Readout Circuits for Monitoring Quality of Water Using Analog Integrated Circuits", IJISA, vol.4, no.11, pp.91-98, 2012.
- Skråmestø, Øystein S., Stein Erik Skilhagen, and Werner Kofod Nielsen. "Power production based on osmotic pressure." Waterpower XVI (2009).
- Grail Research, Water - The India Story, 2009.
- http://www.hydromantis.com/WatPro.html.
- Tiwari, Jahnvi, Ashish Kumar Singh, Ashish Yadav, and Rakesh Kumar Jha. "Sustainable power production and purification of water." In Advances in Computing, Communications and Informatics (ICACCI, 2014 International Conference on, pp. 2258-2263. IEEE, 2014.
- Dudley J, Dillon G, et. al. 2008, “Water Treatment Simulators: State-of-Theart Review”
- Note for Guidance on Virus Validation Studies: The Design, Contribution and Interpretation of Studies Validating the Inactivation and Removal of Viruses, EMEA CPMP BWP, 268/95 1996.
- T.A. Egerton, P.A. Christensen, S.A.M. Kosa, B. Onoka, J.C. Harper, J.R. Tinlin “Photoelectrocatalysis by titanium dioxide for water treatment” Int. J. of Environment and Pollution, 2006 Vol.27, No.1/2/3, pp.2 – 19. doi: 10.1504/IJEP.2006.010450.
- Chen-Yu Chang Yi-Tze Tsai, Yung-Hsu Hsieh, Chia- Lin Yang Shu- Hai You, “Using membrane electrolysis method to generate chlorine dioxide”, International Conference on Environment Science and Engineering IPCBEE vol.8, Singapore, 2011.
- Das, Tapas K. (August 2001). "Ultraviolet disinfection application to a wastewater treatment plant". Clean Technologies and Environmental Policy (Springer Berlin/ Heidelberg) 3 (2): 69–80. doi:10.1007/S100980100108.
