Modified Political Optimization Algorithm Adapted Deep Neural Networks for Early Plant Disease Detection

Author: Rina Bora, Deepa Parasar, Shrikant Charhate
Journal: International Journal of Image, Graphics and Signal Processing @ijigsp
Article in issue: 2 vol.16, 2024.
Free access
To prevent the loss of the yield of food crops and to attain sustainable agricultural growth, accurate detection of plant disease at an early stage is crucial. However, the extraction of crucial features from infected plant leaves to differentiate the properties associated with different diseases is a complex task, as the diseases exhibit huge variations, which insists on the need for developing precise disease detection. Hence in this research, the early detection of plant disease is performed by utilizing a Modified political optimization adapted deep Neural Network (MPO-adapted deep NN) model, in which the continuous learning capability of the deep NN classifier helps in the deeper analysis of the information in the image and identifies the plant disease more accurately. Identification of the plant disease posse’s challenges due to complexities present in the image and the neural networks effectively dwells with the complex relationships and the non-linear characteristics of the network help in achieving adaptability and makes the system more suitable for real-time applications. The main contribution relies on the modified political optimization algorithm that efficiently tunes the parameters of the deep NN classifier to analyze the disease patterns effectively and provides disease detection with high accuracy. Further, the Adaptive K-means algorithm is utilized for the effective segmentation of diseased parts, and the Grey level co-occurrence matrix (GLCM) features are extracted in the method that enhances the accuracy of the detection. When compared to the existing techniques, the MPO-adapted deep NN model attains high accuracy, sensitivity, and specificity values of 98.95%, 97.45%, and 98.95% for cotton leaf, 94.47%, 94.58%, 94.54% for cotton root, 99.10%, 99.10%, 99.10% for cotton stem, respectively concerning the k-fold. Analysis demonstrating the superiority of the research's metrics values measurement. When compared to existing methods, detecting the disease in cotton stems is very effective.
Plant diseases, early detection, modified political optimization, neural network, complex relationships
Short address: https://sciup.org/15019446
IDR: 15019446 | DOI: 10.5815/ijigsp.2024.02.08
Text of the scientific article Modified Political Optimization Algorithm Adapted Deep Neural Networks for Early Plant Disease Detection
Agriculture is one of the key industries in the nation and it serves as the foundation of the nation [1]. Various biotic stressors can affect the agricultural yield and result in severe production losses. A vicious circle between food security, nutrition, and agricultural economics exists [2], which harms developing and indigent nations and causes both health and economic issues [3]. Agriculture is having a hard time providing for the growing world population [4]. Small farmers produce the majority of the crops in many developing nations; for instance, only in Africa do small farmers produce 80% of the crops. It is a worrying condition because smallholder farmers have less access to resources, which suggests that the majority of the agricultural output of developing nations is in difficulty [3]. Food security is threatened by several factors, such as climate change, the loss of pollinators, crop diseases, deficiency in irrigation, and so on. Plant diseases negatively impact both food quality and output. It's critical to safeguard plants from illness to preserve the quality and quantity of crops [5]. Plant diseases can destroy crops by drastically lowering the yield. The prompt and correct detection of plant diseases is essential for ensuring food security and the ecosystems [4].Typically, farms are spread out over a broad area, making it challenging for agriculture specialists and government officials to keep track of the plants that are impacted by disease [6]. To accurately diagnose disease groups, nevertheless, specialist knowledge is needed [3]. Reaching rural areas can be challenging, particularly in developing nations where smallholder farmers grow the majority of the crops. It is feasible to receive a diagnostic at the professional level with the use of cutting-edge technologies [3]. Some developing countries deploy IoT-based farming because this can immediately detect disease and stimulate plant growth [7]. Researchers have combined image processing methods with the IoT application to create an IoT-based plant recognition system. The sensors are positioned over diverse areas at varying ranges to make the IoT environment ideal for disease recognition [8-11]. The sink nodes receive the images from the IoT devices, which feature cameras for taking pictures of the plants. By explicitly alerting the farmer before the disease causes substantial damage, using the IoT environment for disease monitoring considerably improves agricultural productivity [6].Deep Learning (DL) techniques for disease recognition and classification assist farmers in identifying the type of illness and assisting them in administering accurate treatments to the plant to control the disease. DL approaches to disease identification of leaves yield superior results to machine learning methods [1]. These methods make use of various classifiers to find hidden patterns in data. Over machine learning techniques, DL techniques have two key advantages. Initially, they extract numerous features from raw data without manual intervention; thus, a separate feature extraction module is not required. Following this, DL approaches shorten the time needed to progress huge, high-dimensional datasets [12]. The lack of a dataset on leaf disease, the presence of noise in the image that was taken, changes in the characteristics of the leaf, low resolution, etc. present other problems for the researchers, though [13,1]. The key intention of the research is to identify the plant disease utilizing MPO adapted deep NN classifier. The leaf image is composed of the database and preprocessed to eliminate irrelevant data. The segmentation of the affected region is performed using adaptive K-means clustering and then the necessary feature based on Grey Level Co-occurrence Matrix is extracted. After the extraction of necessary features, the classification is performed by the MPO-adapted NN using the testing and the training data and the significant contributions of the model are detailed as follows,
> Modified political optimization: The MPO algorithm is formulated by the standard hybridization of the political optimization algorithm (POA) [14] and the Whale optimization algorithm (WOA) [15], where the strategies used for winning as a leader in politics are used. The characteristics are enhanced by analyzing the opponent’s strength utilizing the whale’s spiral update characteristics so that the optimization capability is enhanced.
> MPO-adapted deep NN classifier: The deep NN classifier effectively analyzes the information of the infected plant regions and assists in the detection of the disease. The MPO optimization enabled in the deep NN model tunes the hyperparameters of the deep NN, reduces the computation burden, and provides an effective optimal solution for analyzing the disease pattern and predicting the disease effectively.
2. Motivation2.1 Literature review
2.2 Challenges
Plant disease affects major crop yields and the occurrence of the plant disease can affect the lifestyle of humans. Over 30 % to 50 % of plants are affected by plant diseases, which affect the outcome of the individuals performing farming. Early disease detection helps in improving the outcome of the farmers and helps in improving the economy of the world. To predict plant diseases initially the methods utilized along with their advantages, disadvantages, and challenges are described below.
The previous works related to plant disease detection are: Punam Bedi and Pushkar Gole [12] developed a convolutional autoencoder that detected the spot plant disease in peaches automatically. The model effectively reduced the reconstruction loss and this model required fewer training parameters compared to others but overfitting acts as the main disadvantage. A. Umamageswari et al. [1] initiated a fuzzy C-means optimization algorithm for efficient plant disease identification, which identified the diseases in apples, peppers, grapes, and so on. This model takes less processing time for predicting the leaf disease but this model failed to handle noisy data. Dhruvil Shah et al.[4] developed a Residual architecture that enabled residual connections for detecting plant disease, which reduced the vanishing gradient issues. Batch normalization is done in ResTS which helps in achieving faster convergence. The method was affected by overfitting issues and performed poorly with the validation set. Monalisa Mishra et al.[6] developed an NN for the detection of disease and the weights of the NN were tuned optimally to minimize the convergence time. The loss was also reduced because it quickly identified the disease-affected plants but the cost of the model is reliably high. Bhushan V. Patil and Pravin S. Patil et al. [16] developed a CNN network that detected cotton plant disease and classified the images as healthy and diseased images. The system is more adaptable and suitable to real-time scenarios and this method efficiently handled the illumination variation challenges but took prolonged time. Mobeen Ahmad et al.[3] systematically detected the plant disease symptoms using a CNN that achieves fast convergence while minimizing the overfitting problem but still, the topic of whether it is possible to use the classifier on handheld devices for a workable solution is unresolved. S. Ashwinkumar et al.[17] initiated a Mobile Net based network for the efficient detection of plant disease, which provided high accuracy but required large training data for the detection the plant disease. The method doesn’t reduce the features which further increases the complexity of the network. Rudresh Dwivedi et al.[18] initiated a detection network that helped in the detection of grape leaf diseases and classified the leaves as diseased or healthy. This could take the place of on-site expert identification because it is accurate, simple, and computationally efficient but still real-time detection is complicated. Bora R. et.al [19] developed a Multivariate normal Deep Learning Neural network that systematically detected the diseases in Tomato plant. The model detects the disease from leaf, fruit, root and stem of tomato plant. The model is computationally efficient and achieved good accuracy overall up to 99%.
> The disease detection system requires high computation efficiency and should reduce the training and prediction time. Hence reducing the time for prediction is a main challenge [12].
> The primary drawback of the plant disease detection model is that it frequently becomes trapped in local minima when dealing with complex leaf disease images [1].
> Low contrast, a sizable fluctuation in the magnitude of the lesion area, a sizable amount of noise in the lesion image, and a small difference between the lesion region and the background.
> The lack of a dataset on leaf disease, the presence of noise in the image that was taken, changes in the characteristics of the leaf, low resolution, and so on act as additional problems that the researchers must deal with [1].
> The images of plants have a complicated structure, with many normal regions, and spot regions, along with complex backgrounds. Additionally, the images include properties relating to shape irregularity, color disparity, and so on [6].
3. Methodology of Plant Disease Prediction Model Utilizing MPO-adapted deep NN Classifier3.1 Input
The research aims to detect the plant disease using the MPO-adapted deep NN classifier and this detection helps in minimizing the effects of the plant disease. Initially, the data is composed from the real time data and then the data is preprocessed to eliminate the artifacts and noise from the image. The diseased part of the image is segmented by using the Adaptive K-means algorithm and then the necessary features needed for the disease detection are extracted. In this research, the Grey level co-occurrence matrix (GLCM) features such as entropy, homogeneity, contrast, correlation, and energy are extracted, and the extracted features get concatenated and form the input to the MPO-adapted deep neural network. The network detects the presence of the disease with high accuracy and the significant contribution relies on the optimization applied to the deep NN classifier. The MPO algorithm is used for the tuning of the parameters in effectively tuning the weights and bias parameters that help in the determination of the optimal solution.
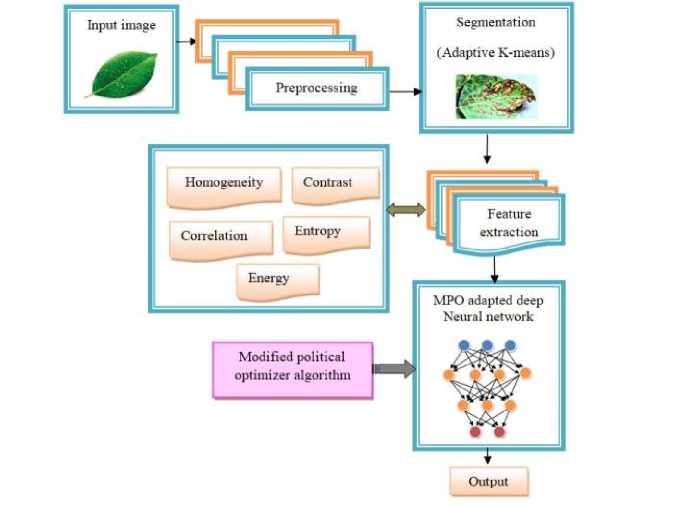
Fig. 1. Established framework for the prediction of plant disease
The input image for disease detection with the dimension of ( 200 x 200 ) is gathered from the real-time data and is represented by the equation,
q
A = 2 A x x = 1
here, A represents the database and the number of images in the database is designated by [ 1, q ] .
-
3.2 Preprocessing
-
3.3 Segmentation
-
3.4 Feature extraction
-
3.4.1 Contrast
This involves the augmentation of the image that eliminates unintentional distortions or highlights certain characteristics of the image that are crucial for subsequent processing and this preprocessing is mathematically represented by,
q
A =2 A x =1
Adaptive K-means clustering is enabled to segment the region affected in the plants by grouping similar data points. Initially, the K- elements in the image are determined and these elements represent the characteristics of the disease that help in the segmentation of the affected region. These K-elements form the group of clusters and the distance between the elements and the clusters is evaluated. The impact of the distance between the detected clusters is normalized so that the distance doesn’t dominate over the characteristics of the affected region.
GLCM is a feature extraction technique of analyzing pixels in an image using texture calculations to determine the gray level in the second order. The analysis is carried out by extracting the texture features concerning the statistical distribution of the pixel intensity. Further, the features obtained from the pixel matrix value form an orientation pattern angle for analyzing the pattern of the disease and assist in minimizing the dimensionality of the images by extracting the essential features that are needed for detecting the plant disease. In this research, the significant features extracted are described in the below section.
The contrast is the computation of the intensity of a pixel and its neighbor throughout the image. The contrast is determined by measuring the variation between the color and the brightness of the object and the other object and is given by,
H - 1 H - 1
C con = ^^ ( u - v )2 b ( u , v ) u = 0 v = 0
here, u and v represents the rows and columns in the GLCM, b ( u , v ) denotes the value of the matrixes.
-
3.4.2 Energy
-
3.4.3 Correlation
The extent of the pixel pair’s repetitions is measured by energy and this energy gauges the uniformity of the image. The energy value will be high when the pixels are the same and are given by,
C energy = X, ( u ’ v ) (4)
u , v
The value of energy is in the range [ 0,1 ] and is derived by the sum of the pixels present in the matrix.
The evaluation of the linear relationship between the gray levels of adjacent pixels is known as correlation and is mathematically represented as,
E ( u - “ u )( V - “ v ) b ( u , v )
^^„ here, “ and a denotes the mean and standard deviation of the GLCM.
-
3.4.4 Homogeneity
-
3.4.5 Entropy
The measurement of the image texture is performed by homogeneity and the local homogeneity is also measured using homogeneity. This feature computes the closeness of the measure of the elements in the matrix and is given by, h -1 h-1
C hom o = ^^ b ( u , v ) log 2 [ b ( u , v ) ] (6)
u = 0 v = 0
The measure of randomness of the image that helps in characterizing the texture of the image and the value of the entropy is mathematically represented as,
H - 1 H - 1
C ent -ZX b ( u , v ) log 2 [ b ( u , v ) ] (7)
u = 0 v = 0
Finally, the feature vector is acquired by concatenating the different features obtained from the feature extraction and is given as, Fv =[ C co n , Cenergy , Acorr , C hom o , Cent ] , and the dimension of Fv is ( 1x10⁶ ) .
-
3.5 MPO-based deep neural network
-
3.5.1 Modified Political Optimization Algorithm
The MPO deep NN network that can learn complex relationships is utilized for predicting plant disease. The NN can detect unseen data by generalizing the data present. The input feature vector obtained from the feature extraction stage F is forwarded to the hidden layers by the input layer and the hidden layer is responsible for the deeper analysis of the features. The hidden layers exhibit multiple functions and the resultant function is given by the output layers. The hidden layers comprise the number of neurons containing the weights and bias and are adjusted utilizing the MPO algorithm for generating the output. The deep neural networks used in this model assist in learning the complex disease patterns and relationships in the features. The MPO enables DNN to make accurate predictions by updating weights and biases based on the determined optimal solution. By modifying the model’s weights the MPO algorithm aids in improving its performance and can reduce the requirements of more computational resources and reduce the computation burden. In this context, the model can help to accurate prediction of plant diseases with less computational resources. The architecture of the MPO-adapted deep NN is depicted in Figure 2.
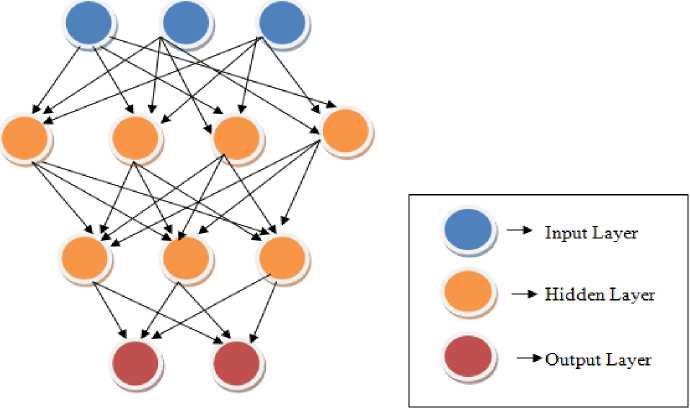
Fig. 2. Schematic representation of the deep neural network
The MPO algorithm works based on politics, which consists of two important characteristics such as each individual in the party tries to win the election by optimizing their goodwill, and the number of seats in the parliament is maximized by the party to win the election. Each individual in the party is considered as the best solution and the good will of the person is considered as the position of the best solution. The goodwill of the personality is described by the attributes necessary for plant leaf disease detection. The election is considered as the objective function that can be maximized or minimized for obtaining the best solution and the number of votes needed for winning the election is considered as the fitness function.
-
i) Initialization of political parties
Initially, the political parties are initialized and the initialized parties are described by the following equations,
here, N denotes the number of political parties, and the total number of parties is represented by n , Nz designates the z number of candidates present in the parties. Each member m of the party is considered as an optimal solution. The number of variables used for resolving the problems identified in the kth dimension is given by N z m . This solution could be assigned to the candidates who can vote and the group of voters called constituencies are formed and represented by P and given by,
-
ii) Fitness Evaluation
The leader for each party is selected based on inter voting and the best leader of each party is selected, which is considered as the fitness function and the function is described by the equation as follows,
F = argmin f (Nm )
1 < m < n
Pm={ Pfi}
The winners of the party become leaders and now the leader is considered as the parliamentarians. The candidate selected with the best fitness value is denoted by N * and the best leaders in the constituent parties are represented by,
The members who become the parliamentarians from each party are represented by,
-
iii) Voting phase
The members of the political parties learn from their previous experiences during the election and they will try to improve their knowledge and behavior to win the current election and this behavior stands as the position update of the member in the party. The person who improves their behavior has the probability of obtaining a higher number of votes and winning the election and this behavior has emerged from, the recent past. The position update of the individuals solely relies on the equation fitness function. Comparing the fitness with the current and the previous iteration f ( Nz1 T ) ) and f ( N m ( t - 1 ) ) the decision is made as to whether there is a need for a position update or not. If the fitness function of the current iteration is best then the position is updated by the below equation,
L m,d T + 1 ) =
'p * + rand ( p * - Lmd ( r ) )
f md ( t - 1 ) < L m , d ( t ) < P * orL m , d ( t — 1 ) a L m,d ( т ) > P *
p * + ( 2 rand - 1 ) | p * - L md ( t ) | ;fL md ( t - 1 ) < p * < L md ( t ) orL m , d ( t - 1 ) > p * > L m d ( t )
p * + ( 2 rand - 1 ) | p * - L md ( t - 1 ) | ;f p * < L m , d ( t - 1 ) < L md ( t ) or p * > L md ( t - 1 ) > L m , d ( t )
The location is changed using the following equation if the fitness of the current iteration is not better than the prior iteration.
Lm.d ( t + 1 ) =
p + ( 2 rand - 1 ) | p - L^ |
Lm , d ( t - 1 ) + rand ( Im,d ( r ) - Lm,d ( r - 1 ) )
p* +( 2 rand - 1 ) | p * - Lm , d ( r - 1 ) 1
fm , d r - 1 ) < Lm, d r ) < p * °rLm. d r - 1 ) > Lm, d r ) > p * fm , d ( r - 1 ) < p * < Lm , d ( r ) orLm , d ( r - 1 ) > p * > Lm. d ( r )
;fp * < Lm, d r - 1 ) < Lm , d ( r ) orp * > Lm , d ( r - 1 ) > Lm , d ( r )
In the above-mentioned position update equations, the position update relies upon the party leaders P m * and next to these party leaders, the position update depends on the winners who become parliamentarians represented by C m * . rand represents the random number that possesses the values [ 0,1 ] , p * initially represents the party leader Lm d in the dimension d , and then represents the winner of the parliament Pz * , d . To determine the most prominent solution the position update is performed based on three cases, which are represented below.
Case 1: The current best solution present amidst the previous and the reference solution and the most prominent solution to be exploited lie next to the reference solution in the distance A = | p * - L md ( r ) |
Case 2: The referenced solution lies amidst the current and previous best position of the individual and the prominent solution lies in the region m * bounded by the distance A = | p * - L md ( r ) |
Case 3: The previous position of the candidate lies amidst the current position and the referenced solution, and the prominent solution lies in the region around the referenced solution m * in the distance A = | p * - L m , d ( r - 1 ) | .
v) Opponent phase
Although the leader is selected by their goodwill, the strength of the opponent also needs to be estimated to improve the chances of winning. This behavior is generated by mimicking the behavior of the whale that follows a spiral updating behavior for providing a global search. The position of the whale is considered as the current candidate and the prey is considered as the opponent is described by ( L , V ) and ( L *, V * ) . The spiral equation initiated using the position between the individual and the opponent is given by,
L ( r + 1 ) = G • e x • cos ( 2 n y ) + L ( r ) (19)
here, L ( r + 1 ) denotes the spiral equation generated to determine the distance between the individual and the opponent. G describes the distance between the current individual and the opponent and is computed as G = | l * ( t ) - L ( r )| . The spiral behavior is represented by e xy • cos ( 2 n y ) , where x represents the spiral function and y represents a random number in the range [- 1,1 ] . Further, the spiral update strategy of the whales is integrated into the MPO algorithm that enables to adjust the search range to determine the distance between the individual and the opponent and to converge to the optimal solution faster. The element-wise multiplication is represented by ‘ ’ ’ and L ( r ) denotes the behavior exhibited in the previous election. When this opponent phase is integrated with their voting ability the best candidate solution could be obtained and the equation is given by,
Lbest ( r + 1 ) = 0.5 L md ( r + 1 ) + 0.5 { g • exy • cos ( 2 n y ) + L ( r ) } (20)
The MPO algorithm determines the best optimal solution and the MPO enables the deep NN prediction model to make accurate predictions by updating weights and biases concerning the determined best solution for attaining the high detection accuracy of the plant disease prediction. Hence, the MPO algorithm assists in reducing the time complexity and enables the attainment of a low error rate for predicting plant disease by the MPO-adapted deep NN model.
The parameters of the training process involve epochs of 100, a learning rate of 0.01, a batch size of 32, the population size of the MPO optimization is 50, and the loss function MSE is optimized utilizing the Adam optimizer.
Table 1. Pseudo code for the modified political optimization algorithm
|
S.No |
Algorithmic steps for the modified political optimization algorithm |
|
1 |
Initialize: N , Nz , N z m , P , Pm |
|
2 |
* Determine fitness function: F , P m |
|
3 |
* Determine best leaders: N c |
|
4 |
Determine parliament winners: P |
|
5 |
If (Current solution is best) #Voting phase |
|
6 |
{ |
|
7 |
For ( l , d т-^ L md ( t ^ p * orL md т -^ L m d т )> p * ) |
|
8 |
L m , d ( t + 1 ) = p * + rand ( p * - L m , d ( t ) ) |
|
9 |
For ( L m ,, d ( t — 1 ) ^ p * ^ L m , d ( t ) orL m , d ( t — 1> p * > L md T ) ) |
|
10 |
L m , d ( t + 1 ) = p * + ( 2 rand — 1 ) | p * — L m , d ( t )l |
|
11 |
For ( p * ^ L m , d ( t " 1 ) ^ L m , d ( t ) orp * > L m , d ( t " 1> L m , d ( t ) ) |
|
12 |
L md ( t + 1 ) = p * + ( 2 rand " 1 ) l p * " L md ( t " 1 ) l |
|
13 |
} |
|
14 |
Else |
|
15 |
{ |
|
16 |
For ( L m , d ( t " 1 ) ^ L md ( t ) ^ p * orL md ( t -0> L md ( t ) > p *) |
|
17 |
L md ( t + 1 ) = p * + ( 2 rand " 1 ) I p * " L m ,, d l |
|
18 |
For ( L md ( t " 1 ) ^ p * ^ L md ( t ) orL mdd ( t " 1> p* >- L m,d ( t ) ) |
|
19 |
L md ( t + 1 ) = L md ( t - 1 ) + rand ( L md ( t ) - L m , d ( t - 1 ) ) |
|
20 |
For ( p * ^ L m , d ( t - 1 ) ^ L m , d ( t ) orp * > L m , d ( t - 1 ) > L m , d ( t ) ) |
|
21 |
L m , d ( t + 1 ) = p * + ( 2 rand - 1 ) l p * - L m , d ( t - 1 ) l |
|
22 |
} |
|
23 |
End |
|
24 |
Determine spiral update equation # Opponent phase |
|
25 |
L ( t + 1 ) = G ■ e x ■ cos ( 2 n y ) + L ( t ) |
|
26 |
Update the best solution |
|
27 |
Lbest ( t + 1 ) = 0.5 Lmd ( t + 1 ) + 0.5 { g ■ exy ■ cos ( 2 n y ) + L ( t ) } |
|
28 |
Terminate |
4. Results and Discussion
The results obtained are analyzed based on cotton and soya using the MPO-adapted deep NN and a brief analysis of the results is depicted below.
-
4.1 Dataset description
-
4.2 Parameter metrics
Real-time data is used for the detection of the disease and the data is mostly collected from the farm fields and internet sources. The diseases in the cotton and soya are identified and the diseases are identified based on the leaf, root, and stem. Various images relevant to diseases such as Ascochyta gossypii, blue disease, grey mildew, Xanthomonas citri subs, Bacterial Blight, Bacterial pustules, Caterpillar, and Diabrotica speciosa are collected. Similarly, the diseased roots
Table 2. Number of images
Accuracy: The measure of how many instances out of all the instances identified exactly as the diseased plants is known as accuracy and expressed as,
Acc =
P + N t
P t + N + P f + N f
Sensitivity: It designates the proportion of classes that correctly identify the presence of disease and is given by,
Sen =
P t
P t + N f
Specificity: The instances that are correctly classified as healthy are evaluated using specificity and are mathematically stated as,
Spec =
N t
N t + P f
-
4.3 Experimental results for the MPO-adapted NN classifier
The results obtained by the MPO-adapted NN classifier experimentally are shown in Fig 3 and 4. The preprocessed images of cotton and soya both in terms of healthy and diseased plants are shown. The segmented images obtained using the MPO-adapted NN are also interpreted, which assist in the prediction of disease. The disease is predicted in leaves, roots, and stems, which acts as a significant contribution.
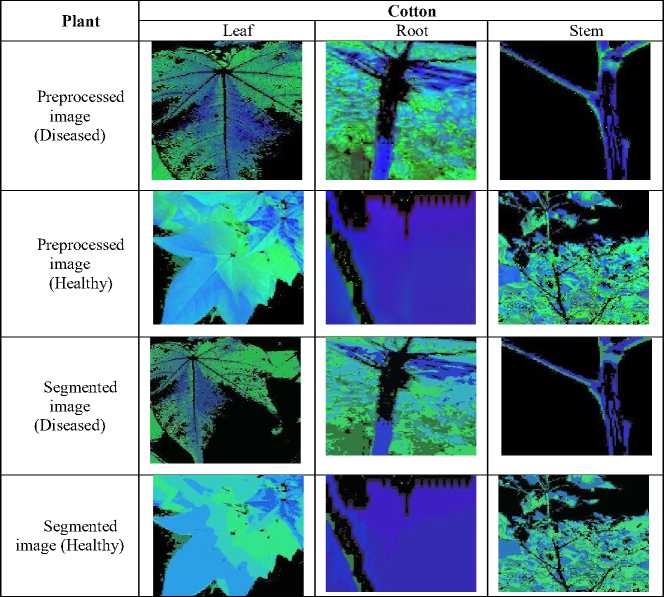
Fig. 3. Experimental results using Cotton
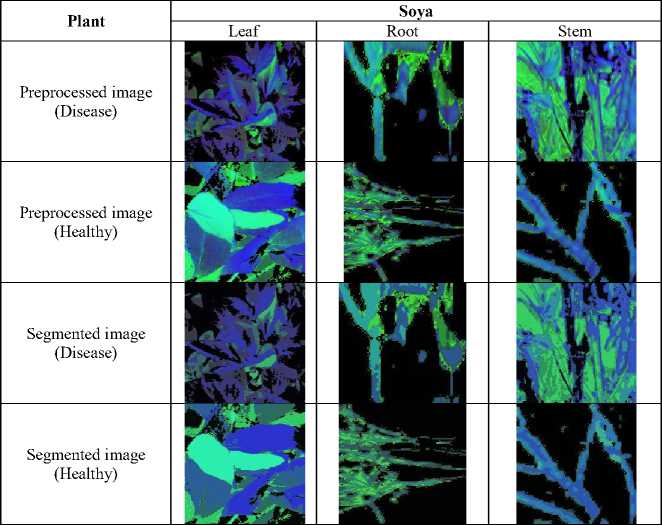
Fig. 4. Experimental results using Soya
-
4.3.1 Experimental results using real plant images for the MPO-adapted deep NN model
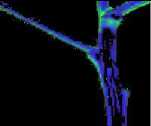
The results obtained by real images of cotton stem and soya leaf utilizing the MPO-adapted NN model experimentally are shown in Fig 5. The preprocessed images of cotton and soya both in terms of healthy and diseased plants are shown. The segmented images acquired utilizing the MPO-adapted NN are also interpreted, which enables the correct prediction. Further, the predicted output as healthy or diseased is obtained.
Soya leaf
Images
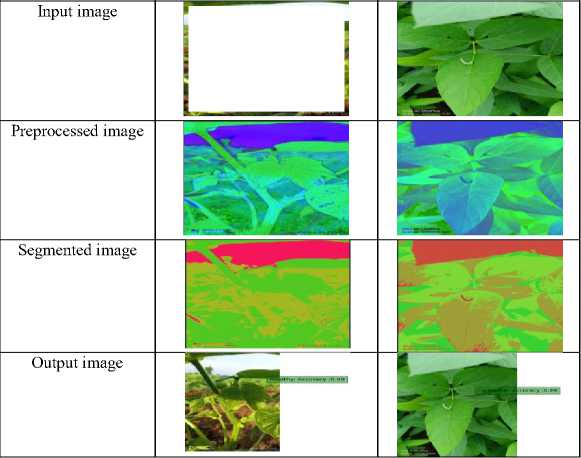
Fig. 5. Experimental results showing real images of cotton stem and soya leaf.
Cotton stem

-
4.4 Experimental results for the MPO-adapted NN classifier
The results obtained by the MPO-adapted NN classifier experimentally are shown in Figures 6 and 7. The preprocessed images of cotton and soya both in terms of healthy and diseased plants are shown. The segmented images obtained using the MPO-adapted NN are also interpreted, which helps in the prediction. The disease is predicted in leaves, roots, and stems, which acts as a significant contribution.
Plant
Cotton
Preprocessed image (Disease)
Preprocessed image (Healthy)
Segmented image (Disease)
Segmented image (Healthy)
Leaf
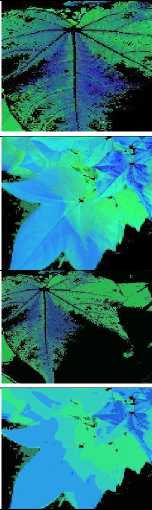
Stem
Root
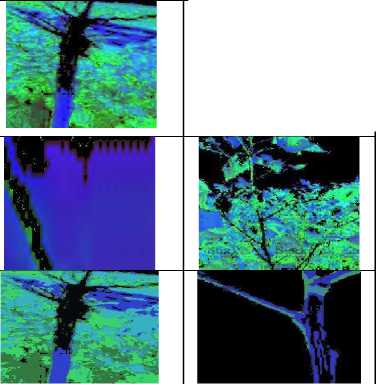

Fig. 6. Experimental results using Cotton
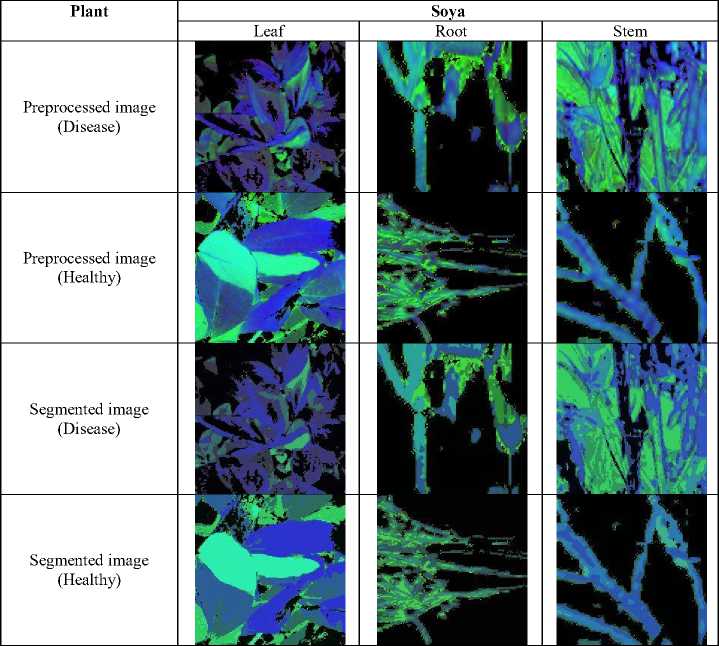
Fig. 7. Experimental results using Soya
-
4.5 Performance evaluation for MPO-adapted deep NN model
The performance of the MPO-adapted deep NN model was analyzed concerning the k-fold and the Training Percentage (TP) and the superiority is evaluated by utilizing the different metrics to reveal the efficacy of the model.
-
a) Performance evaluation utilizing the K-fold
The performance evaluation is enabled to detect the performance of the model under varying epochs involving 20, 40, 60, 80, and 100 depending on the k-fold 4, 6, 8, and 10. The results obtained using leaf, stem, and root are individually represented in below Table 3 using the parameter metrics. The analysis shows that for the varying iterations concerning the k-fold, the MPO-adapted deep NN provided exceeding performance for the varying epochs and is considered to be efficient.
Table 3. K-fold analysis for the proposed MPO adapted deep NN based on cotton and soya
K-fold analysis for the proposed MPO adapted deep NN (k-fold 10)
|
Plant/Parts |
Cotton |
||||||||
|
Accuracy |
Sensitivity |
Specificity |
|||||||
|
Epochs/ Metrics |
Leaf |
Root |
Stem |
Leaf |
Root |
Stem |
Leaf |
Root |
Stem |
|
20 |
92.90 |
94.20 |
99.00 |
94.40 |
94.20 |
98.60 |
91.50 |
94.00 |
99.00 |
|
40 |
94.20 |
94.10 |
99.00 |
94.50 |
94.30 |
99.00 |
94.10 |
94.20 |
99.00 |
|
60 |
94.60 |
94.20 |
99.00 |
94.80 |
94.40 |
99.00 |
94.50 |
94.30 |
99.00 |
|
80 |
96.00 |
94.40 |
99.00 |
96.90 |
94.50 |
99.00 |
95.20 |
94.40 |
99.00 |
|
100 |
99.00 |
94.50 |
99.10 |
97.50 |
94.60 |
99.10 |
99.00 |
94.50 |
99.10 |
|
Plant/Parts |
Soya |
||||||||
|
Accuracy |
Sensitivity |
Specificity |
|||||||
|
Epochs/ Metrics |
Leaf |
Root |
Stem |
Leaf |
Root |
Stem |
Leaf |
Root |
Stem |
|
20 |
94.10 |
95.30 |
94.60 |
94.50 |
94.60 |
93.80 |
93.80 |
96.30 |
95.70 |
|
40 |
93.90 |
96.70 |
94.80 |
94.60 |
94.80 |
93.80 |
93.90 |
97.20 |
96.00 |
|
60 |
94.00 |
96.90 |
95.20 |
94.80 |
95.70 |
94.00 |
93.90 |
97.80 |
96.60 |
|
80 |
94.00 |
97.00 |
96.30 |
97.90 |
96.30 |
94.30 |
94.00 |
97.80 |
98.60 |
|
100 |
96.10 |
97.80 |
98.90 |
99.00 |
96.90 |
99.00 |
94.40 |
98.80 |
99.00 |
-
b) Analysis concerning TP
-
i) Performance evaluation relying on cotton data:
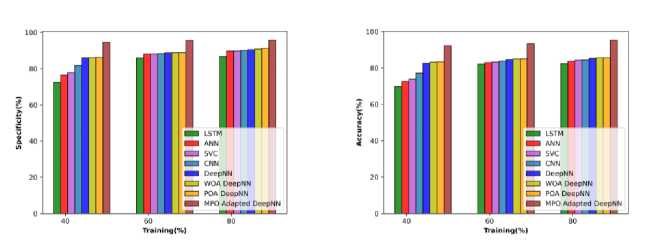
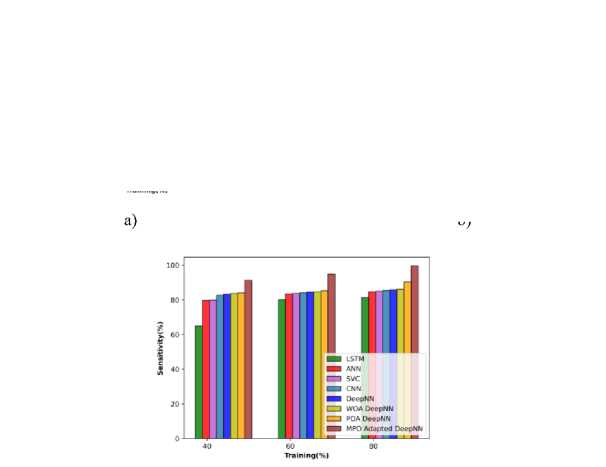
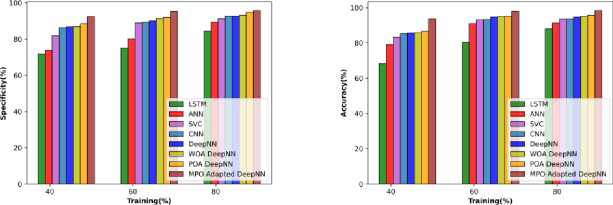
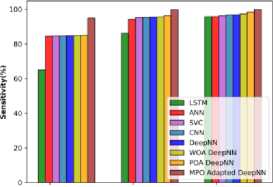
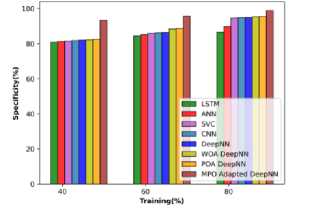
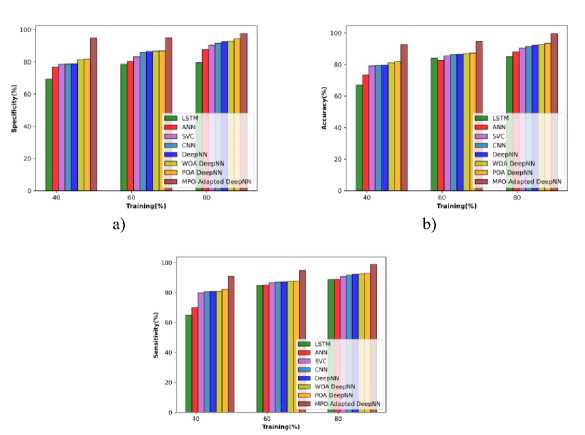
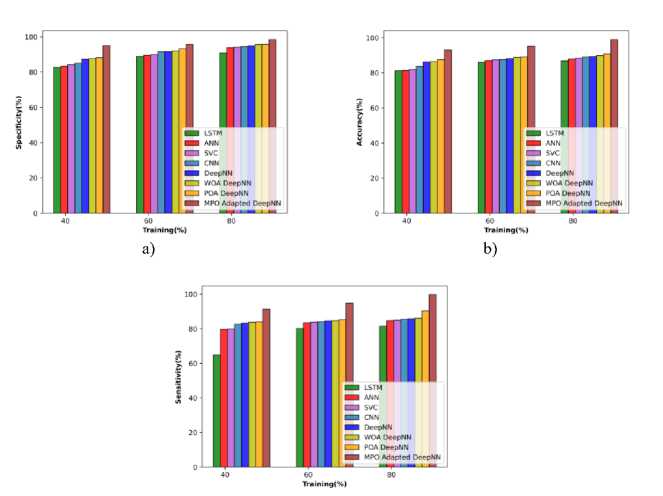
The performance based on the cotton leaves in terms of metrics is observed and illustrated in Figure 8 a), b), and c) respectively. The MPO-adapted deep NN attained an accuracy of 93.56% at TP 40, which is increased to 98.363 at TP 80. The sensitivity attained by the MPO-adapted deep NN model is 94.893%, which is improved to 99.900% at 80% of training. Similarly, the specificity attained is 92.427% at TP 40, which is enhanced to 95.744% at 90% of training.
c)
Fig. 8. Performance evaluation concerning cotton leaf data a) specificity, b) accuracy, c) Sensitivity
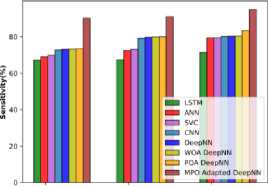
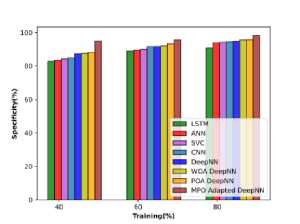
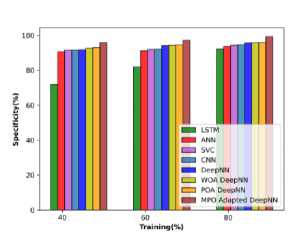
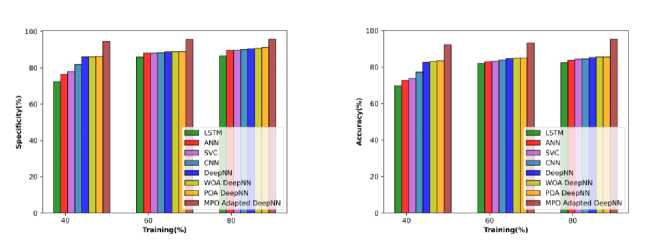
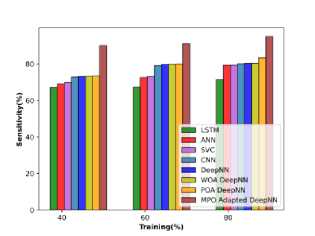
The performance relying on cotton root concerning specificity, accuracy, and sensitivity is observed and it is demonstrated in Figure 9 a), b), and c). The MPO-adapted deep NN achieves an accuracy of 92.272% at TP 40, which is enhanced to 95.295% at TP 80. In the case of sensitivity, the MPO-adapted deep NN obtains a sensitivity of 90.130% at
TP 40 and it provides the enhancement of 5.127% at 80% of training. The specificity of the model is observed to be 94.599% at TP 40 and it is increased to 95.780% at TP 80.
b)
a)
40 60 80
Training^)
c)
Fig. 9. Performance evaluation concerning cotton root data a) specificity, b) accuracy, and c) sensitivity
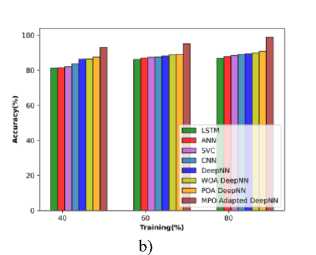
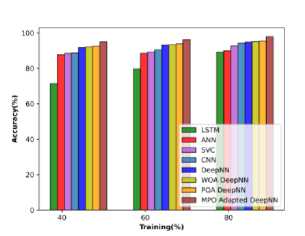
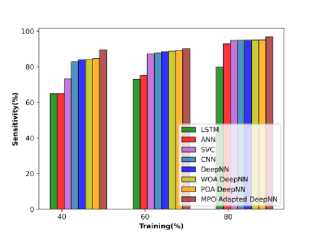
The performance relying on cotton stems concerning the evaluation metrics is analyzed and illustrated in Figure 10 a), b), and c). At 40% of training the accuracy of the MPO-adapted deep NN is 91.343 %, which is increased to 96.983% at TP 80. The sensitivity is observed to be 89.488% at TP 40 and it progressively increases to 90.250 at TP 60 and finally attains 96.880% at 80% of training. Further, the specificity of the MPO-adapted deep NN at TP 40 is observed to be 93.80% and it is enhanced to 98.964% at TP 80.
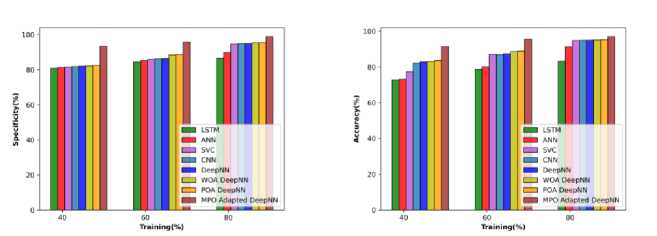
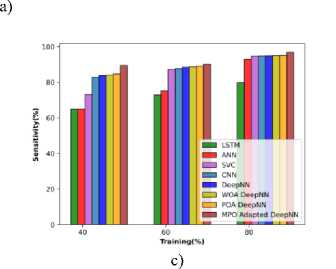
Fig.10. Performance evaluation concerning cotton stems data a) specificity, b) accuracy, and c) sensitivity
-
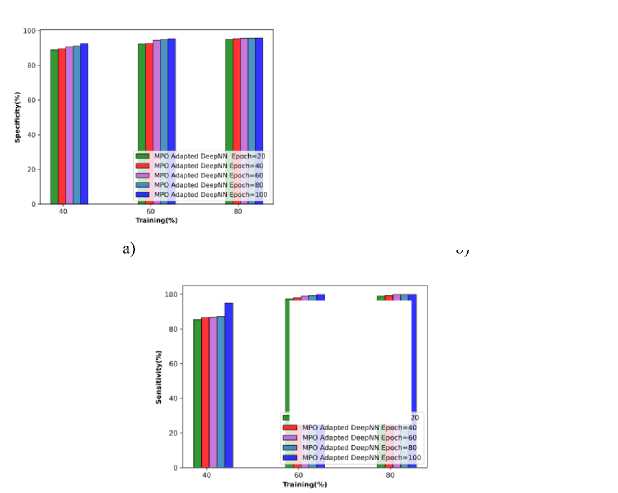
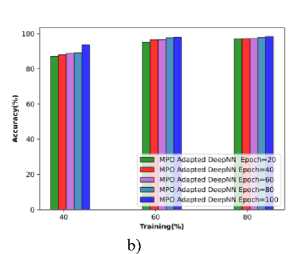
ii) Performance evaluation concerning soya
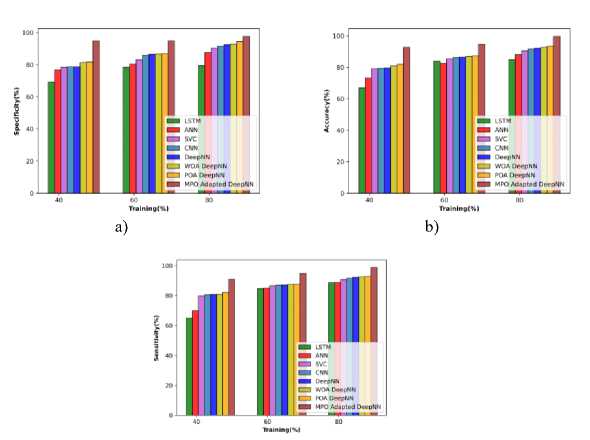
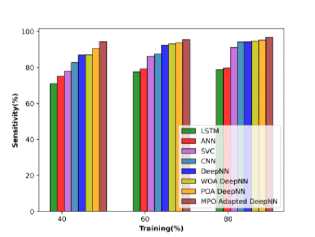
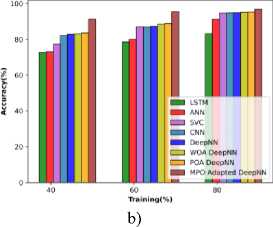
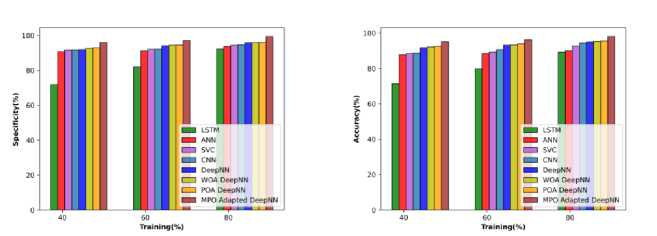
The analysis utilizing the soya leaves is demonstrated in Figure 11 a), b), and c) respectively. Concerning accuracy, the MPO-adapted deep NN attains 92.693% at TP 40, which is enhanced to 99.604 at TP 80. This exhibits that the performance of the MPO-adapted deep NN is enhanced with TP improvement. The sensitivity obtained by the MPO-adapted deep NN is found to be 90.823%, which is improved to 98.842% at TP 80. Equivalently, the specificity attained is 94.749% at TP 40, which is enhanced to 97.566 % at TP 80. The enhancement in the performance is due to the effective hyperparameter tuning by Modified Political Optimization.
c)
Fig.11. Performance evaluation concerning soya leaf data a) specificity, b) accuracy, and c) Sensitivity
The performance concerning the soya root concerning the metrics is observed and it is depicted in Figure 12 a), b), and c). The MPO-adapted deep NN achieves an accuracy of 93.036% at TP 40, which is enhanced to 98.974% at TP 80. In the case of sensitivity, the MPO-adapted deep NN obtains a sensitivity of 91.297 % at a TP of 40 and it shows an enhancement of 8.471% at a TP of 80. The specificity of the MPO-adapted deep NN is 94.962% at TP 40 and it is enhanced to 98.400% at TP 80.
c)
Fig.12. Performance evaluation concerning the soya root data a) specificity, b) accuracy, and c) Sensitivity
The performance utilizing the cotton stem in terms of metrics is depicted in Figure 13 a), b), and c). At TP 40, the accuracy of the MPO-adapted deep NN is 95.044 %, which is increased to 97.995% at TP 80. The sensitivity is observed to be 94.368% at TP 40 and it steadily increased to 95.540 at 60% of training and finally attained 96.839% at 80% of training. Similarly, the specificity at TP 40 is 95.909% and it is enhanced to 99.348% at TP of 80.
a)
b)
c)
Fig.13. Performance evaluation concerning soya stems data a) specificity, b) accuracy, and c) Sensitivity
-
4.6 Comparative Evaluation
The superiority of the model over the literature methods such as Long short-term memory (LSTM) [19], Artificial neural networks (ANN) [20], Support vector classification (SVC) [21], CNN [22], Deep NN [23], WOA deep NN [24], POA deep NN [25] is proved by the comparative analysis.
-
a) Comparative evaluation utilizing the K-fold
The comparative evaluation utilizing k-fold values 4, 6, 8, and 10 and the evaluation shows that the MPO-adapted deep NN classifier attained maximum values than the preceding techniques, and the attained values are depicted in detail in Table 4.
Table 4. Comparative analysis of the MPO-adapted deep NN classifier
|
k-fold comparative analysis (k-fold-10) |
|||||||||
|
Metrics/ Methods |
Cotton |
||||||||
|
Accuracy |
Sensitivity |
Specificity |
|||||||
|
Leaf |
Root |
Stem |
Leaf |
Root |
Stem |
Leaf |
Root |
Stem |
|
|
LSTM |
90.10 |
97.79 |
92.40 |
92.60 |
97.79 |
92.20 |
87.80 |
97.79 |
95.00 |
|
ANN |
93.20 |
97.89 |
94.20 |
93.80 |
97.89 |
93.80 |
87.80 |
97.89 |
95.30 |
|
SVC |
93.20 |
97.99 |
94.40 |
93.90 |
97.99 |
94.00 |
88.70 |
97.99 |
96.80 |
|
CNN |
93.30 |
98.08 |
96.00 |
93.90 |
98.08 |
94.30 |
88.90 |
98.08 |
97.50 |
|
Deep NN |
93.40 |
98.18 |
96.20 |
94.00 |
98.18 |
94.50 |
89.20 |
98.18 |
98.10 |
|
WOA deep NN |
93.80 |
98.28 |
98.90 |
94.20 |
98.28 |
94.50 |
91.30 |
98.28 |
99.00 |
|
POA deep NN |
92.80 |
98.38 |
99.00 |
94.30 |
98.38 |
94.80 |
91.40 |
98.38 |
99.00 |
|
Proposed |
99.00 |
98.88 |
99.10 |
97.50 |
98.88 |
99.10 |
99.00 |
98.88 |
99.10 |
|
Soya |
|||||||||
|
Metrics/ Methods |
Accuracy |
Sensitivity |
Specificity |
||||||
|
Leaf |
Root |
Stem |
Leaf |
Root |
Stem |
Leaf |
Root |
Stem |
|
|
LSTM |
84.70 |
91.60 |
85.80 |
88.50 |
93.80 |
82.70 |
67.60 |
89.30 |
93.50 |
|
ANN |
85.40 |
91.80 |
88.30 |
89.30 |
93.90 |
83.70 |
68.30 |
91.00 |
93.80 |
|
SVC |
85.70 |
93.70 |
90.10 |
93.80 |
93.90 |
84.30 |
68.80 |
92.30 |
93.80 |
|
CNN |
88.00 |
93.80 |
90.20 |
93.90 |
94.00 |
84.60 |
76.50 |
93.70 |
93.80 |
|
Deep NN |
90.80 |
93.80 |
90.40 |
94.00 |
94.30 |
85.40 |
78.00 |
93.80 |
94.00 |
|
WOA deep NN |
91.20 |
94.60 |
90.80 |
94.00 |
94.30 |
86.40 |
85.70 |
95.10 |
94.00 |
|
POA deep NN |
94.00 |
94.40 |
93.40 |
94.40 |
94.40 |
93.40 |
93.80 |
95.70 |
94.40 |
|
Proposed |
96.10 |
97.80 |
99.00 |
99.00 |
96.90 |
99.00 |
94.40 |
98.80 |
99.00 |
-
b) Comparative evaluation concerning TP
-
i) Comparative evaluation relying on cotton
Comparative evaluation relying upon cotton leaves in using the metrics is interpreted in Figure 14 a), b), and c). The MPO-adapted deep NN model attains the enhancement of 10.490%, 7.249%, 4.993%. 4.959%, 3.731%, 3.274% and 2.792%, while compared with other competent models. Thus it shows that MPO-adapted Deep NN obtains the maximum accuracy than the preceding techniques. The method attains performance improvement of 4.205%, 4.133%, 3.573%, 3.096%, 3.043%, 2.566%, and 1.560% respectively in terms of sensitivity. The MPO-adapted DeepNN attains a specificity of 95.744 at TP 80, which is higher than other the preceding techniques with the specificity of 84.428%, 89.295%, 91.263%, 92.685%, 92.685%, 93.122%, and 94.870%.
a) b)
40 60 80
Training^)
c)
Fig.14. Comparative evaluation relying on cotton leaf data a) specificity, b) accuracy, and c) Sensitivity
Comparative evaluation of cotton roots depending on specificity, accuracy, and sensitivity is revealed in Figure 15 a), b), and c). The MPO-adapted deep NN model attains performance improvement of 13.577%, 12.144%, 11.586%. 11.347 %, 10.587%, 10.246%, 10.246 and 10.243%, while compared with other competent models. The proposed method obtained an improvement of 24.756%, 16.470%, 16.391%, 15.660%, 15.416%, 15.566%, 15.416, 15.399%, and 12.198% respectively for sensitivity with preceding techniques. The MPO-adapted DeepNN attains a specificity of 95.744 at TP 80, which is higher than other traditional techniques with the specificity of 86.609%, 89.678%, 89.712%, 90.062%, 90.445%, 90.829%, and 91.213%.
b)
a)
c)
Fig. 15. Comparative evaluation on cotton root data a) specificity, b) accuracy, and c) Sensitivity
Comparative evaluation of cotton stems concerning the evaluation metrics is shown in Figure 16 a), b), and c). The MPO-adapted deep NN model attains performance improvement of 14.203%, 5.891%, 2.369%. 2.258%, 2.184%, 1.935%, and 1.822%, while compared with other preceding techniques. Thus it shows that MPO-adapted DeepNN attains the highest accuracy than the other conventional approaches. The MPO-adapted DeepNN technique attains improvement of 17.405%, 4.094%, 2.124%, 2.050%, 1.976302%, 1.902%, and 1.827, respectively from preceding techniques in terms of sensitivity. The MPO-adapted DeepNN attains a specificity of 98.964 at TP 80, which is comparatively higher than that of the conventional methods with the specificity of 86.567%, 89.809%, 94.74`%, 94.883%, 90.954%, 95.367%, and 95.514%.
a)
c)
Fig.16. Comparative evaluation depending on cotton stems data a) specificity, b) accuracy, and c) sensitivity
-
ii) Comparative evaluation of Soya
Comparative evaluation of soya leaves concerning the evaluation metrics is depicted in Figure 17 a), b), and c). The MPO-adapted DeepNN attains an improvement of 14.722%, 11.541%, 9.204%. 8.121%, 7.348%, 7.024% and 6.113%, respectively over the preceding techniques . Thus it shows that MPO-adapted DeepNN attains the highest accuracy than the other technique. The proposed method attains performance improvement of 10.157%, 10.102%, 8.267%, 7.313%, 6.685%, 6.340%, and 6.100% respectively in terms of sensitivity over the preceding techniques. The MPO-adapted DeepNN attains a specificity of 97.566 at TP 80, which is higher than the existing techniques of 79.504%, 87.537%, 90.383%, 91.600%, 92.521%, 92.825 %, and 94.405% respectively.
c)
Fig.17. Comparative evaluation on soya leaf data a) specificity, b) accuracy, and c) sensitivity
Comparative evaluation of soya roots concerning evaluation metrics is depicted in Figure 18 a), b), and c). The model attains improvement of 12.184%, 11.234%, 10.703%. 10.016 %, 9.703%, 9.162%, and 8.213%, while compared with other competent models. Thus it shows that MPO-adapted DeepNN attains the highest accuracy than the other technique. The MPO-adapted DeepNN method attains improvement of 18.286%, 15.082%, 14.777%, 14.204%, 13.953%, 13.677%, and 9.444% respectively in terms of sensitivity with competent techniques. The MPO-adapted DeepNN attains a specificity of 98.400 at TP 80, which is higher than that of the conventional methods with the specificity of 90.856%, 93.893%, 94.129%, 94.359%, 94.820%, 95.601%, and 95.728%.
c)
Fig.18. Comparative evaluation on soya root data a) specificity, b) accuracy, and c) sensitivity
Comparative evaluation of soya stems regarding the evaluation metrics is shown in Figure 19 a), b), and c). The MPO-adapted DeepNN attains the improvement of 12.36%, 6.195, 5.225, 4.78%, 3.33%, 1.36%, and 2.25%, while compared with other competent models. Thus it shows that MPO-adapted DeepNN attains the highest accuracy than the other technique. The proposed method attains sensitivity improvement of 13.33%, 5.775, 5.46%, 5.34%, 4.52%, 4.40%, and 4.15%, respectively over other competent techniques. The MPO-adapted DeepNN attains a specificity of 99.10 at TP 80, which is higher than that of the conventional methods with specificity of 87.87%, 92.61%, 94.23%, 94.97%, 96.66%, 97.79%, and 98.80%.
b)
a)
ют
I DeepNN
THIning(%)
c)
Fig.19. Comparative evaluation on soya root data a) specificity, b) accuracy, and c) sensitivity
-
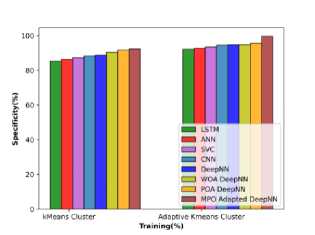
c) Analysis of clustering mechanisms
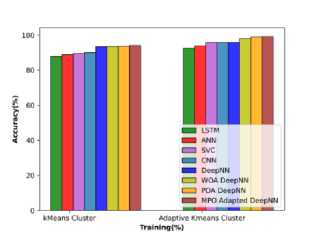
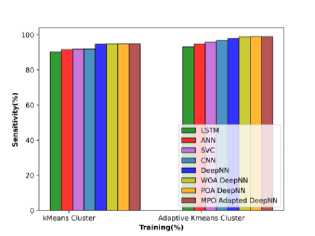
The enabling of adaptive k-means clustering helps in furthermore improvising the convergence and provides simplicity by segmenting the affected regions. The dimensionality of the data is greatly reduced by this adaptive k-means clustering algorithm and the improvement achieved by this algorithm over the k-means clustering is schematically shown in figure 20.
a)
b)
c)
Fig. 20. Comparative evaluation on clustering a) accuracy b) sensitivity c)specificity
-
4.7 Comparative discussion
-
4.8 Convergence analysis:
-
4.9 Time Complexity Analysis
The results from the various plant disease detection models are covered in detail in this section. LSTM, ANN, SVC, CNN, DeepNN, WOA Deep NN, and POA Deep NN are the techniques utilized for comparative evaluation. Most of the above baseline methods exhibit specific limitations that limit the performance. The LSTM method had limited performance as the classifier failed to learn the features effectively [19]. The ANN method in which the optimization requires other parameters to be adjusted accordingly in case the optimized parameter is altered, to move towards the optimal solution, and the system performance can be affected by the overfitting issues[20]. Additionally, the regression problems limited the performance of the SVC technique [21]. The CNN technique was found with the challenges of overfitting and exploding gradient that limited the performance [22]. The challenge associated with the neural network hyperparameters tuning and the optimization requires proper adaptation that limits the efficiency of the method [24]. The low convergence accuracy was obtained in the POA deep NN that degraded the performance of the prediction [25]. However, the proposed plant disease detection overcame the above limitations by utilizing advanced preprocessing that eliminated the distortions and noise in the image. The method utilized the Adaptive K-means that segmented the diseased region of the image correctly followed by the informative feature extraction with the GLCM method and finally the classification was carried out utilizing the MPO-adapted deep NN. The MPO optimization tunes the hyperparameters of the deep NN to converge to the optimal solution that reduces the computational complexity. Further, the MPO-adapted deep NN learned the complex relationship and detected the presence of the disease with high accuracy. The performance of the conventional plant disease prediction techniques is depicted in the discussion. For the comparative assessment, the images from the cotton and soya plants are used. To evaluate the models, images of the leaves, roots, and stems of cotton and soya plants are employed. Table 5 illustrates the comparative discussions of the suggested MPO-adapted Deep NN very well. The exceeding performance of MPO-adapted Deep NN is due to the optimal parameter tuning of the DeepNN network by the modified political optimization.
Table 5. Comparative discussion of the MPO-tuned deep NN classifier
|
Plant/ Methods |
Cotton (K-fold) |
||||||||
|
Accuracy |
Sensitivity |
Specificity |
|||||||
|
Leaf |
Root |
Stem |
Leaf |
Root |
Stem |
Leaf |
Root |
Stem |
|
|
LSTM |
90.10 |
97.79 |
92.40 |
92.60 |
97.79 |
92.20 |
87.80 |
97.79 |
95.00 |
|
ANN |
93.20 |
97.89 |
94.20 |
93.80 |
97.89 |
93.80 |
87.80 |
97.89 |
95.30 |
|
SVC |
93.20 |
97.99 |
94.40 |
93.90 |
97.99 |
94.00 |
88.70 |
97.99 |
96.80 |
|
CNN |
93.30 |
98.08 |
96.00 |
93.90 |
98.08 |
94.30 |
88.90 |
98.08 |
97.50 |
|
DeepNN |
93.40 |
98.18 |
96.20 |
94.00 |
98.18 |
94.50 |
89.20 |
98.18 |
98.10 |
|
WOA DeepNN |
93.80 |
98.28 |
98.90 |
94.20 |
98.28 |
94.50 |
91.30 |
98.28 |
99.00 |
|
POA DeepNN |
92.80 |
98.38 |
99.00 |
94.30 |
98.38 |
94.80 |
91.40 |
98.38 |
99.00 |
|
Proposed |
99.00 |
98.88 |
99.10 |
97.50 |
98.88 |
99.10 |
99.00 |
98.88 |
99.10 |
|
Soya (K-fold) |
|||||||||
|
Accuracy |
Sensitivity |
Specificity |
|||||||
|
Leaf |
Root |
Stem |
Leaf |
Root |
Stem |
Leaf |
Root |
Stem |
|
|
LSTM |
84.70 |
91.60 |
85.80 |
88.50 |
93.80 |
82.70 |
67.60 |
89.30 |
93.50 |
|
ANN |
85.40 |
91.80 |
88.30 |
89.30 |
93.90 |
83.70 |
68.30 |
91.00 |
93.80 |
|
SVC |
85.70 |
93.70 |
90.10 |
93.80 |
93.90 |
84.30 |
68.80 |
92.30 |
93.80 |
|
CNN |
88.00 |
93.80 |
90.20 |
93.90 |
94.00 |
84.60 |
76.50 |
93.70 |
93.80 |
|
DeepNN |
90.80 |
93.80 |
90.40 |
94.00 |
94.30 |
85.40 |
78.00 |
93.80 |
94.00 |
|
WOA DeepNN |
91.20 |
94.60 |
90.80 |
94.00 |
94.30 |
86.40 |
85.70 |
95.10 |
94.00 |
|
POA DeepNN |
94.00 |
94.40 |
93.40 |
94.40 |
94.40 |
93.40 |
93.80 |
95.70 |
94.40 |
|
Proposed |
96.10 |
97.80 |
99.00 |
99.00 |
96.90 |
99.00 |
94.40 |
98.80 |
99.00 |
|
Cotton (Training %) |
|||||||||
|
Accuracy |
Sensitivity |
Specificity |
|||||||
|
Leaf |
Root |
Stem |
Leaf |
Root |
Stem |
Leaf |
Root |
Stem |
|
|
LSTM |
92.50 |
82.30 |
91.30 |
93.20 |
67.00 |
88.00 |
92.10 |
93.90 |
95.30 |
|
ANN |
93.80 |
84.90 |
93.10 |
94.70 |
77.60 |
90.10 |
92.70 |
94.70 |
95.40 |
|
SVC |
95.80 |
85.20 |
95.70 |
95.90 |
78.50 |
93.60 |
93.50 |
94.70 |
96.70 |
|
CNN |
95.80 |
86.40 |
96.40 |
96.90 |
79.50 |
93.80 |
94.50 |
94.80 |
97.30 |
|
DeepNN |
95.80 |
87.10 |
97.40 |
98.00 |
80.70 |
93.90 |
94.80 |
96.90 |
97.80 |
|
WOA DeepNN |
98.10 |
87.30 |
96.10 |
98.80 |
84.00 |
94.00 |
94.90 |
97.10 |
98.40 |
|
POA DeepNN |
99.00 |
87.40 |
99.00 |
99.00 |
84.30 |
94.00 |
95.60 |
97.20 |
99.00 |
|
Proposed |
99.10 |
99.00 |
99.00 |
99.00 |
99.00 |
99.10 |
99.60 |
99.10 |
99.10 |
|
Soya (Training %) |
|||||||||
|
Accuracy |
Sensitivity |
Specificity |
|||||||
|
Leaf |
Root |
Stem |
Leaf |
Root |
Stem |
Leaf |
Root |
Stem |
|
|
LSTM |
81.93 |
88.61 |
86.72 |
88.72 |
83.90 |
85.74 |
75.30 |
93.16 |
87.87 |
|
ANN |
91.56 |
93.16 |
92.82 |
94.47 |
91.13 |
93.22 |
80.08 |
95.37 |
92.61 |
|
SVC |
92.33 |
94.24 |
93.78 |
94.82 |
92.50 |
93.52 |
80.97 |
96.17 |
94.23 |
|
CNN |
93.73 |
95.13 |
94.21 |
96.53 |
93.23 |
93.64 |
83.73 |
97.22 |
94.97 |
|
DeepNN |
93.79 |
95.47 |
95.64 |
97.09 |
93.83 |
94.45 |
84.73 |
97.30 |
96.66 |
|
WOA DeepNN |
94.79 |
95.72 |
97.60 |
98.95 |
94.29 |
94.57 |
85.14 |
97.33 |
97.79 |
|
POA DeepNN |
95.54 |
96.28 |
96.72 |
98.95 |
94.99 |
94.82 |
86.30 |
97.77 |
98.80 |
|
Proposed |
99.10 |
99.10 |
98.95 |
99.10 |
98.95 |
98.93 |
99.55 |
99.10 |
99.10 |
The analysis concerning the convergence of the MPO-adapted deep NN model with other existing approaches is conducted and the attained results are depicted in Figure 21. The error rate of LSTM, ANN, SVC, CNN, Deep NN, WOA deep NN, POA deep NN, and the MPO adapted deep NN at iteration 1 are 0.619,0.610,0.600,0.590,0.581,0.571,0.561,and0.542 respectively, in which the error rate of the MPO adapted deep NN is low when related with the existing approaches. At iteration 20, the techniques such as LSTM, ANN, SVC, CNN, Deep NN, WOA deep NN, POA deep NN, and the MPO adapted deep NN model attained the error values of 0.081, 0.071, 0.061, 0.052, 0.042, 0.032, 0.023, and 0.003 respectively. Similarly, the error rates of the LSTM, ANN, SVC, CNN, Deep NN, WOA deep NN, POA deep NN, and the MPO adapted deep NN model at iteration 40 are 0.080,0.071,0.061,0.051,0.041,0.032,0.022 and 0.003 respectively. At iteration 60, the techniques such as LSTM, ANN, SVC, CNN, Deep NN, WOA deep NN, POA deep NN, and the MPO adapted deep NN model attained the values of 0.080,0.070,0.061,0.051,0.041,0.032,0.022 and 0.003 respectively. Finally at iteration 100, the techniques such as LSTM, ANN, SVC, CNN, Deep NN, WOA deep NN, POA deep NN, and the MPO adapted deep NN model attained the error rates of 0.080, 0.070, 0.061, 0.515, 0.041, 0.032,0.022 and 0.003 respectively, in which the error rate is low for the MPO adapted deep NN model compared with other conventional techniques. Hence, the convergence analysis revealed the developed model attained low error rates that revealed the efficacy of the MPO-adapted deep NN model compared with other existing approaches in plant disease prediction.
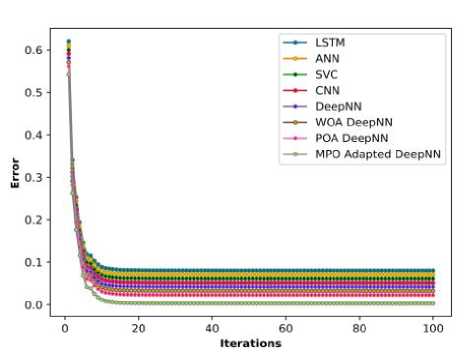
Fig.21. Convergence analysis
The analysis concerning the time complexity of the MPO-adapted deep NN model with other existing approaches is conducted and the results are enumerated in Table 6 and are demonstrated graphically in Figure 22, in which the MPO-adapted deep NN model attained the low computation time at different iterations compared with other conventional techniques. Hence the MPO-adapted deep NN model attained the low time complexity for predicting the plant diseases compared with other preceding techniques.
Table 6. Analysis concerning the Time complexity
|
Methods |
Time (s) |
|||||
|
Iterati on 1 |
Iteratio n 20 |
Iteratio n 40 |
Iteratio n 60 |
Iteratio n 80 |
Iteration 100 |
|
|
LSTM |
0.303 |
0.374 |
0.440 |
0.591 |
0.789 |
0.980 |
|
ANN |
0.284 |
0.354 |
0.421 |
0.572 |
0.770 |
0.961 |
|
SVC |
0.254 |
0.325 |
0.391 |
0.543 |
0.740 |
0.932 |
|
CNN |
0.235 |
0.306 |
0.372 |
0.523 |
0.721 |
0.912 |
|
DeepNN |
0.216 |
0.286 |
0.353 |
0.504 |
0.702 |
0.893 |
|
WOA DeepNN |
0.187 |
0.257 |
0.324 |
0.475 |
0.673 |
0.864 |
|
POA DeepNN |
0.157 |
0.228 |
0.294 |
0.446 |
0.643 |
0.835 |
|
Proposed |
0.060 |
0.131 |
0.197 |
0.349 |
0.546 |
0.738 |
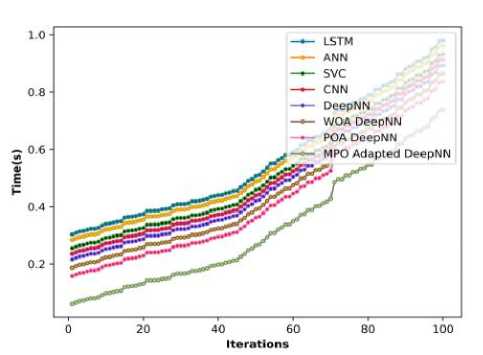
Fig.22. Analysis concerning the Time complexity
-
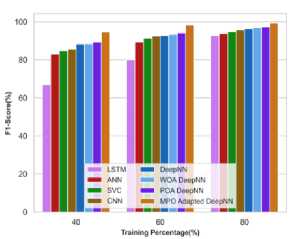
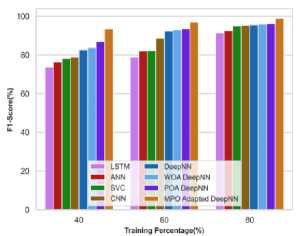
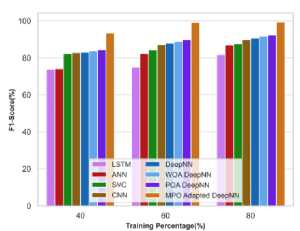
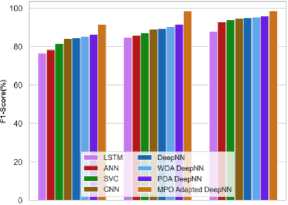
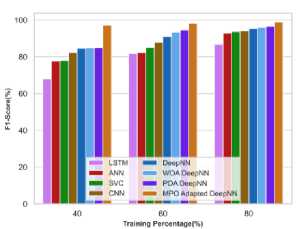
4.10 F1-score analysis
The F1 score analysis is conducted for the MPO Adapted deep NN model in which the F1 scores obtained at different TPs of 40, 60 and 80 are evaluated and depicted in Table 7. The analysis revealed that the MPO-adapted deep NN model attained the maximum values compared to the other existing techniques that demonstrated the efficacy of the MPO-adapted deep NN model.
Table 7. F1 score analysis
|
Methods |
F1 score (%) |
||||||||
|
Cotton leaf |
Cotton root |
Cotton stem |
|||||||
|
TP-40 |
TP-60 |
TP-80 |
TP-40 |
TP-60 |
TP-80 |
TP-40 |
TP-60 |
TP-80 |
|
|
LSTM |
66.93 |
80.07 |
92.70 |
65.63 |
75.59 |
77.95 |
73.69 |
78.96 |
91.39 |
|
ANN |
82.96 |
89.42 |
93.78 |
70.03 |
77.66 |
84.99 |
76.44 |
82.10 |
92.51 |
|
SVC |
84.83 |
91.31 |
94.71 |
71.49 |
83.79 |
85.53 |
78.10 |
82.27 |
94.99 |
|
CNN |
85.58 |
92.50 |
95.71 |
73.76 |
83.98 |
86.16 |
78.95 |
88.57 |
95.35 |
|
Deep NN |
88.31 |
92.73 |
96.41 |
76.14 |
84.54 |
87.71 |
82.66 |
92.32 |
95.61 |
|
WOA DeepNN |
88.42 |
93.31 |
96.84 |
79.08 |
84.64 |
89.75 |
83.78 |
93.13 |
95.94 |
|
POA DeepNN |
89.38 |
94.13 |
97.27 |
80.18 |
85.46 |
89.96 |
86.98 |
93.49 |
96.22 |
|
MPO Adapted DeepNN |
94.58 |
98.28 |
99.25 |
88.62 |
92.15 |
98.58 |
93.45 |
96.92 |
98.91 |
|
Soya leaf |
Soya root |
Soya stem |
|||||||
|
TP-40 |
TP-60 |
TP-80 |
TP-40 |
TP-60 |
TP-80 |
TP-40 |
TP-60 |
TP-80 |
|
|
LSTM |
73.87 |
75.06 |
81.75 |
76.69 |
84.87 |
87.97 |
68.08 |
81.77 |
86.73 |
|
ANN |
74.11 |
82.41 |
86.91 |
78.46 |
85.83 |
92.83 |
77.64 |
82.35 |
92.79 |
|
SVC |
82.37 |
84.35 |
87.57 |
81.57 |
87.08 |
93.91 |
78.00 |
85.08 |
93.73 |
|
CNN |
82.85 |
87.15 |
89.86 |
84.13 |
89.15 |
94.795 |
82.36 |
87.83 |
94.15 |
|
Deep NN |
83.04 |
87.95 |
90.66 |
84.54 |
89.48 |
95.13 |
84.55 |
91.01 |
95.38 |
|
WOA DeepNN |
83.74 |
88.81 |
91.69 |
85.41 |
90.44 |
95.39 |
84.83 |
93.46 |
95.98 |
|
POA DeepNN |
84.45 |
89.85 |
92.35 |
86.48 |
91.62 |
95.95 |
84.98 |
94.68 |
96.59 |
|
MPO Adapted DeepNN |
93.38 |
99.03 |
99.32 |
91.59 |
98.51 |
98.58 |
97.24 |
98.19 |
98.82 |
The F1 score analysis is demonstrated graphically in Figure 23.
a)cotton leaf
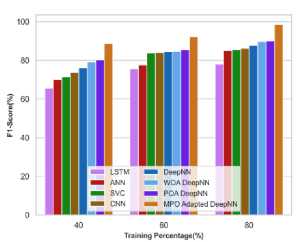
b)cotton root
c)cotton stem
d)Soya leaf
40 60 80
Training Percentage (%)
e)Soya root
f)Soya stem
Fig.23. F1 score analysis
4.11 Statistical analysis
4.12 ROC analysis
5. Conclusion
The statistical analysis is conducted for the MPO-adapted deep NN model along with other existing techniques and evaluated in terms of mean, min, and max for the metrics involving the accuracy, sensitivity, and specificity are
Table 8. Statistical analysis for the MPO-adapted deep NN model
The ROC analysis for the MPO-adapted deep NN model with other existing approaches is conducted and the attained results are depicted in Figure 24. The sensitivity values obtained for the techniques such as LSTM, ANN, SVC, CNN, Deep NN, WOA deep NN, POA deep NN, and the MPO adapted deep NN model at the error value 0.2 is 0.768,0.790,0.806,0.821,0.822,0.825,0.854, and 0.882, in which the MPO adapted deep NN model attained the high sensitivity value of 0.882. At the error value 0.4, the techniques such as LSTM, ANN, SVC, CNN, Deep NN, WOA deep NN, POA deep NN, and the MPO adapted deep NN model attained the values of 0.781,0.799,0.826,0.833,0.835,0.868,0.868,0.890 in which the MPO adapted deep NN model attained the high value of sensitivity. Similarly, at the error value 0.8, techniques such as LSTM, ANN, SVC, CNN, Deep NN, WOA deep NN, poa deep NN, and the MPO adapted deep NN model attained the values of 0.846,0.857,0.869,0.877,0.878,0.913,0.958 and 0.972. Further, techniques such as LSTM, ANN, SVC, CNN, Deep NN, WOA deep NN, POA deep NN, and the MPO adapted deep NN model obtained the values of 0.871,0.893,0.897,0.907,0.927,0.931,0.968,0.988, in which the MPO adapted deep NN model attained the high sensitivity value of 0.988 that shows the superior performance of the proposed model compared with other techniques.
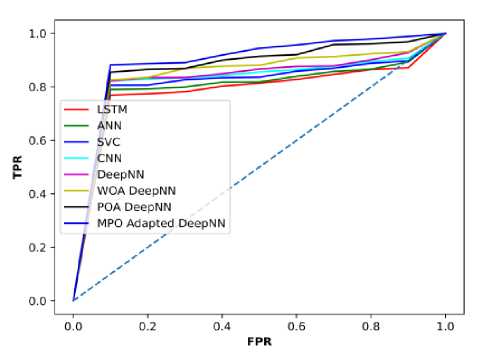
Fig. 24. ROC analysis
Plant disease detection utilizing the MPO-adapted deep NN model is exhibited in this research for disease prediction in plants. The detection of plant disease posse’s significant importance in the agricultural field as well as this crop yield contributes major to the economy of the country. The early prediction helps in minimizing the loss of the crop yield and hence in this research the MPO-adapted NN model is employed for effective disease prediction at an early stage. Utilizing the deep NN classifier assists in learning the intricate pattern, and permitting optimization help in the capable tuning of the classifier, which lowers computing costs and improves convergence. The practical limitation is that utilizing real-time images that are not priorly trained in the model will have some deviation in their accuracy values. The MPO-adapted deep NN model attained the maximum accuracy, sensitivity, and specificity values of 98.95%, 97.45%, and 98.95%, for cotton leaf concerning the k-fold, demonstrating the superiority of the metrics values measurement. When compared to the existing techniques, the MPO-adapted deep NN model obtained the accuracy, sensitivity, and specificity values of 94.47%, 94.58%, and 94.54%, for cotton root, and 99.10%, 99.10%, 99.10%, for cotton stem, respectively concerning the k-fold. In the future, the research could be extended utilizing other hybrid DL classifiers and the remedies for the disease will also be provided along with the detection.
References Modified Political Optimization Algorithm Adapted Deep Neural Networks for Early Plant Disease Detection
- A. Umamageswari, N. Bharathiraja, and D.S. Irene. “A novel fuzzy C-means based chameleon swarm algorithm for segmentation and progressive neural architecture search for plant disease classification,” ICT Express, 9(2), pp.160-167, 2023.
- Food Safety, “https://www.who.int/news-room/fact-sheets/detail/food-safety”, accessed on May 2022.
- M. Ahmad, M. Abdullah, H. Moon, and D. Han. "Plant disease detection in imbalanced datasets using efficient convolutional neural networks with stepwise transfer learning", IEEE Access, vol.9, pp.140565-140580, 2021.
- D. Shah, V. Trivedi, V. Sheth, A. Shah, and U. Chauhan. "ResTS: Residual deep interpretable architecture for plant disease detection", Information Processing in Agriculture, 2021.
- M.A. Altieri. "Agroecology: the science of sustainable agriculture", CRC Press, 2018.
- M. Mishra, P. Choudhury, and B. Pati. "Modified ride-NN optimizer for the IoT based plant disease detection", Journal of Ambient Intelligence and Humanized Computing, vol.12, no.1, pp.691-703, 2021.
- I. Mat, M.R.M. Kassim, A.N. Harun, and I.M. Yusoff. "IoT in precision agriculture applications using wireless moisture sensor network", In proceedings of 2016 IEEE Conference on Open Systems (ICOS), pp. 24-29, 2016.
- Z. Pang, Q. Chen, W. Han, and L. Zheng. "Value-centric design of the internet-of-things solution for food supply chain: Value creation, sensor portfolio and information fusion", Information Systems Frontiers, vol.17, no.2, pp.289-319, 2015.
- M. Arsenovic, M. Karanovic, S. Sladojevic, A. Anderla, and D. Stefanovic. "Solving current limitations of DL based approaches for plant disease detection", Symmetry, vol.11, no.7, pp.939, 2019.
- S. Mirjalili, and A. Lewis. "The whale optimization algorithm". Advances in engineering software, vol.95, pp.51-67, 2016.
- Q. Askari, I. Younas, and M. Saeed, "Political Optimizer: A novel socio-inspired meta-heuristic for global optimization", Knowledge-Based Systems, vol.195, pp.105709, 2020.
- P. Bedi, and P. Gole. "Plant disease detection using hybrid model based on convolutional autoencoder and convolutional neural network", Artificial Intelligence in Agriculture, vol.5, pp.90-101, 2021.
- M. Turkoglu, B. Yanikoğlu, and D. Hanbay, "PlantDiseaseNet: Convolutional neural network ensemble for plant disease and pest detection", Signal, Image and Video Processing, vol.16, no.2, pp.301-309, 2022.
- A.H. Elsheikh, A.E. Mohamed, R.D. Sudhansu, T. Muthuramalingam, and L. Songfeng. "A new optimized predictive model based on political optimizer for eco-friendly MQL-turning of AISI 4340 alloy with nano-lubricants," Journal of Manufacturing Processes, vol. 67, pp. 562-578, 2021.
- S. Chakraborty, A.K. Saha, S. Sharma, S. Mirjalili, and R. Chakraborty. "A novel enhanced whale optimization algorithm for global optimization," Computers & Industrial Engineering, vol. 153, no.107086, 2021.
- B.V. Patil, and P.S. Patil. "Computational method for Cotton Plant disease detection of crop management using DL and internet of things platforms", In Evolutionary Computing and Mobile Sustainable Networks, pp. 875-885, 2021.
- S. Ashwinkumar, S. Rajagopal, V. Manimaran, and B. Jegajothi. "Automated plant leaf disease detection and classification using optimal MobileNet based convolutional neural networks." Materials Today: Proceedings 51: 480-487, 2022.
- R. Dwivedi, S. Dey, C. Chakraborty, and S. Tiwari. "Grape disease detection network based on multi-task learning and attention features", IEEE Sensors Journal, vol.21, no.16, pp.17573-17580, 2021.
- R. Bora, D. Parasar, S, Charhate. “A detection of tomato plant diseases using DL MNDLNN classifier,” SIVP (2023), https://doi.org/10.1007/s11760-023-02498-y.
- M. Jalayer, C. Orsenigo, and C. Vercellis, "Fault detection and diagnosis for rotating machinery: A model based on convolutional LSTM, Fast Fourier and continuous wavelet transforms." Computers in Industry 125: 103378, 2021.
- Y. Li, M. Jia, X. Han, and X.S. Bai, "Towards a comprehensive optimization of engine efficiency and emissions by coupling artificial neural network (ANN) with genetic algorithm (GA) ". Energy 225, p.120331, 2021.
- Z.A.A. Hammouri, M.F. Delgado, E. Cernadas, and S. Barro. “Fast SVC for large-scale classification problems.” IEEE Transactions on Pattern Analysis & Machine Intelligence, (01), pp.1-1, 2021.
- T. Kattenborn, J. Leitloff, F. Schiefer, and S. Hinz, “Review on Convolutional Neural Networks (CNN) in vegetation remote sensing.” ISPRS journal of photogrammetry and remote sensing, 173, pp.24-49, 2021.
- J. Jiang, M. Chen, and J.A. Fan. “Deep neural networks for the evaluation and design of photonic devices.” Nature Reviews Materials, 6(8), pp.679-700, 2021.
- A. Brodzicki, M. Piekarski, and J. Jaworek-Korjakowska. “The whale optimization algorithm approach for deep neural networks.” Sensors, 21(23), p.8003, 2021.
- S.A. Shehu, A.D. Mohammed, and I.M. Abdullahi. “An Optimized Customers Sentiment Analysis Model Using Pastoralist Optimization Algorithm (POA) and Deep Learning.” In 2snip020 IEEE 2nd International Conference on Cyberspac (CYBER NIGERIA), pp. 132-139, 2021.
- R. Bora, D. Parasar and S. Charhate, “Identification of Tomato Leaf Disease Using DL Model,” AIP Conf. Proc. 2755, 020016-1–020016-7; https://doi.org/10.1063/5.0148355
- R. Bora, D. Parasar and S. Charhate, "Plant Leaf Disease Detection using DL: A Review," 2022 IEEE 7th International conference for Convergence in Technology (I2CT), pp. 1-6, Mumbai, India, 2022, doi: 10.1109/I2CT54291.2022.9824925.
