Mongolian coal industry exploration and recent situation

Free access
In this paper, i try to study coal exploration in domestic and international market and their future trend compired with other producers. Mongolia produced 1.22% and exported 5.7% from the total coal production in the Asian Pacific by the 2011. By the way Mongolian coal exploration amount increased 30% or reached 32.9 million tonnes. The our domestic demand just rised in that time. In the 2009, the coal exploration sharp increased by 128.9% and it excessed from the rate of GDP and Mining&Quarring. But it became 0.6% growth share in the GDP. Maybe, it is related on world economic crisis and market pricedown. The industrial total production value rate has fluctuation recent years. Therefore, the international market supply and demand, and world market price influenced on the GDP value, just related on mining production.
Coal deposit, coal exploration, coal consumption, exploration permission- special permission
Short address: https://sciup.org/148317652
IDR: 148317652 | UDC: 338.45(517.3)
Text of the scientific article Mongolian coal industry exploration and recent situation
|
year region |
о |
8 |
8 |
8 |
О 8 |
8 |
О 8 |
о |
8 |
8 |
Absolute average net growth of production, mil.tn |
|
Europe&Euro-Asia |
rq 9 |
oq 04 |
40 |
oq |
OO |
oq 04 |
04 40 |
40 40 9 |
9 |
||
|
Asia- Pacific |
n ОО ri |
OO s |
$ |
40 04 oo |
40 40 04 |
S |
oq 0-1 |
Я |
ri 04 ri |
40 OO 40 ri |
40 |
|
North America |
04 40 |
04 OO |
40 |
40 |
40 |
04 O1 40 |
to |
oo |
ri 04 |
o "О |
|
|
Middle East &Africa |
04 |
OO |
9 |
9 |
9 |
9 |
9 |
ri |
|||
|
South and central America |
04 |
04 04 |
о |
40 |
n |
40 |
■о |
tn |
n |
°? 9 |
The Absolute average net growth of production is highest in the Asia-Pacific. The total coal production of Asia-Pacific is shown in the table 2.
From this table Republic of China is the biggest producers by 73%. Second one is Australia by 8.6%. I calculated production growth rate using data of appendix.2 by (1) formula and indicated in the table 2.
growth rate=(y n -y n-1 )*100/y n-1
table. 2
The coal exploration growth rate, % (at 2002 constant prices)
|
year Counttry |
2003 |
2004 |
2005 |
2006 |
2007 |
2008 |
2009 |
2010 |
2011 |
|
Australia |
2.8 |
6.8 |
11.6 |
14.4 |
17.8 |
21.6 |
25.9 |
28.1 |
25.2 |
|
Russian Federation |
8.4 |
12.3 |
18.7 |
23.7 |
26.2 |
30.8 |
21.1 |
28.8 |
34.1 |
|
Indonesia |
10.7 |
28.2 |
47.9 |
87.7 |
110.1 |
132.8 |
148.2 |
166.5 |
214.6 |
|
India |
4.3 |
12.4 |
17.0 |
22.9 |
30.7 |
41.2 |
52.2 |
57.0 |
60.6 |
|
Thailand |
-7.0 |
-1.8 |
1.8 |
-7.0 |
-10.5 |
-12.3 |
-12.3 |
-10.5 |
5.3 |
|
China |
18.7 |
37.5 |
52.5 |
64.7 |
75.8 |
82.4 |
93.5 |
110.6 |
129.1 |
|
Vietnam |
17.4 |
59.8 |
98.9 |
137.0 |
143.5 |
150.0 |
173.9 |
167.4 |
170.7 |
|
Japan |
-12.5 |
-12.5 |
-25.0 |
-12.5 |
0.0 |
-12.5 |
-12.5 |
-37.5 |
-12.5 |
|
Republic of Korea |
0.0 |
-6.7 |
-13.3 |
-13.3 |
-13.3 |
-20.0 |
-26.7 |
-40.0 |
-40.0 |
|
New Zealand |
14.3 |
17.9 |
17.9 |
28.6 |
7.1 |
7.1 |
0.0 |
17.9 |
10.7 |
|
Pakistan |
-6.3 |
-6.3 |
0.0 |
6.2 |
0.0 |
12.5 |
0.0 |
-6.3 |
-12.5 |
|
Mongolia |
1.8 |
25.5 |
36.4 |
45.5 |
67.3 |
81.8 |
161.8 |
358.2 |
481.8 |
|
Other Asian countries |
8.8 |
12.8 |
18.0 |
23.7 |
29.0 |
33.5 |
24.0 |
35.4 |
44.2 |
|
Asia- Pacific |
14.0 |
29.4 |
42.0 |
53.5 |
63.2 |
70.5 |
80.9 |
94.6 |
109.7 |
The Australian coal production growth is decreased from the 2010 because of force major. The Mongolia became beginner of the coal production growth rate in the 2011, at 2002 constant prices. Second one is Indonesia and third one is Vietnam.
The Republic of China is a beginner of coal consumption. After that the coal consumption is a high in the India and Japan. I calculated production growth rate using data of appendix.2 by (1) formula and demonstrated in the table 3.
table.3
Total consumption growth rate,%(at 2002 constant prices)
|
2003 |
2004 |
2005 |
2006 |
2007 |
2008 |
2009 |
2010 |
2011 |
|
|
Australia |
-3.3 |
-0.6 |
4.7 |
9.6 |
5.9 |
6.8 |
6.7 |
-14.3 |
-2.5 |
|
Russian Federation |
1.0 |
-3.4 |
-8.5 |
-6.1 |
-9.3 |
-2.5 |
-10.8 |
-12.4 |
-11.7 |
|
Bangladesh |
0 |
0 |
0 |
25.0 |
0.0 |
50.0 |
50.0 |
125.0 |
150.0 |
|
Indonesia |
34.4 |
23.3 |
41.1 |
67.2 |
110.0 |
67.2 |
92.2 |
128.9 |
144.4 |
|
India |
3.3 |
13.5 |
21.5 |
28.7 |
38.5 |
51.8 |
67.2 |
78.4 |
94.7 |
|
Thailand |
2.2 |
13.0 |
21.7 |
34.8 |
53.3 |
66.3 |
57.6 |
66.3 |
51.1 |
|
China |
18.4 |
40.1 |
56.0 |
73.3 |
83.1 |
89.5 |
107.7 |
120.4 |
141.9 |
|
Vietnam |
3.8 |
54.7 |
50.9 |
79.2 |
90.6 |
88.7 |
164.2 |
162.3 |
183.0 |
|
Japan |
5.3 |
13.3 |
13.8 |
11.7 |
17.5 |
20.7 |
2.1 |
16.0 |
10.4 |
|
Republic of Korea |
4.1 |
8.1 |
11.6 |
11.6 |
21.6 |
34.6 |
39.7 |
54.6 |
61.7 |
|
New Zealand |
42.9 |
50.0 |
64.3 |
57.1 |
21.4 |
50.0 |
14.3 |
0.0 |
0.0 |
|
Pakistan |
20.8 |
58.3 |
70.8 |
75.0 |
112.5 |
120.8 |
95.8 |
87.5 |
75.0 |
|
Hong-Kong |
22.2 |
22.2 |
24.1 |
29.6 |
38.9 |
29.6 |
40.7 |
16.7 |
42.6 |
|
Mongolia |
-5.5 |
-5.5 |
5.5 |
3.6 |
20.0 |
5.5 |
16.4 |
25.5 |
23.6 |
|
other Asian countries |
8.9 |
14.8 |
21.9 |
26.0 |
27.5 |
30.8 |
28.6 |
36.4 |
36.5 |
|
Asia-Pacific |
13.4 |
29.7 |
41.7 |
54.2 |
63.3 |
69.4 |
81.7 |
92.9 |
109.2 |
We can see that total coal consumption did not change because of the consumption decreased one side but increased another side.
The major exporters are Australia, Indonesia, India, Mongolia and Vietnam in the Asia-Pacific. The major importers are China, Japan, North Korea, Malasiya, Thailand and Philippines.
In the coal trade, the brown coal is 6.8 billion tonn, the coking coal is 2.7 billion tonn from the total export by 2010. The brown coal export is more than coking coal or 32%-40% above the coking coal export in the last few years.
The Indonesia became the biggest brown coal exporter. The Australia occupied 21% of brown coal export and 54% of coking coal export.
The market price is declined from 2005. It is respected or indentified world economic crisis. In my view. the world market price is rised again in the 2007 because of a coal is a primary energy deposit and cheap. Therefore, it is not lose its worth.
-
III. THE PRODUCERS AND CONSUMERS TREND IN THE DOMESTIC MARKET
Our coal geology deposit is estimated 163,2 billion tonn[5] and it is possible to rise. The coal deposit predicted and surveyed is around 20 billion tonn[6].(15 basin and 300 fields) Then we became one of the biggest coal deposit owner or Mongolia included in begining 10 coal deposit owner country. The coal is Mongolian majority energy source and aslo it will be kept out further.
We have divided our land into five region such as Central, “Khangai”, “Gobi”, “Western” and “Eastern” in the Mongolian regional development program[7]. In the western region has maximum fields which has 23 fields but the coal deposit amount is maximum in the eastern region[8].
In the Mongolian Congress resolution 2007 № 27 proved “About to consists into strategic field of mineral”[13] rule. From total 15 fields, it has 4 coal oriented fields: Tavantolgoi, Nariinsukhait, Baganuur and Shivee-Ovoo.
The 5 coal stock companies registered in the Mongolian Stock agency by 2009. It is increased in the 2011 and reached 8. [14] (Shivee-Ovoo, Baganuur, Tavantol-goi, Baynteeg, Mogoin-gol, Nako tulsh, Shariin gol, Taliin gal) It has been given 208 exploration licenses since 1992. Its pick period was a 2006. Exploration license owner research is illustrated in the graphic 4 and table 4.
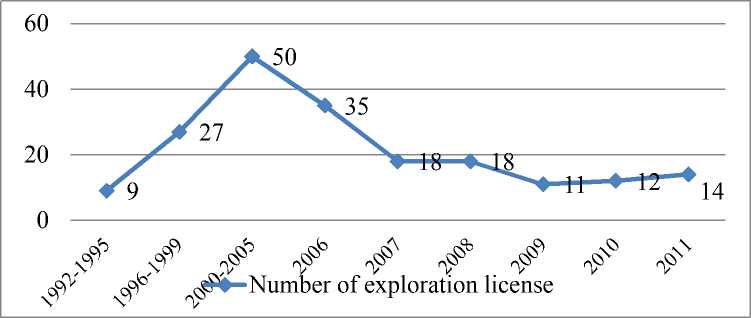
graphic 4. The number of exploration licenses dynamic in the coal industry sector [11] 4
table. 4
The exploration licence, number of exploration lisence owner(2011 оны байдлаар)
|
number of exploration license |
number of exploration lecense owner |
The share of total |
|
1 |
116 |
81.1 |
|
2 |
15 |
10.5 |
|
3 |
5 |
3.5 |
|
4 |
4 |
2.80 |
|
8 |
1 |
0.70 |
|
10 |
1 |
0.70 |
|
12 |
1 |
0.70 |
|
Total 208 |
Total 143 |
100% |
From this table, There are 17 new companies and 6 old companies from the new registered exploration license companies by the last two years. The biggest exploration license owners are Mongolian gold(MAK) LLC, Erdenes-tavantolgoi LLC and MoEnKo LLC. The license exploration transition is demonstrated in the figure 5.
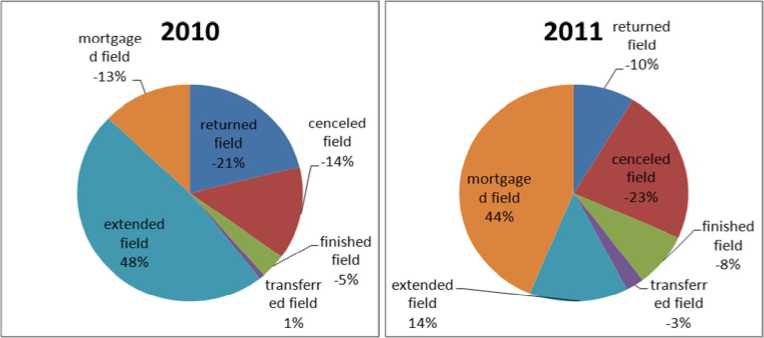
graphic 5. The exlporation license transition[12]
From this figure, the cancelled and extended fields are decreased and mortgage field is increased so much.
The gold exploration special permission is 1192 or biggest but the coal exploration area is 682.7 thousand hectare or 47.6% share of exploration special permission.
The Mongolian Mineral Resource Authority made many things that arrangement to giving process of mineral special permission and according to implement rule. From this result the number growth of the special permission, reduced by 100%. in between 2010-2011. But it raised up by 79.6% in between 2011-2012.
In the 2012, the operation lisence is increased 24.1% and the number of companies are increased 22.1% compired with 2008 data. Every year, the operation lisence number is increased by average 13[13]. We have 157 coal mining companies, in which 16 Stock company and 141 Limited Liability Companies. In the Mongolian stock market registered total 54 mining company, from this 5 Stock companies are goverment responsibillity.[14] (Shivee ovoo Stock company, Baganuur Stock company, Tavantolgoi Stock company, Baynteeg Stock company, Mogoin gol Stock company)
-
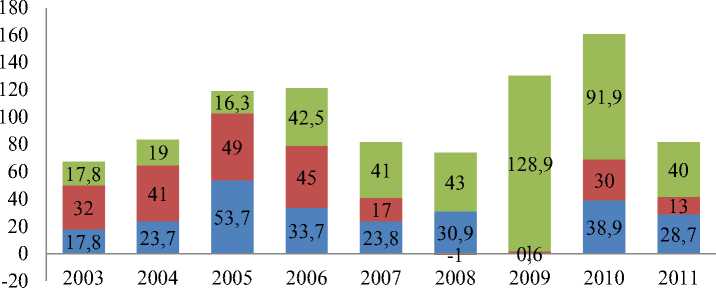
■ GDP growth rate
-
■ Coal exploration growth rate
-
■ Mining &quirring growth rate
graphic 1. The Coal exploration growth rate dynamic [15]
-
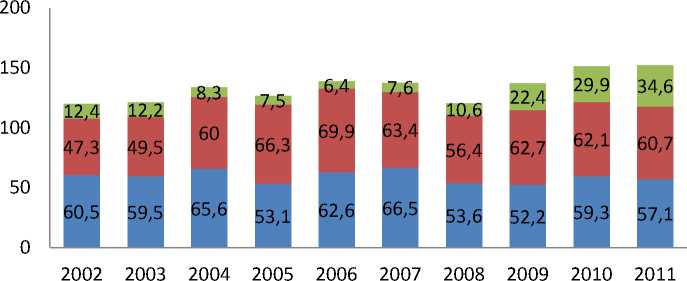
■ Coal exploration share in the Mining&Quirring
-
■ Mining&Quirring share in the Industrial total production
-
■ Idustrial total production share in the GDP
graphic 2. The Coal exploration value share in the Mining &Q uirring,%(2011) [16]
The coal research department of the Mineral Deposit Authority classified to the coal exploration company by their operation goal that assumed energetic, territority and export oriented companies.
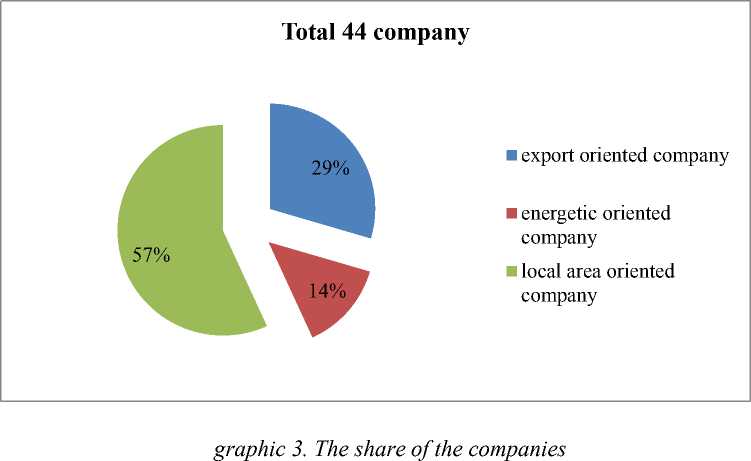
Although, Local area oriented companies are 57% share of total, their exploration is less than export orinted companies. Another word their performance is very low.
table. 6
Mongolian exploration and consumption growth rate, % (at 2002 constant prices)
|
year growth rate |
2003 |
2004 |
2005 |
2006 |
2007 |
2008 |
2009 |
2010 |
2011 |
|
exploration growth rate |
1.8 |
25.5 |
36.4 |
45.5 |
67.3 |
81.8 |
161.8 |
358.2 |
481.8 |
|
consumption growth rate |
-5.5 |
-5.5 |
5.5 |
3.6 |
20.0 |
5.5 |
16.4 |
25.5 |
23.6 |
From above table we can see that the exploration rate increased 20(at 2002 constant prices) times from the consumption growth rate. According to predict absolute net growth rate trend level, we will use (2) formula. It can demonstrated in the table 7.
y 2= y 1+ д, y 3= y 1+ 2Д, y 4= y 1+ ЗД, y n= y 1+ (п-1)Д (2)
table.7
д
|
year country |
2012 |
2013 |
2014 |
2015 |
2016 |
2017 |
2018 |
2019 |
2020 |
|
Australia |
236.0 |
241.1 |
246.3 |
251.5 |
256.6 |
261.8 |
267.0 |
272.1 |
277.3 |
|
Russian federation |
161.7 |
166.2 |
170.6 |
175.1 |
179.5 |
184.0 |
188.4 |
192.9 |
197.3 |
|
Indonesia |
214.9 |
230.1 |
245.2 |
260.4 |
275.5 |
290.7 |
305.8 |
321.0 |
336.1 |
|
India |
231.7 |
241.0 |
250.4 |
259.7 |
269.0 |
278.3 |
287.7 |
297.0 |
306.3 |
|
Thailand |
6.0 |
6.1 |
6.1 |
6.1 |
6.2 |
6.2 |
6.2 |
6.3 |
6.3 |
|
Republic of China |
2078.5 |
2200.9 |
2323.4 |
2445.9 |
2568.3 |
2690.8 |
2813.3 |
2935.7 |
3058.2 |
|
Vietnam |
26.6 |
28.4 |
30.1 |
31.9 |
33.6 |
35.4 |
37.1 |
38.9 |
40.6 |
|
Japan |
0.7 |
0.7 |
0.7 |
0.656 |
0.6 |
0.6 |
0.6 |
0.6 |
0.6 |
|
Republic of Korea |
0.8 |
0.8 |
0.7 |
0.6 |
0.6 |
0.5 |
0.4 |
0.4 |
0.3 |
|
New Zealand |
3.1 |
3.2 |
3.2 |
3.2 |
3.3 |
3.3 |
3.3 |
3.4 |
3.4 |
|
Pakistan |
1.4 |
1.4 |
1.3 |
1.3 |
1.3 |
1.3 |
1.2 |
1.2 |
1.2 |
|
Mongolia |
34.9 |
37.9 |
40.8 |
43.8 |
46.7 |
49.7 |
52.6 |
55.6 |
58.5 |
|
Other Asian countries |
-154.1 |
-159.2 |
-164.2 |
-169.3 |
-174.4 |
-179.467 |
-184.5 |
-189.6 |
-194.7 |
|
Asia- Pacific |
2842.4 |
2998.5 |
3154.7 |
3310.8 |
3466.9 |
3623.0 |
3779.2 |
3935.3 |
4091.4 |
If coal exploration growth rate is constant, it will be 4.91 billion tonn in the 2020.
table.8
|
year country |
2012 |
2013 |
2014 |
2015 |
2016 |
2017 |
2018 |
2019 |
2020 |
|
Australia |
49.7 |
49.5 |
49.4 |
49.2 |
49.1 |
48.9 |
48.8 |
48.6 |
48.5 |
|
Russian federation |
89.6 |
88.2 |
86.9 |
85.5 |
84.2 |
82.8 |
81.5 |
80.1 |
78.8 |
|
Bangladesh |
1.1 |
1.1 |
1.2 |
1.27 |
1.3 |
1.4 |
1.5 |
1.5 |
1.6 |
|
Indonesia |
46.9 |
49.8 |
52.7 |
55.6 |
58.4 |
61.3 |
64.2 |
67.1 |
70 |
|
India |
311.6 |
327.56 |
343.5 |
359.51 |
375.5 |
391.5 |
407.4 |
423.4 |
439.4 |
|
Thailand |
14.4 |
14.944 |
15.5 |
16.0 |
16.5 |
17.0 |
17.6 |
18.1 |
18.6 |
|
Republic of China |
1959.3 |
2079.2 |
2199.1 |
2319 |
2438.8 |
2559 |
2679 |
2799 |
2918.4 |
|
Vietnam |
16.1 |
17.2 |
18.2 |
19.3 |
20.4 |
21.5 |
22.5 |
23.6 |
24.7 |
|
Japan |
118.9 |
120.17 |
121.4 |
122.63 |
123.9 |
125.1 |
126.3 |
127.6 |
128.8 |
|
Republic of Korea |
82.8 |
86.1 |
89.5 |
92.867 |
96.2 |
99.6 |
103.0 |
106.3 |
109.7 |
|
New Zealand |
1.4 |
1.4 |
1.4 |
1.4 |
1.4 |
1.4 |
1.4 |
1.4 |
1.4 |
|
Pakistan |
4.4 |
4.6 |
4.8 |
5 |
5.2 |
5.4 |
5.6 |
5.8 |
6 |
|
Hong-Kong |
8.0 |
8.2 |
8.5 |
8.7 |
9.0 |
9.2 |
9.5 |
9.7 |
10 |
|
Mongolia |
6.9 |
7.1 |
7.2 |
7.4 |
7.5 |
7.7 |
7.8 |
8.0 |
8.1 |
|
other Asian countries |
75.8 |
78.0 |
80.2 |
82.4 |
84.5 |
86.7 |
88.9 |
91.1 |
93.3 |
|
Asia-Pacific |
2701.3 |
2849.4 |
2997.4 |
3145.5 |
3293.6 |
3441.7 |
3590 |
3738 |
3885.9 |
The first one is Republic of China. After that India, Indonesia, etc., If coal consumption growth rate is constant, it will be 3.885 million tonn in the 2020.
The Glogex LLC predicted coal exploration and its revenue.(table.5 )
table. 5
Mongolian coal exploration trend coal exlporation, growth rate low, million. Tonn coal exlporation, growth rate high, million. tonn
201337.9
201440.8
201543.8
source: Гложекс LLC
CONCLUSION
The coal exploration is rised in the Indonesia, India, Thailand, Republic of China, Japan and Mongolia and the coal consumption is rised all Asia-Pacific region despite of Thailand and Japan in between 2010-2011.
The coal demand will rise future in the world because of every countries are refused nuclear energy. The China is a biggest explorer and also consumer. Mongolian advantage is a location, which is very close to the china. Also Mongolian coking coal deposit .
My prediction is the low than Glogex LLC (coal exlporation, growth rate low, million. tonn). For this moment, Mongolia can export 30 million tonn coal, if there is no any force major and growth rate is constant.
The World Energy forum made work plan 2012-2014, in which emphasized on activity to move into less evolve hydrocarbon which be less harm in the ecology and environment or low-carbon coal consumption. Therefore, consumers trend will change and it is necessity to improve coal producing technology and need to produce value added production.
APPENDIX
-
2. Total consumption of Asia-Pacific, million.tn
year
country
2002
2003
2004
2005
2006
2007
2008
2009
2010
2011
2011 share of total
Australia
51.1
49.4
50.8
53.5
56
54.1
54.6
54.5
43.8
49.8
1.95
Russian federation
103
104
99.5
94.2
96.7
93.4
100.4
91.9
90.2
90.9
Banglades h
0.4
0.4
0.4
0.4
0.5
0.4
0.6
0.6
0.9
1
0.039
Indonesia
18
24.2
22.2
25.4
30.1
37.8
30.1
34.6
41.2
44
1.723
India
151.8
156.8
172.3
184.4
195.4
210.3
230.4
253.8
270.8
295.6
11.58
Thailand
9.2
9.4
10.4
11.2
12.4
14.1
15.3
14.5
15.3
13.9
0.544
Republic of China
760.4
900.2
1065.6
1186.2
1317.7
1392.5
1441.1
1579.5
1676.2
1839.4
72.04
Vietnam
5.3
5.5
8.2
8
9.5
10.1
10
14
13.9
15
0.587
Japan
106.6
112.2
120.8
121.3
119.1
125.3
128.7
108.8
123.7
117.7
4.61
Republic of Korea
49.1
51.1
53.1
54.8
54.8
59.7
66.1
68.6
75.9
79.4
3.11
New
Zealand
1.4
2
2.1
2.3
2.2
1.7
2.1
1.6
1.4
1.4
0.055
Pakistan
2.4
2.9
3.8
4.1
4.2
5.1
5.3
4.7
4.5
4.2
0.164
HongKong
5.4
6.6
6.6
6.7
7
7.5
7
7.6
6.3
7.7
0.302
Mongolia
5.5
5.2
5.2
5.8
5.7
6.6
5.8
6.4
6.9
6.8
0.266
other
Asian
53.9
58.7
61.9
65.7
67.9
68.7
70.5
69.3
73.5
73.6
2.883
countries Asia-Pacific
1220.5
1384.6
1583.4
1729.5
1882.5
1993.2
2067.6
2217.8
2354.4
2553.2
100
source: BP Statistical Review of World Energy full report 2012
References Mongolian coal industry exploration and recent situation
- Asia-Pacific center for security studies. www.apcss.org/about_2/ap_countries/
- [4 ]IEA, "Coal Information (2011 edition) www.iea.org [3] BP Statistical Review of World Energy full report 2012. http://www.bp.com/assets/bp_internet/globalbp/globalbp_uk_english/reports_and_ publications/s tatistical_energy_review_2011/STAGING/local_assets/pdf/statistical_review_of_w orld_energy_ full_report_2012.pdf
- Goverment Implementing Agency. Mineral Resource Authority. Coal Research Department. www.mram.gov.mn Ser-Od Burmaa. Mongolian coal industry exploration and recent situation
- Goverment Implementing Agency. Mineral Resource Authority. Coal Research Department. Mongolian coal industrial recent situation and trend 2012.
- Монгол улсын их хурлын тогтоол. Монгол улсын бүсүүдийн хөгжлийн дунд хугацааны стратеги батлах тухай. 2003.
