Monkeypox Detection Using Support Vector Machine with a Quadratic Polynomial Kernel

Автор: Michael Chi Seng Tang, Siew Ping Yiiong, Kee Chuong Ting, Sing Ling Ong, Marcella Peter, Khairunnisa Ibrahim
Журнал: International Journal of Engineering and Manufacturing @ijem
Статья в выпуске: 5 vol.15, 2025 года.
Бесплатный доступ
This study looks at how well a Support Vector Machine (SVM) with a quadratic polynomial kernel works for detecting Monkeypox. The SVM method is compared to other machine learning models like Neural Networks, KNN, Logistic Regression, Random Forest, Decision Tree, and Naïve Bayes. By using features from medical images called Local Binary Patterns (LBP), the SVM model showed the best results, with 93.33% accuracy, 95.24% recall, 91.67% true negative rate, and 90.91% precision. The LBP features are used because they exhibit unique textural patterns that can distinguish Monkeypox and normal cases. The results show that the SVM with this kernel is good at telling the difference between Monkeypox and normal cases, making it a helpful tool for early detection in healthcare.
Quadratic Polynomial Kernel, Support Vector Machine, Machine Learning, Local Binary Pattern Features, Medical Imaging
Короткий адрес: https://sciup.org/15019957
IDR: 15019957 | DOI: 10.5815/ijem.2025.05.05
Текст научной статьи Monkeypox Detection Using Support Vector Machine with a Quadratic Polynomial Kernel
In recent years, the world’s healthcare system has changed a lot because of big health problems like COVID-19 and new diseases like Monkeypox. These events have shown how important it is to find diseases quickly and accurately to reduce their effects. As technology gets better, machines that can learn on their own, called machine learning, are being used more in healthcare. These machines can look at medical pictures very closely and help doctors find diseases early. For example, ML has been used to spot Monkeypox, a virus that has spread quickly and worried many people. Besides, it has also been used in other fields and showed great success [1, 2, 3, 4].
Studies have looked at different ways to use machine learning to find Monkeypox. Some methods use deep learning models to study pictures of skin and can tell the disease apart with high accuracy. Other methods combine deep learning with regular machine learning techniques to make diagnoses even more accurate. This shows how new technology and medical knowledge can work together to make systems that find diseases early.
Even though there has been a lot of progress, some methods haven’t been looked at much yet, like using SVMs with a quadratic polynomial kernel for detecting Monkeypox. This creates a research gap because the kernel has not been extensively tested for Monkeypox detection to the best of our knowledge. This method can help the machine understand complicated patterns in pictures, possibly making the detection more accurate. The research will test an SVM model with the quadratic polynomial kernel for detecting Monkeypox and compare it with other common machine learning models like neural networks, K-Nearest Neighbors (KNN), and random forests. The study will also use a method called LBP to see if SVM can give good results when looking for Monkeypox.
By using a dataset that is open to the public and comparing SVM with other popular models, the study hopes to find useful information about how SVM with the suggested kernel can help detect diseases. The results could make it easier for healthcare workers to diagnose diseases and manage outbreaks, helping them make faster and more reliable decisions in hospitals.
2. Related Works
Azar et al. [5] discussed the atypical Monkeypox epidemic that was announced by the World Health Organization in May 2022, which raised concerns about the global spread of the disease. This followed the increased awareness about pandemics, particularly after the COVID-19 crisis. The study utilized Deep Neural Networks to detect and predict the outcomes of COVID-19, which led researchers to explore similar methods for detecting Monkeypox. In their study, they used a dataset of skin images of Monkeypox, Chickenpox, Measles, and normal cases to develop seven DNN models aimed at detecting Monkeypox. They tested the models in two scenarios: one with two classes and another with four classes. The results showed that their DenseNet201-based architecture achieved the highest performance with an accuracy of 97.63%, F1-Score of 90.51%, and Area Under Curve of 94.27% in the two-class scenario, and accuracy of 95.18%, F1-Score of 89.61%, and AUC of 92.06% in the four-class scenario. The study also used Local Interpretable Model-Agnostic Explanations and Gradient-weighted Class Activation Mapping (Grad-CAM) techniques to interpret the results, enhancing the model’s transparency and the trust of clinicians. The DenseNet201 model outperformed others, and the use of LIME and Grad-CAM contributed significantly to understanding the affected areas in diagnosing Monkeypox.
Saleh et al. [6] explored a new strategy for early Monkeypox detection, named the Human Monkeypox Detection (HMD) strategy, which consists of two phases: Selection Phase (SP) and Detection Phase (DP). The SP uses an Improved Binary Chimp Optimization (IBCO) algorithm for feature selection, while the DP utilizes an Ensemble Diagnosis (ED) model for accurate diagnosis. The IBCO algorithm combines filter and wrapper methods to select relevant features from the dataset. The ED model integrates three diagnostic algorithms: Weighted Naïve Bayes (WNB), Weighted K-Nearest Neighbors (WKNN), and deep learning, which are combined using a weighted voting method. The experimental results showed that the IBCO algorithm outperformed other feature selection methods, and the ED model exceeded the performance of modern diagnostic models. The HMD strategy achieved an accuracy of 98.48%, precision of 91.1%, and recall of 88.91%, outperforming other contemporary strategies.
Huong et al. [7] emphasized the importance of early detection and diagnosis of Monkeypox for minimizing its impact on public health. This study combined deep learning models such as ResNet-50, VGG16, and MobileNet with machine learning models like Random Forest Classifier, K-Nearest Neighbors Classifier, Gaussian Naive Bayes Classifier, and others, to classify and detect Monkeypox. The dataset used consisted of 659 subjects with varying severity of skin lesions. The results demonstrated that combining deep learning and machine learning models led to an accuracy of 97% and an F1-score of 98%, highlighting the effectiveness of this hybrid approach.
Hapsari et al. [8] focused on a predictive study of Monkeypox using the Random Forest algorithm, optimized with Particle Swarm Optimization (PRFO). This method was tested on three datasets: the Monkeypox dataset (25,000 data points), the Health dataset (20,000 data points), and the PulsarStar dataset (12,000 data points). The PRFO algorithm improved the performance of the Random Forest model by enhancing both accuracy and running time. The results showed an increase in accuracy across the datasets, with the Monkeypox dataset achieving a 2.08% improvement in accuracy, from 67.80% to 69.88%. The PRFO algorithm was found to be effective in finding optimal solutions in a relatively short time.
Alharbi et al. [9] investigated the use of metaheuristic optimization to improve feature selection and classification methods for detecting skin lesions indicative of Monkeypox. Using the GoogLeNet deep learning framework for feature extraction, the study employed a binary implementation of the dipper throated optimization (DTO) algorithm for feature selection. The decision tree classifier, optimized using DTO, was used for classification. The proposed methodology achieved an F1-score of 0.92, sensitivity of 0.95, specificity of 0.61, and an overall accuracy of 94.35%. The study demonstrated the effectiveness of the proposed method compared to other approaches, verified through statistical tests.
Rabie et al. [10] proposed a new diagnostic strategy for Monkeypox, called the Accurate Monkeypox Diagnosing Strategy (AMDS). AMDS includes two phases: pre-processing, which uses the Binary Tiki-Taka Algorithm (BTTA) for feature selection, and classification, where ensemble classifiers such as Layered K-Nearest Neighbors (LKNN), Statistical Naïve Bayes (SNB), and Deep Learning Classifier (DLC) are used. The decisions from these classifiers are merged using a new voting scheme called Fuzzified Voting Scheme (FVS). The experimental results showed that AMDS outperformed other diagnostic strategies, providing the most accurate diagnoses across two datasets.
With so many machine learning models that have been tested, the SVM model specifically with quadratic polynomial kernel remains largely unexplored. The kernel can handle non-linear patterns, which could potentially yield good results in Monkeypox detection. Therefore, this paper fills in the research gap by implementing an SVM with a quadratic polynomial kernel to see how well it performs on Monkeypox detection.
3. Methodology
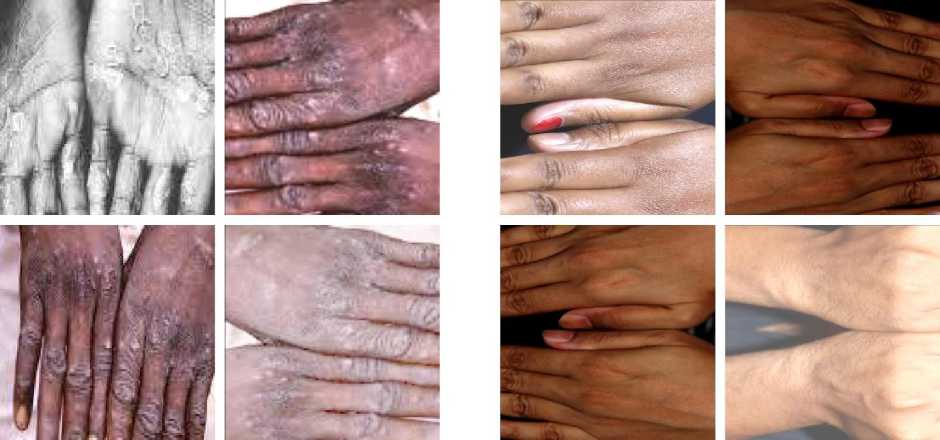
This study used a public dataset from Roboflow [11]. The dataset has three classes: Monkeypox, Normal, and Others. For this research, only Monkeypox and Normal classes were used to focus on telling infected cases apart from non-infected ones. There are 103 Monkeypox images and 123 Normal images, making a total of 226 images. The dataset was split into 80% for training (181 images) and 20% for testing (45 images) to evaluate the model fairly. Figure 1 shows several images obtained from the dataset.
(a)
(b)
Fig. 1. Several images obtained from the dataset [11]. (a) Monkeypox. (b) Normal.
The main method used is an SVM for classification. LBP features, which describe the texture of the images, were extracted as input for the SVM. LBP is good for medical image analysis. The SVM was trained on the training images using a quadratic polynomial kernel to handle non-linear patterns as shown in Equation 1.
К(х,у) = (х • у + с) 2 (1)
х and у are the input feature vectors. с is a constant that adjusts the flexibility of the decision boundary (often referred to as the kernel coefficient or intercept). The model was tested on the test images, and its performance was measured using metrics like accuracy, recall, true negative rate, and precision. Accuracy shows how correct the predictions are overall. Recall measures how well the model identifies Monkeypox cases. True negative rate checks how well the model recognizes Normal cases, and precision shows how many predicted Monkeypox cases were correct. Equations 2 – 5 show the formula of the performance metrics.
Accuracy =
TP+TN
TP+TN+FP+FN
TP
TP+FN
=
TP
=
TP+FP
TP stands for true positive. TN refers to true negative. FP stands for false positive. FN refers to false negative. To see how well the SVM performs, it was compared with other models trained on the same dataset, including a neural network with three hidden layers, KNN, logistic regression, random forest, decision tree, and Naive Bayes. All models were trained and tested using the LBP features. This comparison helps find the best model for detecting Monkeypox by looking at their performance under the same conditions. Figure 2 shows the flowchart of the methodology.
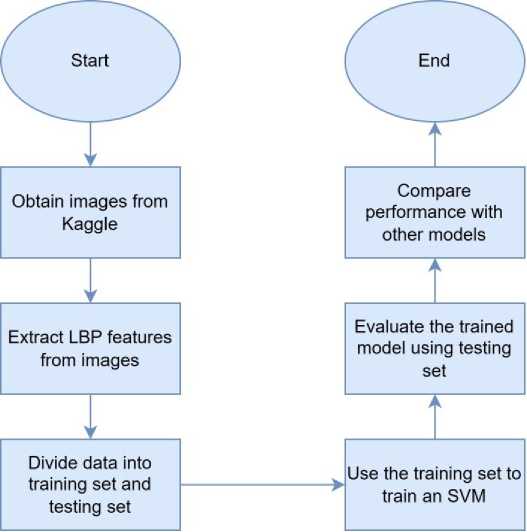
Fig. 2. The flowchart of the methodology.
4. Simulation and Discussion of Result
This section presents the results obtained from the proposed model (SVM). The model was tested using the testing set. The number of true positive, true negative, false positive, and false negative are obtained from the testing set. These metrics are used to construct the confusion matrix. Figure 3 shows the confusion matrix obtained from the proposed model.
This confusion matrix shows how well an SVM model classified two categories, which are Monkeypox and Normal. The model correctly identified 20 cases of Monkeypox and 22 cases of Normal, but it made some errors. It misclassified 1 Monkeypox case as Normal and 2 Normal cases as Monkeypox. This means that the number of true positive, true negative, false positive, and false negative are 20, 22, 2, and 1, respectively. These metrics are used to calculate performance metrics.
The performance metrics calculated are accuracy, recall, true negative rate, and precision. Accuracy tells us how often the model predicts correctly overall. Recall shows how good the model is at finding positive cases. The true negative rate measures how well the model identifies negative cases. Precision checks how many of the positive predictions are actually correct. These performance metrics are compared to other models which are also trained and tested using the same dataset used in this study. Table 1 shows the results obtained from different machine learning models.
The SVM model performs the best, achieving the highest accuracy (0.9333), recall (0.9524), and true negative rate (0.9167), along with a strong precision score (0.9091). This shows that SVM is very good at correctly identifying both positive and negative cases. It strikes a strong balance between sensitivity (finding positives) and specificity (finding negatives), making it the most reliable model for the task.
Neural networks and KNN come next in performance. Both have the same accuracy (0.8889), but each has its strengths. The neural network has a higher recall (0.9048), meaning it’s better at finding positives. On the other hand, KNN has better precision (0.9000), meaning it makes fewer mistakes when predicting positives. KNN also has a stronger true negative rate (0.9167) compared to the neural network (0.8750), showing it’s better at identifying negatives. While both models are competitive, they don’t match the overall effectiveness of SVM.
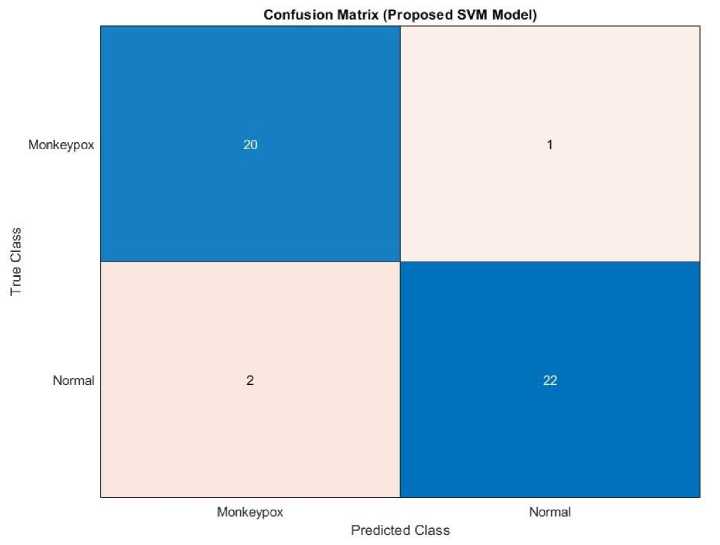
Fig. 3. Confusion matrix obtained from the proposed model.
Table 1. Results obtained from different machine learning models.
|
Model |
Accuracy |
Recall |
True Negative Rate |
Precision |
|
SVM (Proposed) |
0.9333 |
0.9524 |
0.9167 |
0.9091 |
|
Neural Network |
0.8889 |
0.9048 |
0.8750 |
0.8636 |
|
KNN |
0.8889 |
0.8571 |
0.9167 |
0.9000 |
|
Logistic Regression |
0.8444 |
0.8571 |
0.8333 |
0.8181 |
|
Random Forest |
0.8000 |
0.8571 |
0.7500 |
0.7500 |
|
Decision Tree |
0.7778 |
0.7619 |
0.7917 |
0.7619 |
|
Naïve Bayes |
0.7333 |
0.8095 |
0.6667 |
0.6800 |
The other models, such as Logistic Regression, Random Forest, Decision Tree, and Naïve Bayes, perform worse. Logistic Regression has a balanced but lower accuracy of 0.8444. Random Forest and Decision Tree prioritize recall, but their true negative rate and precision suffer as a result. Naïve Bayes performs the worst, with the lowest accuracy (0.7333) and true negative rate (0.6667), even though its recall (0.8095) is decent.
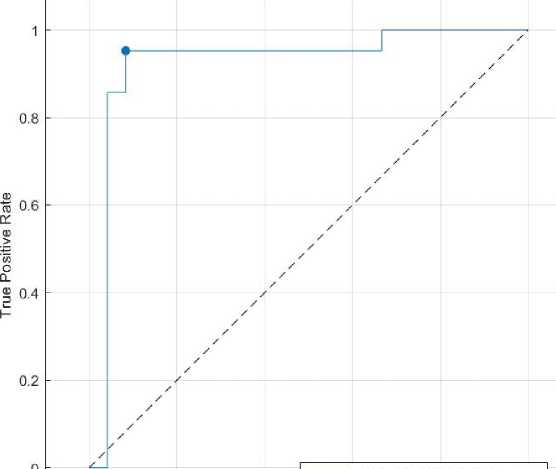
This comparison shows that choosing the best model depends on looking at multiple measures, as no single metric fully captures how well a model performs. SVM stands out as the most reliable choice for this task. A receiving operating characteristics (ROC) curve is also plotted to analyze the SVM. Figure 4 shows the ROC curve obtained from the proposed model.
The ROC curve shows how well an SVM model performs in classifying Monkeypox. The Area Under the Curve (AUC) is 0.9246, which means the model is very good at distinguishing between the classes. AUC closer to 1 is excellent, while 0.5 would mean random guessing. The curve rises quickly, showing that the model correctly identifies most positive cases with very few false positives, which is ideal. The marked point on the curve shows the model’s chosen threshold, where it balances sensitivity (how many positives it catches) and specificity (how few negatives it wrongly marks as positive). The dashed diagonal line represents random guessing, and this model’s curve is far above it, proving it is much better. Overall, the model performs strongly, but further checks like testing on new data and using other evaluation methods could help confirm its reliability.
ROC Curve (Proposed SVM Model)
-----Monkeypox (AUC = 0.9246)
• Monkeypox Model Operating Point
0 0.2 0.4 0.6 0.8 1
False Positive Rate
Fig. 4. ROC curve obtained from the proposed model.
5. Conclusion
In conclusion, this study shows that the SVM with a quadratic polynomial kernel is better at detecting Monkeypox than other machine learning models. It has the highest accuracy, recall, precision, and true negative rate. The model works especially well when using LBP features, making it a reliable tool for detecting the disease in healthcare settings. When compared to other models like neural networks, KNN, and random forests, the SVM model strikes a good balance between recall and true negative rate. This makes it a great option for early Monkeypox detection. The challenges of using the SVM are the need to select the right kernel. This is because if a wrong kernel is used, the results may be affected. The study results provide helpful insights into using machine learning to improve disease diagnosis and offer a strong tool for doctors and public health workers.
