Neural-Based Cuckoo Search of Employee Health and Safety (HS)
")
Author: Koffka Khan, Ashok Sahai
Journal: International Journal of Intelligent Systems and Applications(IJISA) @ijisa
Article in issue: 2 vol.5, 2013.
Free access
A study using the cuckoo search algorithm to evaluate the effects of using computer-aided workstations on employee health and safety (HS) is conducted. We collected data for HS risk on employees at their workplaces, analyzed the data and proposed corrective measures applying our methodology. It includes a checklist with nine HS dimensions: work organization, displays, input devices, furniture, work space, environment, software, health hazards and satisfaction. By the checklist, data on HS risk factors are collected. For the calculation of an HS risk index a neural-swarm cuckoo search (NSCS) algorithm has been employed. Based on the HS risk index, IHS four groups of HS risk severity are determined: low, moderate, high and extreme HS risk. By this index HS problems are allocated and corrective measures can be applied. This approach is illustrated and validated by a case study. An important advantage of the approach is its easy use and HS index methodology speedily pointing out individual employee specific HS risk.
Health and Safety, Risk, Employee, Checklist, Neural-Swarm, Cuckoo Search Algorithm
Short address: https://sciup.org/15010368
IDR: 15010368
Text of the scientific article Neural-Based Cuckoo Search of Employee Health and Safety (HS)
Published Online January 2013 in MECS
There is little empirical evidence of the influence of design and workstation aesthetics on employees and the distance between health and safety (HS), psychological factors, and the architectural design process can be considerable [5], [12], [30].
HS, an integral part of workstation design, is related to occupational ergonomics and job satisfaction [1], [3], [4], [11], [28], [37], [40], [41]. Leather et al 1998 [22] includes effects of sunlight in the work-place on employees and the stress item. Perceived environmental attributes, neighbourhood and workstation design characteristics are associated with well-being and job satisfaction [6], [35]. In addition to HS and work organisation an aesthetically supportive and harmonious physical environment may influence employees´ views of their workstations and their own health [7], [25], [26]. According to Helander 2005 [13] the work chair’s design, aesthetics and comfort might be as important as its HS advantages.
Aesthetic and HS factors, with or without psychosocial effects can be perceived to overlap [13], [23], [24]. In the clinical praxis HS problems are often focused on. The question arises if the comprehension of aesthetic needs only reflects the HS needs. To differentiate between those two is important in prevention of workstation problems.
-
[15] concludes that long hours of computer use are associated with HS problems. It is shown by [10] that prolonged use of computers, while performing work activities in poor HS environments is one major contributing factor to increase causes of neck pain. Studies reported less discomfort when HS were improved or HS information was given [18].
The workstation HS-related risk factors include hours of computer use, sustained awkward head and arm postures, poor lighting conditions, poor visual correction, and work organizational factors [14]. These risks cause problems such as, musculoskeletal disorders (e.g. sustained pain in the neck and upper extremities and regional disorders, such as wrist tendonitis, epicondylitis and trapezius muscle strain), eye discomfort and visual fatigue; and mental stress which are identified as some of the principal risks of computer task-based work [1]. If working tasks are carried out in inadequate conditions, workers with functional limitations may, over time, risk developing further disabilities. HS complaints have also been found to be associated with psychosocial factors at work [21].
There are a lot of approaches for employee HS risk assessment of computer-aided office workstations [8], [32], but for big sized companies with a lot of office workstations it is difficult to study all of the employees. There is a need of an approach for systematic HS employee risk assessment of whole companies and identification of employees with extreme HS risk for immediate attention.
The outline of this paper is as follows. Section II describes the study’s methodology (Section II.A), and the Neural-swarm-based HS risk assessment model (Section II.B). The Neural-swarm-based HS risk assessment model is composed of (1) Artificial neural network (ANN) (Section II.B.I) and (2) Cuckoo Search (CS) algorithm (Section II.B.II). By combining both the Neural-Swarm Cuckoo Search (NSCS) algorithm is formed (Section II.B.III). In Section III, a case study is presented together with an analysis of results. Most importantly highest HS risk dimensions/questions are given for the company’s employees. Section IV presents conclusions and advantages of using this project’s methodology for future studies.
-
II. HS Risk Assessment Method
A methodology for HS risk assessment and redesign of workstations is developed (cf. Figure 1). It includes a checklist (cf. Table 1) and a model (cf. Figure 1) for health and safety (HS) risk assessment. At steps 1 and 2 the checklist dimensions and items are determined. At step 3 data is gathered by interviews, observations and measurements. At step 4, HS risk is assessed and a quantitative HS risk index is determined using the data gathered. Based on risk assessment relevant corrective measures for reducing HS risk (step 5) are proposed and implemented (step 6).
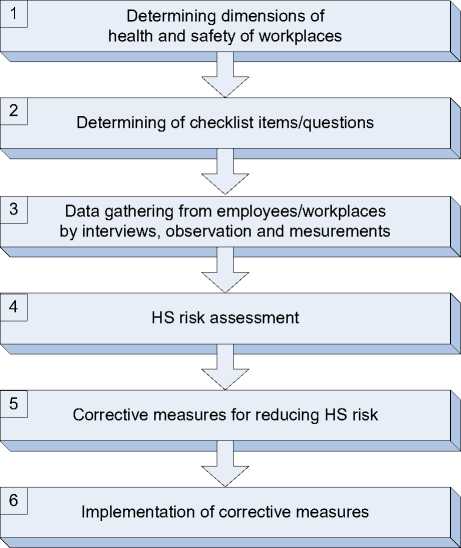
Fig. 1: Methodology steps for HS risk assessment and redesign of workstations
Table 1: Sample questions for measuring checklist dimension Health hazards (D8)
Q48. You have no complaints (e.g. headaches, eyes, neck, back, hands, wrists, arms discomfort or pains) working at your workstation.
Q49. Are you not receiving any medical treatment with relation to your work at present? Give percentage (0-100%)
HS risk assessment aims at identifying HS-related weaknesses of workstations. The entire construct of HS can be represented by a single dependent variable: HS risk index. It is a measure of how closely the features of a workstation match generally accepted HS guidelines. For HS risk assessment a HS index is calculated (cf. Figure 2). The checklist items (questions) on Figure 2 are indicated by Q, for example, Q48-Q49, represent the “environment” dimension questions for the employee. The HS index, I HS integrates 9 HS dimensions measured by 50 checklist questions. This index is used by the algorithm for HS risk assessment and for the redesign of workstations (cf. Figure 2).
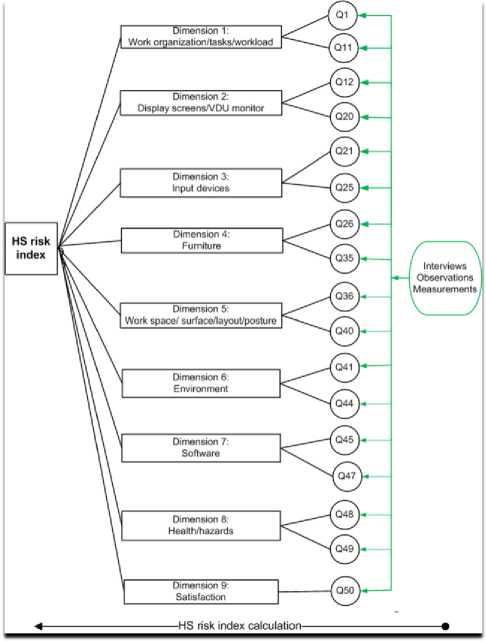
Fig. 2: Workstations HS risk assessment model
The severity ratings of HS risks on workstations are defined in Table 2. The workstation ratings for HS risk index, dimensions and items are determined by using the NSCS algorithm. HS index IHS is determined using employee responses, observations and measurements. Checklist dimensions/items indicating high (yellow) and extreme (red) HS risk guide the proposal for corrective measures for reducing the HS risk at specific workstations.
Table 2: Severity rating for HS risk
|
Rating |
Index range [1,5] |
Index range [0,100] |
Color |
|
Low |
[1-2] |
[0.25] |
|
|
Moderate |
(2,3] |
(25,50] |
Light Green |
|
High |
(3,4] |
(50,75] |
| Yellow |
|
Extreme |
(45] |
(75,100] |
-
III. Neural-swarm-based HS Risk Assessment Model
-
3.1 Artificial Neural Network (ANN)
At step 4 a HS employee risk assessment of company office workstations by departments is carried out. HS risk assessment aims at identifying HS-related problems for employees at their workstations. The entire construct of employee workstation HS risk assessment can be represented by a single quantitative dependent variable: HS risk index. It is a measure of how closely the features of a workstation match employee HS guidelines. For HS risk assessment an HS risk index is determined (p. Section II). For calculation of this risk index, a cuckoo search-based neural-swarm optimization [17] algorithm is proposed. It aggregates nine workstation ergonomic dimensions measured by 49 checklist items/questions.
The checklist structure is represented as an artificial neural network (Section II). By a modification of the neural-swarm cuckoo search algorithm neural network weights are trained using as a target the employee HS to workstation satisfaction (checklist dimension D9). Using these weights the responses of workstation users/employees are aggregated to individual risk indices. Based on risk indices, extreme employee HS risk can be found from a workstation HS viewpoint.
An ANN consists of a set of processing elements (cf. Fig. 3), also known as neurons or nodes, which are interconnected with each other [44]. Output of the ith neuron can be described by:
Yi = f> (£"=1™^ + 6.) (1)
where y i is the output of the node, x j is the jth input to the node, wi j is the connection weight between the node and input X j , 6 i is the threshold (or bias) of the node, and fi is the node transfer function.
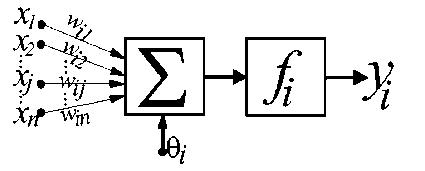
Fig. 3: Processing unit of an ANN (neuron)
The adaptation can be carried out by minimizing (optimizing) the network error function £ given by equation:
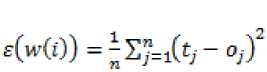
where £(w(i)) is the error at the ith training iteration; w(i) - the weights in the connections at the ith iteration; t j -the desired output/target (D8-user-satisfaction); oj - the actual value of the output node; n - the number of patterns (data gathered by checklist from workstation users). The optimization goal is to minimize the objective function by optimizing the network weights w (i).
-
3.2 A Cuckoo Search (CS) Algorithm
Cuckoo Search (CS) is a new meta-heuristic algorithm, to solve optimization problems which first proposed by Yang and Deb [43]. This algorithm is inspired by the obligate brood parasitic behaviour of some cuckoo species in combination with the L´evy flight behaviour of some birds and fruit flies in nature. This section introduces main steps of the cuckoo search via l´evy flights optimization algorithm. For simplicity in describing the Cuckoo Search, consider the following three idealized rules: 1) Each cuckoo lays one egg at a time, and dump its egg in randomly chosen nest; 2)
The best nests with high quality of eggs will carry over to the next generations; 3) The number of available host nests is fixed, and the egg laid by a cuckoo is discovered by the host bird with a probability p ϵ [0, 1]. In the case of minimization problems, the quality or fitness of a solution can simply be proportional to the minus value of the objective function. For convenience, one may use the following simple representations in which each egg in a nest represents a solution, and a cuckoo egg represent a new solution, the aim is to use the new and potentially better solutions (cuckoos) to replace a not so good solution in the nests. Based on these three rules, the basic steps of the Cuckoo Search (CS) can be summarized as the pseudo code shown in Figure 4. When generating new solutions x (t+1) for, say a cuckoo i, a L´evy flight is performed.
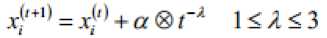
where a > 0 is the step size which should be related to the scale of variables of the problem of interests. In most cases, we can use a = 1. The product ® means entry-wise multiplications.
begin
Objective function f(x), x = (x,.....xj1
Generate initial population of n host nests X; (i = 12, .... n)
While
ft
Get a cuckoo randomly by L 'evy flights evaluate its quality/ftness Fj
Choose a nest among nfsay, j) randomly
«(F^Fj), replace j by the new solution:
End
Л fraction (pj of worse nests
Are abandoned and new ones are built:
Keep the best solutions
(or nests with quality solutions);
Rank the solutions and find the current best end while
Post process results and visualization end
Fig. 4: Pseudo code of the Cuckoo Search (CS)
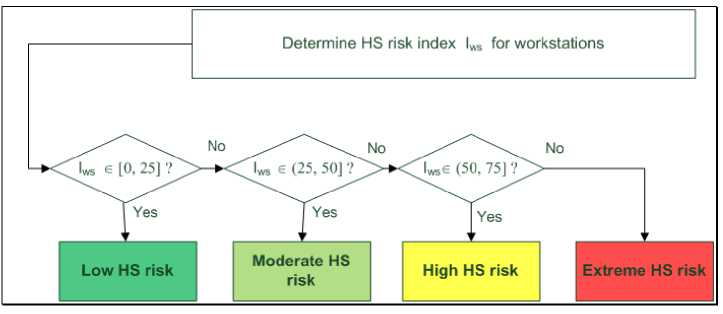
Fig. 5: HS risk index determination
-
3.3 Neural-Swarm Cuckoo Search (NSCS) Algorithm
In NSCS algorithm (cf. Fig. 4), the major idea underlying this synthesis is to interpret the weight matrices of the ANNs as solutions, weights or nests, and to change the weights by means of a cuckoo finding a better one. The error, e produced by the ANNs using these weights is the fitness measure which guides selection. This leads to a following weights training cycle [42] in order to get the best weights. The output is the HS risk index as indicated in Figure 2 and evaluated as shown in Figure 5.
-
IV. Case Study
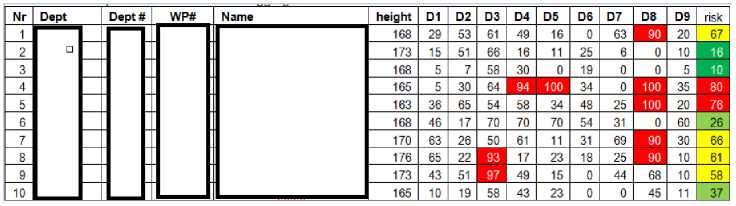
Within 3 months we observed the workstations in two buildings, a total of 91 workstations and interviewed 91 employees working on these workstations. The pre-test of the checklist with employees showed that the time for answering the questions took 59-60 minutes. Unclear questions were found and improved. On Table 3 are presented the summarized some results of this study. With red color are presented checklist dimensions with extreme HS risk for which relevant corrective measures for reducing HS risk to acceptable level should be proposed.
Table 3: Workstations studied and their aggregated values for different checklist dimensions and total risk assessments
For illustration and validation of this study data was collected and analysed using the NSCS algorithm. The algorithm was implemented in MATLAB. Each solution xi, i = {1, 2, ..., n}, and d = 9 represents the checklist dimensions (network weights) wi or solutions, that is, the number of optimization parameters.
Figure 6 shows the run of the NSCS algorithm displaying the RMSE training error. The initial convergence was at first to local minima but the algorithm was able to escape these locally optimal points and converge towards the global optimum. This was achieved after roughly 1520 iterations.
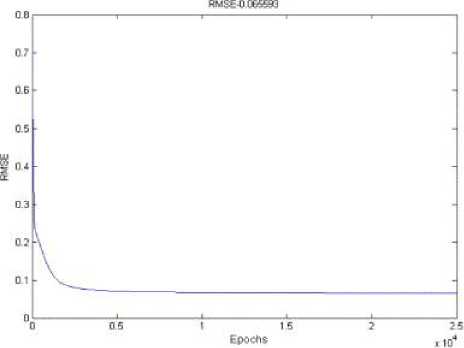
Fig. 6: NSCS RMSE error per epoch
On Table 4 is shown dimensions/questions weights for the most indicative health hazards for the company. Here the highest weight value is one and the lowest value is zero. Dimension nine (D9 - satisfaction) was used as targets for training. The weights from training were used to calculate the I HS risk for all employees.
Table 4: Most significant health hazards
|
Questions/Dimensions |
W i |
|
Q4 |
0.0004 |
|
D1 |
0.0016 |
|
Q40 |
0.0105 |
|
Q28 |
0.0125 |
|
Q45 |
0.0200 |
|
D7 |
0.0280 |
|
Q3 |
0.0312 |
|
Q41 |
0.0327 |
|
Q12 |
0.0363 |
|
Q7 |
0.0381 |
|
D2 |
0.0408 |
|
Q27 |
0.0424 |
|
Hours’ work |
0.0453 |
|
Q35 |
0.0443 |
At the beginning of each employee record a bar chart summarizing workstation related health risks for 8 dimensions is given, together with the employee dissatisfaction and total health risk is (cf. Figure 7). Further for each workstation the study results are summarized in a table. Relevant corrective measures for reducing the HS risk are proposed. In the first column are given the numbers of questions discussed. In the third column is given the HS risk in the scale [0,100] for the checklist item with highest risk value in this group.
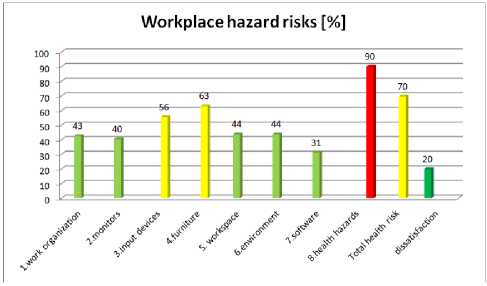
Fig. 7: Sample bar chart visualizing workstation related HS risks
In the following the data gathered from 91 workstations and employees working on these workstations are assessed and the HS risks determined. Here the highest value for HS risk is 5 and the lowest value is 1. The highest HS risk for all workstations is connected with keyboard (Q21=4.4) and monitor (Q12=4.3), followed by training to setup workstation (Q11=4.02), using mouse (Q23=3.9) and wristrest (Q33=3.9); chair (Q27=3.8).
-
V. Conclusions
A study for HS (Health and Safety) employee indicators in a company is developed. Its checklist contains 50 items. A Neural-Swarm Cuckoo Search algorithm trains employee checklist dimensions and questions weights. The calculation of individual employee HS risk indices I HSs based of these weights enables the classification of employees into four categories: low, medium, high and extreme HS risk levels. Employees with extreme and high indices are immediately attended to by the purchasing of/ rearrangement of equipment at their workstation. Further low-cost measures for reducing their HS risk are recommended.
The advantages of evaluation approach are: (1) significantly reduces the time and errors for HS evaluation; (2) applies modern mathematical model the neural-swarm cuckoo search algorithm for quantitative HS risk assessment; (3) reduces the load on the evaluating team when dealing with large companies having many employees by screening out employees with low and moderate I HS risk; (4) makes companies precisely formulate their strategies to redesign and improve their departmental workstations for employees; (5) higher employee satisfaction resulting in increased company profit.
References Neural-Based Cuckoo Search of Employee Health and Safety (HS)
- Alexandersson K (chairman). The Swedish Council on Technology Assessment in Health Care. Prescribed sick leave – causes, consequences and physician’s certification practice. A systematic literature review. 2003. Report No 167, Product-id 167E. (www.sbu.se)
- American journal of industrial medicine, Vol.41, 2002, pp. 221-235.
- Amick B.C 3rd, Robertson M M, De Rango K, Bazzani L, Moore A, Rooney T, Harrist R. Effect of office ergonomics intervention on reducing musculoskeletal symptoms. Spine 2003;28:2706-11
- Arnetz BB, Sjogren B, Rydéhn B, Meisel R., Early workplace intervention for employees with musculoskeletal-related absenteeism: a prospective controlled intervention study. Journal Occupational Environmental Medicine 2003;45:499-506
- Dekker SW, Nyce JM. How can ergonomics influence design? Moving from research findings to future systems. Ergonomics 2004;47:1624-39.
- Dekker SW, Nyce JM. How can ergonomics influence design? Moving from research findings to future systems. Ergonomics 2004;47:1624-39
- Dilani A. A new paradigm of design and health in hospital planning. World Hosp Health Serv 2005;41:17-21.
- Eltayeb, M., S., Symptoms of neck, shoulder, forearms, and hands: A cohort study among computer office workers in Sudan, Clinical journal of pain, Vol.27, No.3, 2011, pp. 275-281.
- EU 90/270/EEC, 1990 EU 90/270/EEC, Council Directive 90/270/EEC on the minimum safety and health requirements for work with display screen equipment, fifth individual directive within the meaning of article Vol.16, No.1, of Directive 89/391/EEC, OJ L 156, 1990.
- Green, N.B., A literature review of neck pain associated with computer use: public health implications, Journal of the Canadian chiropractic association, Vol.52, No.3, 2008, pp. 161-167.
- Hansson T, Jensen I. Swedish Council on Technology Assessment in Health Care (SBU). Chapter 6. Sickness absence due to back and neck disorders. Scand J Public Health Suppl 2004;63:109-51
- Helander M. Forget about ergonomics in chair design? Focus on aesthetics and comfort! Ergonomics 2003;Oct 20-Nov 15;46:1306-19.
- Helander M. Forget about ergonomics in chair design? Focus on aesthetics and comfort! Ergonomics 2003;Oct 20-Nov 15;46:1306-19
- Janwantanakul P, Pensri P, Jiamjarasrangsri W, Sinsongsook T: Prevalence of self-reported musculoskeletal symptoms among office workers. Occup Med (Lond) Vol.58, 2008, pp. 436-438.
- Jensen et al., Work-related psychosocial, physical and individual factors associated with musculoskeletal symptoms in computer users, Work & Stress, Vol.16 No.2, 2002, pp. 107–120.
- Kearney D. Ergonomics made easy: A checklist approach. Government Institutes, Rockville, 1998.
- Kennedy J and Eberhart RC, Particle swarm optimization, Proc. IEEE International conference on neural networks, Vol.4, 1995, pp. 1942–1948.
- Ketola et al., Effects of ergonomic intervention in work with video display units, Scandinavian journal of work, Environment & health Vol.28, No.1, 2002, pp. 18–24.
- Kogi K. Low-cost ergonomic solutions in small-scale industries in developing countries. Asian-Pacific newsletter in occupational health and safety, Vol. 4, 1997, pp. 68-70.
- Kogi K. Participatory action training for workplace improvements in small enterprises in developing countries. Environmental sciences, Vol. 4, 1996, pp. 123-133.
- Korhonen et al., Work related and individual predictors for incident neck pain among office employees working with video display units, Occupational and environmental medicine, Vol.60, No.7, 2003, pp. 475–482.
- Leroux I, Dionne CE, Bourbonnais R. Psychosocial job factors and the one-year evolution of back-related functional limitations. Scandinavian Journal of Work Environment Health 2004;30:47-55
- Leroux I, Dionne CE, Bourbonnais R. Psychosocial job factors and the one-year evolution of back-related functional limitations. Scandinavian Journal of Work Environment Health 2004;30:47-55
- Maslow AH, & Mintz N L. Effects of aesthetic surroundings: Initial short-term effects of three aesthetic conditions upon perceiving “energy” and “well-being” in faces. In.Gutman (Ed.), People and buildings (pp. 212-219) 1972; New York: Basic Books
- May DR, Reed K, Schroeder CE, Potter P. Ergonomic office design and aging: a quasi-experimental field study of employee reactions to an ergonomics intervention program, Journal of Occupational Health Psychology 2004; 9:123-35
- McCormack HM, Horne DJ, Sheather S: Clinical application of visual analogue scales: a critical review: Psychol Med 1988;18:1007-1019
- Melrose A.S. et al., Better display screen equipment (DSE) Work-related ill health data, research report, institute of occupational medicine for the health and safety, Vol. 561, 2007.
- Music S, Hook D, Banner S, Spooner M, Erdington DEW. The association of corporate work environment factors, health risks, and medical conditions with presenters among Australian employees. Am 2006; 21:127-36
- Nikov A., Kirchner I. H., Elsler D., Jijanov R. A method for screening of enterprises with ergonomic problems illustrated by a case study in Bulgaria, In: Seeber, A., Ed., Complex work systems, Challenge for analysis and design, Dortmund, GfA-Press, 2000, pp. 605-607.
- Nordin M, Knutsson A, Sundbom E, Stegmayr B. Psychosocial factors, gender, and sleep. J Occup Health Psychol 2005; 10:54-63.
- NRC and IOM Report, Musculoskeletal Disorders and the Workplace, National Research Council and Institute of Medicine. Washington, DC: National Academy Press, 2001.
- Rattaporn, S., et al., Exercise therapy for office workers with nonspecific neck pain: a systematic review, Journal of manipulative and physiological therapeutics, Vol.34, No.1, 2011, pp. 62-71.
- Rempel, D.M., and Janowitz, I.L., Ergonomics and prevention of occupational injuries. In: La Dou J, (ed): Occupational and Environmental Medicine. Prentice-Hall International, Inc., 1997, pp. 41-63.
- Risk assessment essentials, European agency for safety and health at work, http://hwi.osha.europa.eu
- Robertson MM, O'Neill MY. Reducing musculoskeletal discomfort: effects of an office ergonomics workplace and training intervention. International Journal of Occupational Safety and Ergonomics 2003; 9:491-502
- Rosscam E., Baichoo P. Using ergonomics and ergonomic checkpoints to improve quality of life, African newsletter on occupational health and safety, Vol. 7, 1997, pp. 34-35.
- Rugulies R, Raff J, Frank JEW, Oust B, Gillen M, Yen I, Bhatia R, Ames G, Gordon DR, Anoints I, Oman D, Jacobs BP, Blanc P. The psychosocial work environment and musculoskeletal disorders: design of a comprehensive interviewer-administered questionnaire. American Journal of Industrial Medicine 2004; 45:428-39
- Scott P.A. Macro-micro approach to establishing ergonomics in industrially developing countries. In: Seppala, P. et. Al, Eds., Proc. 13th Triennial Congress of the Intern. Erg. Assoc., Tampere, Finland, 1997, pp. 154-156.
- Shahanavaz H., Abeysekura J. Round table discussion on ergonomic education and training in industrially developing countries. In: Queinnec, Y., Daniellou, F., Eds., Design for Everyone, Vol. 2, 1991, pp. 1732-1737.
- The National Institute of Public Health, 2008, (Statens Folkhälsoinstitut, in Swedish), Olof Palmes gata 17, SE-103 52 Stockholm, Tfn/Phone + 46 (0)8 566 135 00. www.fhi.se
- Ulrich S R Effects of interior design on wellness: theory and recent scientific research. J Health Care Inter Des.1991;3:97-109
- Weiß, G.: Neural networks and evolutionary computation. PartI: Hybrid approaches in artificial intelligence. In: International Conference on Evolutionary Computation, 1994, pp. 268–272.
- X. S.Yang, S. Deb, “Cuckoo search via L´evy flights”, in: Proc. Of World Congress on Nature & Biologically Inspired Computing (NaBIC 2009), December 2009, India. IEEE Publications, USA, pp. 210-214.
- Yao, X., Evolutionary artificial neural networks. International journal of neural systems, Vol.4, No.3, 1993, 203–222.
