Neural network modeling and correlation analysis of brain plasticity mechanisms in stroke patients

Author: Stepanyan I.V., Mayorova L.A., Alferova V.V., Ivanova E.G., Nesmeyanova E.S., Petrushevsky A.G., Tiktinsky-Shklovsky V.M.
Journal: International Journal of Intelligent Systems and Applications @ijisa
Article in issue: 6 vol.11, 2019.
Free access
The aim of this research is the study of pathogenic signs, prognostically significant for the outcome of the disease and restoration of impaired functions at various stages of recovery after a stroke. This work describes a new method of applying a group of artificial neural network algorithms for each of the criteria and for each period of rehabilitation, and it is aimed at analyzing the structural and functional support of motor and higher cognitive functions, including speech and language as well as brain plasticity after ischemic stroke. The functional magnetic resonance imaging (fMRI, DTI) and clinical data machine learning algorithms were used. Self-organizing Kohonen and probabilistic neural network-based models with different structures and parameters were developed and applied for each criterion for periods of 3, 6, and 12 months of rehabilitation. For correlation analyses and modeling additional classifiers, we used: Decision Tree (DT), Support Vector Machine (SUM), k-Nearest Neighbor (KNN) clustering, and Logistic Regression (LR). In the performance evaluation, sensitivity, specificity, accuracy, error rate, and f-measure were used. The using of clinical parameters and mathematical modeling for analysis of brain plasticity mechanisms in stroke patients allowed in some cases to predict cognitive functions within the accuracy of 85-97%. Moreover, it is shown that the functional systems is represented by various brain structures, its synchronous activity and structural connectivity ensures the rapid and most complete restoration of motor and higher cognitive functions, including speech and language (effective post-stroke plasticity of the brain) after a course of neurorehabilitation.
Post-stroke neuroplasticity, functional and structural connectivity, brain structures, motor and higher cognitive functions, PNN, GRNN, Kohonen neural network, correlation analysis, machine learning
Short address: https://sciup.org/15016599
IDR: 15016599 | DOI: 10.5815/ijisa.2019.06.03
Text of the scientific article Neural network modeling and correlation analysis of brain plasticity mechanisms in stroke patients
Published Online June 2019 in MECS
Due to prevalence and consequences of the stroke, it falls into the category of socially significant diseases and remains the leading cause of disability in the adult population [1–3]. New specific therapy methods, such as thrombolysis and complex neuroprotection don’t yet allow to significantly reduce the high post-stroke disability which is observed in 80% of stroke survivors cases.
Aphasic syndromes are observed in from 21% to 38% of patients who have had a stroke. According to classical conceptions, aphasia is a systemic disorder of the human language function which in most cases is accompanied by impairments of speech production and comprehension as well as reading, writing and counting operations.
Improving the efficiency and development of new post-stroke rehabilitation methods is one of the most pressing health issues [4]. New prognostics factors for recovering impaired functions can be the basis of neurorehabilitation enhancement and new treatment methods development [5].
At the Center of Pathology of Speech and Neurorehabilitation, patients who had their first ischemic stroke were examined. The leading risk factors in all cases were associated with cardiovascular system diseases, while, as a rule, a combination of several risk factors was noted [6–8].
The early recovery period of the disease (3 months), the stroke in the left middle cerebral artery and /or left anterior cerebral artery basin and the absence of mental disorders and movement disorders (Bartel index ≥ 90 points) before stroke onset were the inclusion criteria; the presence of asymptomatic diffuse atrophic changes (according to structural MRI), decompensation of somatic pathology and oncological process were the exclusion criteria.
A range of complex data was analyzed: patients’ anamnesis, blood biochemistry, neurological and neuropsychological examination, fMRI and DTI data were processed. All patients received informed consent to conduct the study.
The novelty and contribution of this research are machine learning methods set applying, including artificial neural networks and correlation analysis for prognosis different clinic criteria at different stages of rehabilitation.
The paper consists of related works literature analysis, the data structure description, rehabilitation stages and prognostic criteria, applied methods description and analysis results, conclusions. On account of the large results volume at this paper it is shown only general results and some examples of conducted research. The further work includes creating a working algorithm for predicting the recovery of functions after an ischemic stroke.
-
II. Related Works
In the study [9] of functional brain network (FBN) based on functional magnetic resonance imaging (fMRI) has proved in depression disorder classification authors developed a method to classify fMRI data in 31 patients with depression and 29 healthy controls. Authors studied discriminative brain areas that contribute to the classification of depression disorders, which may help understand the pathogenesis of depression disorders. In the paper [10] it is mentioned that major depressive disorder (MDD) is a mental disorder characterized by at least 2 weeks of low mood, which is present across most situations. Diagnosis of MDD using resting-state fMRI data faces many challenges due to the high dimensionality, small samples, noisy, and individual variability. Authors performed a data-driving classification analysis using the whole brain connectivity measures. Effective connectivity measures were extracted using spectral Dynamic Causal Modeling (spDCM) and transformed into a vectorial feature space. Linear Support Vector Machine (linear SVM), non-linear SVM, k-Nearest Neighbor (KNN), and Logistic Regression (LR) were used as the classifiers to identify the differences between MDD patients and healthy controls. Results showed that the highest accuracy reached 91.67% ( p < 0.0001) when using 19 effective connections and reached 89.36% when using 6,650 functional connections. This study demonstrated that the effective connectivity measures might play a more important role, than functional connectivity ones, in exploring the differences between patients and health controls, and they afford a better mechanistic interpretability.
In the paper [11] authors describe a convolutional neural network architecture for functional connectome classification called connectome-convolutional neural network (CCNN). The results on simulated datasets and a publicly available dataset for amnestic mild cognitive impairment classification demonstrate that CCNN model can efficiently distinguish between subject groups.
Autism spectrum disorders (ASD) are diagnosed based on early manifesting clinical symptoms, including markedly impaired social communication [12]. The authors of the study [12] assessed the viability of restingstate functional MRI (rs-fMRI) connectivity measures as diagnostic biomarkers for ASD and studied which connectivity features are predictive factors of the diagnosis. Rs-fMRI scans from 59 high functioning males with ASD and 59 age- and IQ-matched typically developing (TD) males were used to build a series of machine learning classifiers. Classification features were obtained using 3 sets of brain areas. High classification accuracy was reached with several rs-fMRI methods (peak accuracy 76.67%). However, classification via behavioral measures consistently surpassed rs-fMRI classifiers (peak accuracy 95.19%). Authors remarks that while individuals can be classified as having ASD with statistically significant accuracy from their rs-fMRI scans alone but this method falls short of biomarker standards.
The paper [13] describes brain changes in Alzheimer’s disease (AD) that is important for patient prognosis and for assessing brain deterioration in clinical trials. In this diffusion tensor imaging study, authors used a new fiber tract modeling method to investigate white matter integrity in 50 elderly controls (CTL), 113 people with mild cognitive impairment (MCI), and 37 patients with AD. After clustering tractography using an ROI atlas, authors used a shortest path graph search through each bundle’s fiber density map to derive maximum density paths (MDPs), which we registered across subjects. We calculated the fractional anisotropy (FA) and mean diffusivity (MD) for all MDPs and found significant MD and FA differences between patients with AD and CTL subjects as well as MD differences between CTL and subjects with MCI. MD and FA were also associated with widely used clinical scores (MMSE).
The aim of the study [14] was to improve the human brain activities based on human brain signal. In the experiment level, several iteration processes have been done to get above 90% improvement rate of the brainwaves. In this research, the improved signal has been considered based on the generated brain signal in various aspects like human intelligence, memory as well as the capability of better sensations. In the paper [15], the accuracy of the entropy-based thresholding approaches in the detection of brain tumors was studied. A framework for brain tumor segmentation is proposed with the core process of the image thresholding to evaluate the accuracy of the entropies. Five entropies, namely, Renyi, Maximum, Minimum, Tsallis and Kapur are evaluated. The results show that the maximum entropy is the best for brain tumor detection. The paper [16] proposed a self-initialization process to K-Means method for automatic segmentation of human brain Magnetic Resonance Image (MRI) scans. In this paper, the method has been proposed to make use of the histogram of the gray scale MRI brain images to automatically initialize the K-means clustering algorithm. The performance of the proposed method is compared with the traditional K-Means method. For the IBSR volumes, the proposed method yields 3 to 4 times faster results and higher Dice value than traditional K-Means method.
The research work [17] deals with the accurate segmentation and detection of tumors in multimodal brain MRI, and this work is focused to improve automatic segmentation results. This work analyses the segmentation performance of existing state-of-art method on improved Fuzzy C-Means Clustering. The paper [18] presents an increase in the accuracy for detecting brain disorders using optimal unification and demonstrates the use of a multilateral filter and the applied watershed method. In the unification process, the optimal sets of segments are divided, and finest merged results are considered with the brain areas detected with anomalies.
In the study [19] the authors developed an extraction of shape features form MRI brain tumor image. The supervised learning algorithms like Deep Neural Network and Extreme Learning Machine are used to classify the brain tumor images. The experiment result shows that highest average accuracy has got at Zernike Moments up to 99%. The proposed predictive analytical framework in the study [20] is a combination of Decision Tree, Support Vector Machine and Artificial Neural Network which is used to gain insights from patients. Parkinson's disease voice dataset from UCI Machine learning repository is used as input. The experimental results show that early detection of disease will facilitate clinical monitoring of elderly people.
-
III. Materials and Methods
For the study of pathogenetic signs that are prognostically significant for the outcome of the disease and restoration of impaired functions at various stages of recovery after a stroke, a set of statistical data and evaluation criteria were analyzed (Table 1, Table 2).
Table 1. Description of criteria
|
Number |
1 |
2 |
3 |
4 |
5 |
|
Name of the criterion |
Impressive speech |
Expressive speech |
Non-speech impairments |
Holden Index |
Bаrthеl Index |
The aim of the research was the use of a complex of machine learning methods for the construction of analytical and prognostic models based on the initial data, evaluation and selection of the obtained models. The following tasks were solved:
-
• forecast of scores for each of the five scales at the end of the rehabilitation period in relation to the initial period;
-
• forecast of the results in points at the final month in terms of aggregate indicators for a term of two or three periods;
-
• forecast of the tendency in changes of results in the final month in relation to the indicators for the previous period (from the third to the sixth months, from the sixth to the twelfth months as well as from the third to the twelfth months).
Table 2. Baseline data, their structure and characteristics
|
Clinic |
fMRI |
|
|
Number of parameters after preprocessing |
419 |
163 |
|
Variants of the analysis with additional data |
no |
The fMRI was performed 2 times per hospitalization - at admission and at discharge (file1, file2) |
|
Periods of rehabilitation |
The number of surveyed people |
|
|
3rd month |
93 |
86 |
|
6th month |
38 |
31 |
|
12th month |
41 |
32 |
|
Total of investigated, pers. |
172 |
278 |
Taking into account the fact that the initial data is a highly discharged matrix with a large amount of data with 5 criteria for different periods of recovery of mental activity of stroke patients, the research concept was formulated. The content of the work was machine learning data processing of functional magnetic resonance imaging (fMRI, DTI) and clinical data of neural network-based classification, construction of mathematical and prognostic models, creating an algorithm for predicting the recovery of functions at various stages of recovery after a stroke, developing prognostic software, defining and configuring parameters of recognition algorithms.
One of the main tasks was to apply various methods for all possible combinations of input data and criteria for their evaluation at various periods of rehabilitation. At the same time, two groups of analysis were carried out - for static data on the prediction of neuropsychological and neurological test scores (Table 1) and for dynamic data on the prediction of trends (Table 3). At the same time, various variants of the initial data combinations were analyzed during different periods of rehabilitation.
Table 3. Dynamic criteria and output coding for predictive models
|
For 2 months |
Simplified version for 2 months |
|
|
The coding of the outputs of prognostic models by points |
-1 - deterioration of condition 0 - maintenance of condition 1 - improvement of condition |
-1 - deterioration or persistence of condition 1 - improvement of condition |
|
For 3 months |
Simplified version for 3 months |
|
|
The coding of the outputs of prognostic models, taking into account the coding for 2 months |
1 and -1: (7) 1 and 0: (8) 1 and 1: (9) |
-1 and -1: (1) -1 and 1: (3) 1 and -1: (7) 1 and 1: (9) |
The standard mathematical approaches to the preliminary processing of clinical data were studied. For gap processing, the following methods were used: filling in unknown values with selective statistics of the corresponding variable (mean, median, etc.) and filling in unknown values taking into account the correlation between variables or the measures of identity between observations. Based on a comparative analysis and data [21], Random Forest algorithm was selected as the most informative in predicting target parameters. Then data was normalized to maximum values.
In accordance with the standard approach to the classification of high-dimensional data, several classifiers were chosen to be able to compare the classification accuracy of different models and obtain a more dispersed estimate. To extract signs from primary data and their cause-and-effect relationships [22, 23], identify clinical factors and adaptive neural network rearrangements by neuroimaging data corresponding to the best course of the recovery stroke period according to neuropsychological assessments and during different periods after a stroke, algorithms based on the mathematical apparatus of decision trees with information gain criteria [24] were developed.
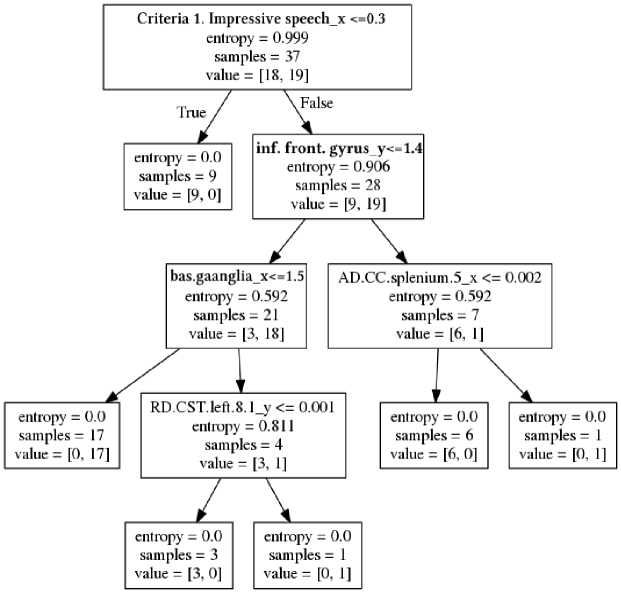
Fig.1. Decision tree for forecasting for the twelfth month of criterion 2 according to the data of the third month. Hereafter, _x and _y are the initial and final periods of analysis, respectively.
In example of one of the constructed decision trees (Fig. 1) each block is indicated: the name of the parameter and its threshold value, the entropy, the number of examined, the number of examined in each selected subgroup. Subgroups are formed when the threshold value of the specified parameter is reached (the dichotomy method). Left arrow corresponds the parameter with the unexcited threshold value, and right arrow does the parameter with the exceeded one.
To create prognostic neural network models, neural networks with simulations and networks to be trained with a teacher were used.
The functioning of Korhonen’s self-organizing neural network is determined by the scheme in Fig. 2. The neural network architecture consists of receptor and selforganizing layers. The ndist block is used to calculate the negative Euclidian distance between the input vector P, which encodes patient data (Table 3), and the rows of the neuron weights matrix [25]. At the output layer winner with largest negative distance is forming a cluster.
Thus, each neuron is forming a cluster with center of adjusted weights coefficients. In this study, in the process of self-organization the Kohonen network, an algorithm for learning in the mode of random representation of input was used (weights are adjusted as a result of each presentation of a network of random input sequence). The weights of the neurons close best matching unit were adjusted with the update formula 1 for a neuron v with weight vector W v (s):
И4(s + 1) = И4(5) + 0(и, v,s) • a(s)
• (P(t) - U^(s)), (1)
where s is the step index, t an index into the training sample, u is the index of the best matching unit for P(t), α(s) is a learning coefficient, Θ(u, v, s) is the neighborhood function which gives the distance between the neuron u and the neuron v in step s.
General mathematical description of the neural network functioning is based on combination of Kohonen rule with procedure of biases tuning [25]. Biases (b) at each neuron are recalculating at each tact of selfinitialization to manage the process of forming new clusters. Thus, the Kohonen self-organization rule is a recurrent relation that modifies the i -th row of the weights matrix of neurons by adding the weighted difference of the input vector and the value of this row in the previous step.
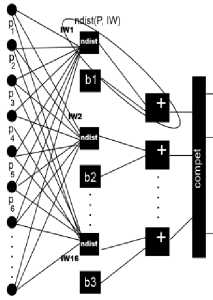
Fig.2. The structure of a neural network with self-organization. Blocks ndist are negative Euclidean distance. Outputs are not marked because they depends on a predictive model.
In this work T. Kohonen’s set of self-organizing neural networks was developed and applied for medical data clustering. The committee of neural models were built by iterating through the grid-search loop. For each of 5 criteria and for different periods of 3, 6 and 12 months, a group of neural networks with randomly generated parameters were adapted for the clinical data and for the results of fMRI analysis with the following conditions:
-
• Number of networks in committee for each task: 20;
-
• network dimension N (N x N): 10 x 10;
-
• accuracy of variations N scatter (ε): 5;
-
• α = 0.1;
-
• variations (ε) of α: 0.005;
-
• learning step Θ = 0.01;
-
• variations (ε) of Θ: 0.005;
-
• number of epochs : 70;
-
• variations (ε) of number of epochs: 30,
Since Kohonen's neural networks allow to build predictive models only for a part of the identified clusters, radial basis neural networks based on the kernel function (probabilistic neural networks with Gaussian functions) were additionally trained. The heuristics is that the observation recorded at a given point in the parametric space indicates the presence of a certain probability density at thе point. Clusters of closely spaced points indicate that there is a large probability density at this point. Near observation, there is more confidence in the level of density, and as you move away from it, trust decreases, tending to zero. Neurons with radial elements are assigned to each observation. Each of the neurons specifies a Gaussian function with a center in the corresponding observation. Each class corresponds to an output neuron. Each output neuron is connected to all radial neurons relating to its class. The output neuron summarizes the responses of all the neurons relating to its class. The values of the output signals are obtained proportional to the kernel estimates of the probability that they relate to the corresponding classes, and the final estimates of the probability of relating to the classes are calculated with normalization by one.
f (n)= e 'n 2 (2)
Choosing too small values of the parameter n will lead to sharp approximation functions, i.e. the inability of the network to properly forecast parameters on which it was not trained, and if the deviations are too large, n will lose features. The required value of the parameter of the Gaussian function was determined for each problem empirically, by fitting it so that the test error on the test set was as small as possible. For testing of neural algorithms cross correlation and simple split to test and training set were used.
-
IV. Results and Discussion
This work describes a part of the results of applying a set of standard and author's methods that have been applied for each of the criteria based on a computer program as a logical core of the developed software.
Algorithms based on linear regression [21] have been developed for extracting features from primary data. The results were ranked in descending order for each of their static and dynamic criteria to identify the most significant factors affecting the forecast. As an example, Table 4 shows the most significant factors that influence the prognosis of recovery after a stroke according to one of the criteria (here and below, x is the initial, and y is the final month in the analysis).
Table 4. Fragment of one of the lists of factors ranked by significance influencing the course of recovery after a stroke.
|
Criterion 1 after the 6th month according to cumulative clinical data for the 3rd and 6th month |
Criterion 1 after 6 months according to the fMRI data of the third month |
|||
|
N |
Factor name |
Validity period |
Brain area |
Correlated brain area |
|
1 |
The severity of aphasia at the 21st day after stroke onset |
6 months |
networks.DefaultMode.L P (R) (47,-67,29) |
atlas.OFusG r (Occipital Fusiform Gyrus Right) |
|
2 |
AD.IFOF.ILF.right.31.1 |
6 months |
networks.Visual.Occipita l (0,-93,-4) |
networks.DefaultMode.MPFC (1,55,-3) |
|
3 |
The presence of dysarthria immediately after stroke |
6 months |
atlas.Cereb1 r (Cerebelum Crus1 Right) |
atlas.MidFG l (Middle Frontal Gyrus Left) |
|
4 |
MD.CC.splenium.5 |
3 months |
atlas.LG r (Lingual Gyrus Right) |
atlas.Cuneal l (Cuneal Cortex Left) |
|
5 |
Hb.Stroke (directly after) |
6 months |
atlas.FOrb r (Frontal Orbital Cortex Right) |
atlas.TP l (Temporal Pole Left) |
|
6 |
RD.UF.left.46 |
3 months |
atlas.iLOC l (Lateral Occipital Cortex, inferior division Left) |
atlas.AG l (Angular Gyrus Left) |
|
7 |
FA.IFOF.31.ILF.right.1 |
6 months |
atlas.Cuneal l (Cuneal Cortex Left) |
atlas.PaCiG l (Paracingulate Gyrus Left) |
During the study, a committees of self-organizing T.Kohonen neural networks with various architectures were developed and the most successful ones were selected. The weights of all networks were initialized with random values. The data was mixed at each training to become the winners of different neurons. After each network was trained, it was tested. For this, a test case was fed to the network input, and as a result the neuron responsible for the nearest cluster was activated. Networks were selected in which the reliability of informative clusters was greater than 55%. As the result of series of conducted experiments, the best neural networks were selected. It was found that vectors with diagnostic features could belong to the same cluster. Examples of the results of group neural network clustering according to fMRI and clinical data are given in Table 5 and Table 6, respectively. Reliability given for the most informative cluster.
It is noted that method of self-organizing neural modeling gives prognostic results only in particular cases. Therefore, modeling brain plasticity mechanisms in stroke patients was supplemented with probabilistic neural networks PNN, GRNN and other machine learning algorithms.
Measures were used in assessing the effectiveness of the Recall / Precision System as well as the Jaccard similarity index which corresponds to the classification accuracy. To build the model and test, a test set and a training sample were applied.
Table 5. Committee of Kohonen’s networks, trained according to FMRI
|
Term and type of analysis |
Criteria |
type |
Reliabi-lity % |
|
6-month data forecast for 12 months |
5 |
discharge |
85.71 |
|
12-month data forecast for 12 months |
5 |
hospitalization |
85.71 |
|
12-month data forecast for 12 months |
5 |
discharge |
81.25 |
|
3-month data forecast for 3 months |
5 |
hospitalization |
79.25 |
|
6-month data forecast for 6 months |
5 |
discharge |
78.57 |
|
3-month data forecast for 3 months |
5 |
discharge |
77.27 |
|
3-month data forecast for 6 months |
5 |
discharge |
72.73 |
|
6-month data forecast for 6 months |
5 |
hospitalization |
72.22 |
|
3-month data forecast for 6 months |
5 |
hospitalization |
71.43 |
|
3-month data forecast for 6 months |
3 |
hospitalization |
67.57 |
Table 6. Committee of Kohonen’s networks trained in clinical data
|
Term and type of analysis |
criteria |
Reliabi-lity ,% |
|
3-month data forecast for 6-month points change |
3 |
67.56 |
|
3-month data forecast for 3 months |
5 |
76.08 |
|
3-month data forecast for 6 months |
5 |
81.08 |
|
6-month data forecast for 12-month points change |
4 |
62.16 |
|
3-month data forecast for 6-month points change |
5 |
64.86 |
|
6-month data forecast for 12 months |
3 |
67.56 |
|
3-month data forecast for 12-month points change |
4 |
62.16 |
|
6-month data forecast for 12 months |
5 |
81.08 |
|
6-month data forecast for 6-month points change |
3 |
67.56 |
|
3-month data forecast for 6 months |
3 |
67.56 |
|
6-month data forecast for 12-month points change |
4 |
62.16 |
|
6-month data forecast for 12-month points change |
5 |
81.08 |
|
3-month data forecast for 6 months |
4 |
62.16 |
|
6-month data forecast for 12-month points change |
3 |
67.56 |
|
12-month data forecast for 12 months |
5 |
87.50 |
|
3-month data forecast for 12-month points change |
3 |
67.56 |
|
6-month data forecast for 12-month points change |
5 |
64.86 |
|
6-month data forecast for 12-month points change |
5 |
81.08 |
|
3-month data forecast for 6-month points change |
5 |
81.08 |
|
6-month data forecast for 12-month points change |
5 |
81.08 |
|
3-month data forecast for 6-month points change |
4 |
62.16 |
|
6-month data forecast for 12-month points change |
4 |
62.16 |
Examples of the results of neural network modeling with data separation by 30% and 70% into a test set and a training samples with simplified criteria are given in Tables 7, 8, and 9. Leave-one-out cross-validation tests for GRNN prognostic models are shown in Table 10.
For comparative analysis and building the final prognostic algorithm additional classifiers were used as iterative approaches: support vector machine (SVM), K-Means clustering (KNN) method, and linear regression (LR). These additional algorithms were successfully applied to all combinations of criteria and each period of forecast.
Table 8. The forecast of the dynamics of changes of points according to 6 months for 12 months Criterion 5 Barthel (30/70)
|
PNN (Jaccard) |
0.75 |
|
SVM |
75.081 % |
|
LR |
72.553 % |
|
PNN Precision (classes -1,1, total) |
0.89, 0.33, 0.80 |
|
PNN Recall (classes -1,1, total) |
0.80, 0.50, 0.75 |
|
PNN f1-score (classes -1,1, total) |
0.84, 0.40, 0.77 |
To solve prognostic tasks that can be reduced to binary classification of clinical data, neural network models were constructed and trained with the cross-validation method [26]. Two criteria were used: the deterioration or maintenance of condition after a certain period and the improvement of condition after a certain period. In crossvalidation, the neural network was trained through a passthrough test, with a window size equal to one.
Table 7. Forecast of the dynamics of changes of points according to the data of 3 months for 6 months. Criterion.5 Barthel
|
PNN (Jaccard) |
0.833 |
|
SVM |
75.081 % |
|
LR |
72.553 % |
|
PNN Precision (classes -1,1, total) |
0.9, 0.5, 0.83 |
|
PNN Recall (classes -1,1, total) |
0.9, 0.5, 0.83 |
|
PNN f1-score (classes -1,1, total) |
0.9, 0.5, 0.83 |
Table 9. The forecast of the dynamics of changes of points according to the data of 3 months for the 12th month Criterion. 3 (30/70)
|
PNN (Jaccard) |
0.75 |
|
KNN |
97.297 % |
|
PNN Precision (classes -1,1, total) |
0.00,0.82,0.68 |
|
PNN Recall (classes -1,1, total) |
0.00,0.90,0.75 |
|
PNN f1-score (classes -1,1, total) |
0.00,0.86,0.71 |
Table 10. GRNN forecasting of leave-one-out cross-validation scores
|
Period of forecast (month) |
Criteria number |
MAE |
Std |
|
3 |
4 |
0.035 |
0.058 |
|
6 |
5 |
0.012 |
0.024 |
|
3 |
3 |
0.065 |
0.108 |
|
12 |
3 |
0.003 |
0.008 |
|
6 |
4 |
0.03 |
0.059 |
|
6 |
3 |
0.036 |
0.072 |
|
6 |
2 |
0.014 |
0.03 |
|
3 |
2 |
0.064 |
0.122 |
|
12 |
2 |
0.003 |
0.013 |
|
3 |
1 |
0.023 |
0.049 |
Table 11 shows some examples of trained neural Gaussian function n, was used as the threshold of the network binary classifiers. The parameter of the neural algorithm.
network, which is responsible for the width of the
Table 11. Examples of the results of neural network modeling by PNN neural networks on leave-one-out cross-validation
|
Type of analysis |
Criteria |
n |
Accuracy |
Sensitivity |
Specificity |
|
3-month data forecast for 6 months |
2. Expres-sive speech |
0.9 |
56.78 % |
83.3 % |
31.58 % |
|
6-month data forecast for 12-month points change |
4. Holden index |
1.0 |
70.27 % |
60.87 % |
85.71 % |
|
3-month data forecast for 12-month points change |
4. Holden index |
1.4 |
70.27 % |
65.22 % |
78.57 % |
As a result of proven research, it was found that taking into account the specifics of the initial statistical data, their processing by various neural network and machine learning techniques makes it possible to talk about the possibility of predicting the course of recovery after a stroke at various stages of rehabilitation in different cases.
For example, the accuracy of the forecast of Criterion 5 for 12 months from hospitalization reaches 85%, and the forecast of trend for 6 months of criterion 5 reaches 76%. At the same time, it was possible to predict the tendency of changes of points in the results of mental tests at 12 months after stroke onset according to clinical data of the third month (Holden index with leave-one-out crossvalidation and accuracy of 70%). At some cases KENN, LR and SVM methods predicted with accuracy up to 97% (for example the forecast of the dynamics of changes of points according to the data of 3 months for the 12th month for criterion 3). Predictions based on the developed models are possible both by fMRI data and clinical data.
-
V. Conclusions
This project is aimed at analyzing the structural and functional support of motor and higher cognitive functions, including language and speech, brain plasticity in normal conditions and in focal lesions of the brain hemispheres due to ischemic stroke. The topic of research is the functional systems represented by various brain structures [27,28], the joint activity of which ensures the rapid and most complete restoration of motor and higher cognitive functions, including language and speech (effective post-stroke plasticity of the brain) after a course of neurorehabilitation.
The correlation of standardized measures of various health outcomes assessment during post-stroke recovery, including quantification of the nervous system, functional outcome, and quality of life [29,30] were discussed in several systematic reviews. A systematic review of prognostic studies [30] showed that the age and severity of the musculoskeletal system were important prognostic parameters, while gender and the presence of vascular risk factors were not. The use of simple models gives a good prognosis for the restoration of patients' health (accuracy 70.4-72.9% [31]. Adding more clinical parameters to relatively simple models improved prediction accuracy (83.9% [32]). A complex model based on a large number of parameters, such as age, severity of stroke when admitted according to a standardized health scale, time from stroke to reception, glucose level etc. exceeded the forecasts of experienced doctors [33]. Changes in the health status assessment of health status in the framework of traditional Chinese medicine during the first 5 days after a stroke predicted a 90-day course of the disease [34]. As motor functions and movement are generally at the heart of the rehabilitation process, several studies have focused on predicting the recovery of these functions and special models have been created for this application [35].
The neuroimaging data used in our work is widely used in clinical work with stroke patients. Image processing provides valuable insights into the pathophysiology of stroke and the extent of the pathology as well as the potential to improve the accuracy of predicting the outcome of a stroke. However, more research is needed to establish which biomarkers are the best predictors of functional recovery after a stroke [36]. Current evidence suggests that adding neuroimaging data to models containing clinical predictors improves prediction accuracy [37].
The practical value of representing the brain as a structural brain network for predicting the course of injuries and diseases has been widely demonstrated in a number of studies [38–41]. The possibility of predicting the overall neurological health of an infants at 6 months after birth was shown on the basis of information obtained from diffusion-weighted images using the support vectors method [42]. A similar support vector machine was also used to predict the development of the neuromotor functions 18 months after the initial examination of premature infants with disorders acquired immediately after birth [43].
Although the use of neural networks for image analysis is well suited for many clinical applications, their use in neurology has recently become the most popular. Neural networks have been used to segment brain damage in patients with multiple sclerosis [44], brain tumors in multimodal MRI and for the classification of various types of cerebellar ataxia. Various deep learning architectures have also been used to predict the development of Alzheimer's disease stages and disease progression [45]. Similarly, a deep network of trust was used to study the diversity of variations in the condition of Alzheimer's patients [46]. However, the networks in these studies were trained with standard MR images as opposed to graphical or network representations of the brain structure. Thus, machine learning methods, including artificial neural networks, were used to study the mechanisms of plasticity of the brain of patients who had a stroke and identify options that correspond to the rapid recovery of impaired functions.
Very few works have used artificial neural networks to examine brain connectivity data. In Munsell et al. a deep auto-encoder was used to extract features (features) from the connectome, but the full brain structure was not fully considered [40]. A deep network of trust was used for a variety of classification tasks for functional magnetic resonance images and standard magnetic resonance brain data, but the spatial resolution of each image was not taken into account [47].
The totality of the results of our mathematical analysis performed is served to create research and the final algorithms for predicting the course of rehabilitation at various stages and consists in applying the most reliable models and methods based on the results. For machinelearning algorithms the clinical data and the results of fMRI and DTI analysis were used. Using neural networks, developed and selected on the basis of computational experiments, prognostic models were constructed for combinations of all criteria, terms and methods. Additionally, calculations were carried out on the application of decision trees, linear regression, KNN and SVM algorithms.
Thus, machine learning methods, including artificial neural networks, were used to study the mechanisms of plasticity of the brain of patients who had a stroke and identify options that correspond to the rapid recovery of impaired functions.
In this paper, we obtained confirmation of the presence of correlations for in-depth studies. The accuracy, sensitivity, and specificity of developed and applied methods has showed the possibility of forecast.
The developed complex of computer programs is configured to process biomedical data on all the tasks of predicting the course of stroke treatment, taking into account the available clinical factors. A new collected statistical data at the Center Pathology of Speech and Neurorehabilitation or other medical institute can be further investigated by algorithms developed and tested in this work. The high social significance of the recovery of patients after a stroke (including language and speech function), the complex of rehabilitation measures as well as the developed predictive mathematical models and software makes this research relevant and perspective for modern health care.
Acknowledgment
This work was supported by the Russian Science Foundation (Grant No. 16-15-10419).
References Neural network modeling and correlation analysis of brain plasticity mechanisms in stroke patients
- V. V. Alferova, L. A. Mayorova, E. G. Ivanova, A. B. Gekht, and V. M. Shllovskii, “Functional neuroimaging of the brain structures associated with language in healthy individuals and patients with Post-Stroke aphasia,” Neurosci. Behav. Physiol., vol. 48, no. 8, pp. 939–946, 2017.
- L. A. Mayorova, V. V. Alferova, A. G. Petrushevsky, and S. A. Varlamov, “Poststroke plasticity in sensory aphasia,” Collect. New Inf. Technol. Med. Biol. Pharmacol. Ecol. Proc. Int. Conf., pp. 51–54, 2018.
- V. V. Alferova et al., “The prognosis for post-stroke aphasia,” Zhurnal Nevrol. i psikhiatrii Im. S.S. Korsakova, vol. 118, no. 4, pp. 20–29, 2018.
- L. A. Mayorova, A. G. Petrushevsky, S. V. Kuptsova, and V. M. Shklovskii, “Functional and anatomical connectivity of the brain in post-stroke aphasia,” J. High. Nerv. Act., vol. 68, no. 2, pp. 141–151, 2018.
- V. M. Shklovsky, L. A. Mayorova, V. V. Alferova, A. G. Petrushevsky, E. G. Ivanova, and S. V. Kuptsova, “Functional magnetic resonance imaging of rest in the assessment of speech recovery in post-stroke sensory aphasia,” Biomed. Radioelectron., vol. 1, pp. 39–46, 2018.
- L. A. Mayorova, V. M. Shklovskii, V. V. Alferova, E. G. Ivanova, A. G. Petrushevsky, and E. A. Kondratyeva, “Poststroke brain plasticity in speech recognition recovery: an fMRI data,” J. High. Nerv. Act. in press
- V. M. Shklovskii, L. A. Mayorova, V. V. Alferova, E. G. Ivanova, and A. G. Petrushevsky, “Functional connectivity of speech regions in patients with isolated poststroke sensory aphasia: resting state fMRI,” J. High. Nerv. Act. in press
- V. M. Shklovsky et al., “Regression of post-stroke aphasia and related nonverbal syndromes caused by a course of rehabilitation treatment including intensive speech therapy.,” Zhurnal Nevrol. i psikhiatrii Im. S.S. Korsakova. in press
- X. Wang, Y. Ren, and W. Zhang, “Depression Disorder Classification of fMRI Data Using Sparse Low-Rank Functional Brain Network and Graph-Based Features,” Comput. Math. Methods Med., vol. 2017, pp. 1–11, 2017.
- X. Geng, J. Xu, B. Liu, and Y. Shi, “Multivariate Classification of Major Depressive Disorder Using the Effective Connectivity and Functional Connectivity,” Front. Neurosci., vol. 12, Feb. 2018.
- R. J. Meszlényi, K. Buza, and Z. Vidnyánszky, “Resting State fMRI Functional Connectivity-Based Classification Using a Convolutional Neural Network Architecture,” Front. Neuroinform., vol. 11, Oct. 2017.
- M. Plitt, K. A. Barnes, and A. Martin, “Functional connectivity classification of autism identifies highly predictive brain features but falls short of biomarker standards,” NeuroImage Clin., vol. 7, pp. 359–366, 2015.
- T. M. Nir et al., “Diffusion weighted imaging-based maximum density path analysis and classification of Alzheimer’s disease,” Neurobiol. Aging, vol. 36, pp. S132–S140, Jan. 2015.
- R. Chowdhury and A. F. M. Saifuddin Saif, “Efficient Mathematical Procedural Model for Brain Signal Improvement from Human Brain Sensor Activities,” Int. J. Image, Graph. Signal Process., vol. 10, no. 10, pp. 46–53, Oct. 2018.
- A. Q. Alyahya and A. A. Abu-Shareha, “Accuracy Evaluation of Brain Tumor Detection using Entropy-based Image Thresholding,” Int. J. Inf. Technol. Comput. Sci., vol. 10, no. 3, pp. 9–17, Mar. 2018.
- K. T, K. N, and S. P, “Automatic Brain Tissues Segmentation based on Self Initializing K-Means Clustering Technique,” Int. J. Intell. Syst. Appl., vol. 9, no. 11, pp. 52–61, Nov. 2017.
- K. Bhima and A. Jagan, “An Improved Method for Automatic Segmentation and Accurate Detection of Brain Tumor in Multimodal MRI,” Int. J. Image, Graph. Signal Process., vol. 9, no. 5, pp. 1–8, May 2017.
- N. Reddy P, C. P. V. N. J. M. Rao, and C. Satyanarayana, “Optimal Segmentation Framework for Detection of Brain Anomalies,” Int. J. Eng. Manuf., vol. 6, no. 6, pp. 26–37, Nov. 2016.
- A. A. Anbarasa Pandian and R. Balasubramanian, “Analysis on Shape Image Retrieval Using DNN and ELM Classifiers for MRI Brain Tumor Images,” Int. J. Inf. Eng. Electron. Bus., vol. 8, no. 4, pp. 63–72, Jul. 2016.
- N. Shamli and B. Sathiyabhama, “Parkinson’s Brain Disease Prediction Using Big Data Analytics,” Int. J. Inf. Technol. Comput. Sci., vol. 8, no. 6, pp. 73–84, Jun. 2016.
- L. Torgo, Data mining with R: learning with case studies. Boca Raton: Chapman & Hall/CRC, 2011.
- A. Painsky and S. Rosset, “Cross-Validated Variable Selection in Tree-Based Methods Improves Predictive Performance,” IEEE Trans. Pattern Anal. Mach. Intell., vol. 39, no. 11, pp. 2142–2153, Nov. 2017.
- R. C. Barros, M. P. Basgalupp, A. C. P. L. F. de Carvalho, and A. A. Freitas, “A Survey of Evolutionary Algorithms for Decision-Tree Induction,” IEEE Trans. Syst. Man, Cybern. Part C (Applications Rev., vol. 42, no. 3, pp. 291–312, May 2012.
- J. R. Quinlan, “Induction of decision trees,” Mach. Learn., vol. 1, no. 1, pp. 81–106, Mar. 1986.
- T. Kohonen and T. Honkela, “Kohonen network,” Scholarpedia, vol. 2, no. 1, p. 1568, 2007.
- I. V. Stepanyan and E. I. Denisov, “Application of neural network technologies in physiology, occupational medicine and human ecology,” Vestn. Tver state un-that. Ser. Biol. Ecol., vol. 23, no. 20, pp. 37–47, 2011.
- A. C. Laska, A. Hellblom, V. Murray, T. Kahan, and M. Von Arbin, “Aphasia in acute stroke and relation to outcome.,” J. Intern. Med., vol. 249, no. 5, pp. 413–22, May 2001.
- D. F. Muresanu, A. Buzoianu, S. I. Florian, and T. von Wild, “Towards a roadmap in brain protection and recovery,” J. Cell. Mol. Med., vol. 16, no. 12, pp. 2861–2871, Dec. 2012.
- K. C. Johnston, A. F. Connors, D. P. Wagner, W. A. Knaus, X. Wang, and E. C. Haley, “A predictive risk model for outcomes of ischemic stroke.,” Stroke, vol. 31, no. 2, pp. 448–55, Feb. 2000.
- J. M. Veerbeek, G. Kwakkel, E. E. H. van Wegen, J. C. F. Ket, and M. W. Heymans, “Early Prediction of Outcome of Activities of Daily Living After Stroke,” Stroke, vol. 42, no. 5, pp. 1482–1488, May 2011.
- I. R. König et al., “Predicting long-term outcome after acute ischemic stroke: a simple index works in patients from controlled clinical trials,” Stroke, vol. 39, no. 6, pp. 1821–1826, 2008.
- A. Muscari, G. M. Puddu, N. Santoro, and M. Zoli, “A simple scoring system for outcome prediction of ischemic stroke,” Acta Neurol. Scand., vol. 124, no. 5, pp. 334–342, Nov. 2011.
- G. Ntaios, M. Faouzi, J. Ferrari, W. Lang, K. Vemmos, and P. Michel, “An integer-based score to predict functional outcome in acute ischemic stroke: The ASTRAL score,” Neurology, vol. 78, no. 24, pp. 1916–1922, Jun. 2012.
- K.-G. Cao, C.-H. Fu, H.-Q. Li, X.-Y. Xin, and Y. Gao, “A new prognostic scale for the early prediction of ischemic stroke recovery mainly based on traditional Chinese medicine symptoms and NIHSS score: a retrospective cohort study,” BMC Complement. Altern. Med., vol. 15, no. 1, p. 407, Dec. 2015.
- D. Haselbach, A. Renggli, S. Carda, and A. Croquelois, “Determinants of Neurological Functional Recovery Potential after Stroke in Young Adults,” Cerebrovasc. Dis. Extra, vol. 4, no. 1, pp. 77–83, Apr. 2014.
- B. Kim and C. Winstein, “Can Neurological Biomarkers of Brain Impairment Be Used to Predict Poststroke Motor Recovery? A Systematic Review,” Neurorehabil. Neural Repair, vol. 31, no. 1, pp. 3–24, Jan. 2017.
- L. Kwah and R. Herbert, “Prediction of Walking and Arm Recovery after Stroke: A Critical Review,” Brain Sci., vol. 6, no. 4, p. 53, Nov. 2016.
- R. Cuingnet et al., “Spatial regularization of SVM for the detection of diffusion alterations associated with stroke outcome,” Med. Image Anal., vol. 15, no. 5, pp. 729–737, Oct. 2011.
- Y. Ghanbari, A. R. Smith, R. T. Schultz, and R. Verma, “Identifying group discriminative and age regressive sub-networks from DTI-based connectivity via a unified framework of non-negative matrix factorization and graph embedding,” Med. Image Anal., vol. 18, no. 8, pp. 1337–1348, Dec. 2014.
- B. C. Munsell et al., “Evaluation of machine learning algorithms for treatment outcome
- prediction in patients with epilepsy based on structural connectome data,” Neuroimage, vol. 118, pp. 219–230, Sep. 2015.
- D. Zhu, D. Shen, X. Jiang, and T. Liu, “Connectomics signature for characterizaton of mild cognitive impairment and schizophrenia,” in 2014 IEEE 11th International Symposium on Biomedical Imaging (ISBI), 2014, pp. 325–328.
- E. Ziv, O. Tymofiyeva, D. M. Ferriero, A. J. Barkovich, C. P. Hess, and D. Xu, “A Machine Learning Approach to Automated Structural Network Analysis: Application to Neonatal Encephalopathy,” PLoS One, vol. 8, no. 11, p. e78824, Nov. 2013.
- C. J. Brown et al., “Prediction of Motor Function in Very Preterm Infants Using Connectome Features and Local Synthetic Instances,” 2015, pp. 69–76.
- Y. Yoo, T. Brosch, A. Traboulsee, D. K. B. Li, and R. Tam, “Deep Learning of Image Features from Unlabeled Data for Multiple Sclerosis Lesion Segmentation,” 2014, pp. 117–124.
- H.-I. Suk, S.-W. Lee, and D. Shen, “Hierarchical feature representation and multimodal fusion with deep learning for AD/MCI diagnosis,” Neuroimage, vol. 101, pp. 569–582, Nov. 2014.
- T. Brosch, R. Tam, and Initiative for the Alzheimers Disease Neuroimaging, “Manifold learning of brain MRIs by deep learning.,” Med. Image Comput. Comput. Assist. Interv., vol. 16, no. Pt 2, pp. 633–40, 2013.
- S. M. Plis et al., “Deep learning for neuroimaging: a validation study,” Front. Neurosci., vol. 8, Aug. 2014.
