New philosophy of validation and verification for cardiology: classical proof theory imported from natural sciences

Author: Rudenko Mikhail Y., Krstai Goran
Journal: Cardiometry @cardiometry
Section: Original research
Article in issue: 4, 2014.
Free access
Aims Problems of validation and verification are very critical in medicine. The absence of adequate models describing biophysical processes in the organism leads to using only practical evidence for these purposes that hinders innovations. But advances in medicine require new effective ways to solve these problems. Cardiometry as a new field in cardiology offers a new philosophy of validation and verification based on the classical proof theory borrowed from natural sciences. The aim hereof is to provide a new methodology for validation and verification for cardiovascular diagnostics. Materials and methods Axiomatic concepts based on new laws and rules allow applying direct and indirect methods of proof for validation and verification in medicine. Results The formulated laws of cardiometry provide reliable tools for verification of the correspondence between the cardiac signals and the real biophysical processes in the cardiovascular system. Conclusion The proposed methodology for verification of the correspondence between the ECG shapes and the relevant biophysical processes has been successfully developed exclusively as a result of creation of the comprehensive theory of cardiac cycle phase analysis being the basis of cardiometry...
Evidence-based medicine, verification, validation, cardiology, ecg, metabolic processes, cardiometry, scientific research philosophy, science methodology
Short address: https://sciup.org/148308777
IDR: 148308777 | DOI: 10.12710/cardiometry.2014.4.1630
Text of the scientific article New philosophy of validation and verification for cardiology: classical proof theory imported from natural sciences
Aims Problems of validation and verification are very critical in medicine. The absence of adequate models describing biophysical processes in the organism leads to using only practical evidence for these purposes that hinders innovations. But advances in medicine require new effective ways to solve these problems. Cardiometry as a new field in cardiology offers a new philosophy of validation and verification based on the classical proof theory borrowed from natural sciences. The aim hereof is to provide a new methodology for validation and verification for cardiovascular diagnostics. Materials and methods Axiomatic concepts based on new laws and rules allow applying direct and indirect methods of proof for validation and verification in medicine. Results The formulated laws of cardiometry provide reliable tools for verification of the correspondence between the cardiac signals and the real biophysical processes in the cardiovascular system. Conclusion The proposed methodology for verification of the correspondence between the ECG shapes and the relevant biophysical processes has been successfully developed exclusively as a result of creation of the comprehensive theory of cardiac cycle phase analysis being the basis of cardiometry. Progress in cardiology is badly affected by the absence of an adequate cardiac cycle phase concept so that a lot of inconsistencies have been accumulated therein. It has been just the logics imported to the theoretical analysis methods of cardiology and supported by a new knowledge of the cardiac cycle phase structure that allows us to originally apply the natural science proof philosophy to cardiology. Keywords Evidence-based medicine • Verification • Validation • ECG • Metabolic processes • Cardiometry • Cardiology • Scientific research philosophy • Science methodology Imprint Mikhail Y. Rudenko, Goran Krstačić. New philosophy of validation and verification for cardiology: classical proof theory imported from natural sciences; Cardiometry; No.4; May 2014; p.16-30; doi: 10.12710/cardiometry.2014.4.1630. Available from:
The word “verification” is defined in a philosophical dictionary as follows: verus in Latin means true , and facĕre means to make , so considering all together it denotes evidence that establishes or confirms the accuracy or truth of something. A supposition (hypothesis) may be verified, i.e., its validity can be proved either empirically or by a consistent logical proof.
The given definition offers two ways for finding the truth: the first way is an empirical method of proof, and the second one is based on a logical proving procedure.
In general, in medicine, including cardiology, verification is based on empirical data, i.e., experimentation evidence only. It is connected with the fact that cardiology deals exclusively with anatomical evidence [1-7]. The theoretical basis of the existing cardiology that explains the functioning of individual segments of the cardiovascular system shows significant contradictions and inconsistencies, and sometimes even false ideas about physical processes prevail therein. Thus, the classical interpretation of the fluid flow pattern in the laminar regime used for the conventional description of blood circulation is based on a wrong concept that all fluid particles in blood move always in parallel to walls in a pipe where the flow occurs [8,9]. However, it is impossible to find such a hypothetic concept anywhere in physics, since, by definition, under the laminar conditions, all particles are concentrated in the center of the flow that finally results in a higher energy consumption to overcome an increased fluid flow friction. As shown in Table 1, the efficiency in the laminar flow is very low, and, therefore, the laminar regime cannot physically exist in the blood vessels. Besides, the pressure in the aorta under the laminar conditions would reach approximately 2 atmospheres that is not the case in reality: actually, the aortic pressure in a human body does not exceed 200 mm Hg. Therefore it should be stated that the classical approach thereto is not capable of providing any mathematics to describe hemodynamics in the proper way.
Table 1. Hemodynamic efficiency for hypothetic case of the laminar blood flow regime in blood vessels in a human body
|
Vessels |
Diameter, cm |
Length, cm |
Blood flow velocity, cm/sec. |
Reynolds number |
Hydraulic efficiency of blood vessels, % |
|
Aorta |
1,0 |
40 |
50 |
1670 |
39,4 |
|
Large arteries |
0,3 |
20 |
13 |
130 |
3 |
|
Main arterial branches |
0,1 |
10 |
8 |
27 |
0,42 |
|
Terminal arteries |
0,06 |
1 |
6 |
12 |
1,1 |
|
Arterioles |
0,002 |
0,2 |
0,3 |
0,02 |
3,15·10-4 |
|
Capillaries |
0,0008 |
0,1 |
0,07 |
0,002 |
2,5·10-5 |
|
Capillary veins |
0,003 |
0,2 |
0,07 |
0,007 |
1,6·10-4 |
|
Terminal veins |
0,15 |
1 |
1,3 |
6,5 |
1,5 |
|
Main vein branches |
0,24 |
10 |
1,5 |
12 |
0,44 |
|
Large veins |
0,6 |
20 |
3,6 |
72 |
3,4 |
|
Vena cava |
1,25 |
40 |
33 |
1375 |
40 |
By adopting the above erroneous model of blood circulation, the classical cardiology fails to create an adequate theory for an acceptable logical analysis of the hemodynamic processes in the cardiovascular system in a human body.
Among other things, the problem of the necessity to specify signal filtering parameters for cardiac signal recording has never been discussed, when designing or developing various diagnostic devices. As a consequence, contradictions in the cardiac signal form analysis do not allow classifying the cardiac signal forms in a proper manner.
As a result, until recently, the verification of the cardiac signals has been carried out on the basis of clinical evidence only. And another very important fact is that it is very often the case that measuring the same parameter according to different technologies or with different devices gives inconsistent results which may show significant discordance.
It should be noted that the natural sciences do not come up against the above mentioned problems since any object is investigated by logical proof procedures that is the basis of scientific research methodology. At the same time, curricula of medical universities ignore methodological concepts of this sort at all. Therefore, the authors would like to outline the essence of the naturalscience-based methodology borrowed from natural sciences [10-15].
Materials and methods
There are two methods for proving in a natural science: the method of direct proof and that of indirect proof.
The basis of the direct method of proof can be outlined as follows:
-
1. A mathematical description of the phenomenon to be investigated should be available.
-
2. Axiomatic logic statements for explanation of the process under study should be available. It is an axiomatic foundation for making logical conclusions. The axioms should be unambiguous.
-
3. Reproducibility: the phenomenon being investigated should be reproduced at least three times under different experimental conditions.
-
4. Modeling and predicting an influence of different conditions on the given phenomenon should be provided.
The indirect method (elimination method) of proof is based on the following:
-
1. Axiomatic logic statements used for constructing the system of logical negation and confirmation of arguments in favor of existence of the observed phenomenon should be available.
-
2. Recording of the phenomenon at least three times under different experimental conditions should be provided.
Let us note again that the verification principle in cardiology is based on empirical evidence speaking about correspondence between the forms of cardiac signals and the associated physiological processes that determine the said cardiac signals. But there is a disadvantage because there is no logical apparatus available required for describing the object being investigated, so it may produce a lot of disagreements in results obtained by different methods.
The weak points in the situation are as follows:
-
1. No unified logical theory of the performance of the cardiovascular system is available.
-
2. A plausible explanation for only particular, but not systemic characteristics of the cardiac signals is available.
Thus, the aim of this paper is to focus attention of the cardiology community on the fact that now we are facing the problem of quality in diagnostics in cardiology and that it is necessary to identify new ways to improve the existing situation. For proving the correspondence between the different forms of the cardiac signals and the relevant physiological processes, covering all cases within and beyond their norm, including extremely critical cases, it is necessary to adopt arguments that can be used as axioms in the proving procedure. For the purpose of establishing the correspondence, the logical proving system should meet the following requirements:
-
1. A database of various cardiac signals should be available.
-
2. The relevant axioms (arguments) including an adequate mathematical model of hemodynamics should be available.
-
3. At least three signs of changes in the cardiac signal form explained by the axioms (arguments) should be identified.
-
4. Logical justification of the relations between the cardiac signal forms and the relevant biochemical processes they are caused by should be at hand.
-
5. Theoretical prediction (modeling) of the process progression under various conditions should be available.
-
6. Recording of prognosticated changes in the cardiac signal forms upon influencing the biophysical process should be provided.
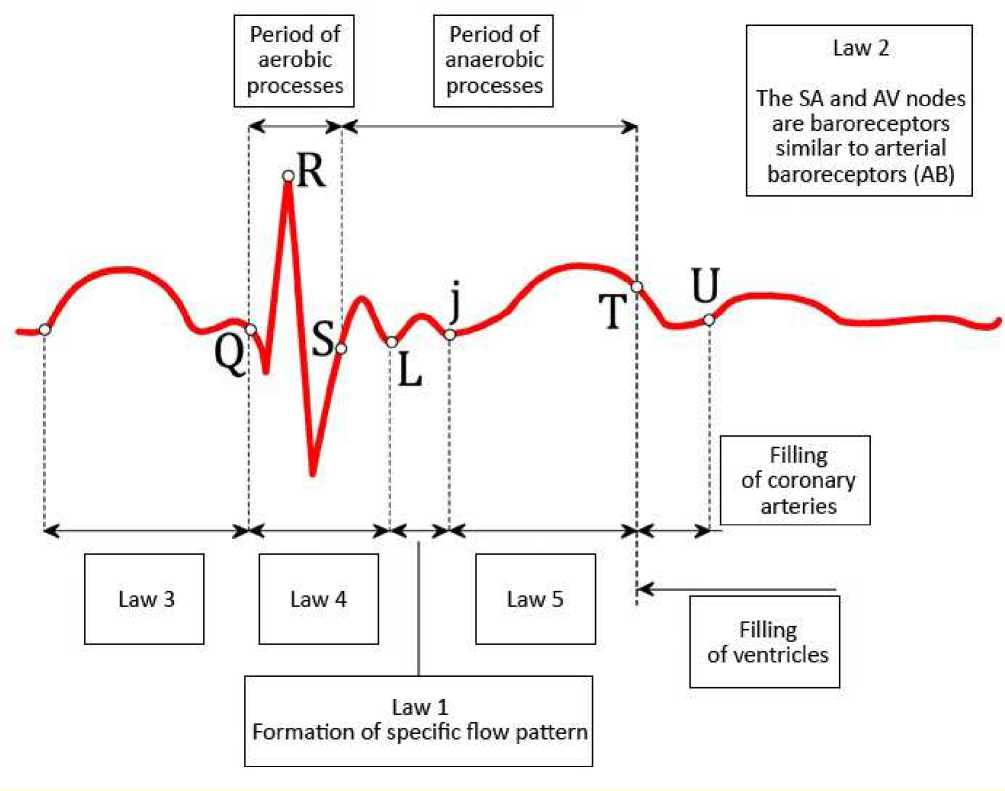
Law 1
The blood flow in the heart and the blood vessels is organized under the conditions of elevated fluidity (which is said to be the third mode of flow to differ from the laminar regime and turbulent mode), and the elevated fluidity is characterized by low friction due to the specific flow pattern formed by alternating rings of blood elements and plasma. This blood flow regime is defined by mathematical equations introduced by Poyedintsev-Voronova for hemodynamics.
Consequences
-
1) The entire human anatomy of the circulatory system is designed for the generation and the maintenance of the specific elevated fluidity regime.
-
2) Every cardiac cycle consists of ten phases, and each of the phases undertakes its own specified function to provide and maintain the proper hemodynamics.
-
3) Phase-related volumes of blood can be calculated by the above mentioned hemodynamic equations.
-
4) The quality of each function in the cardiac performance depends on amplitudes and intensity of contractions of the respective cardiac and vascular muscles.
-
5) There is a compensatory mechanism in the circulatory system muscle contractility that is responsible for maintaining hemodynamic parameters at their normal level. The operation of the compensatory mechanism is as follows: if a muscle group in the circulatory system demonstrates a decreased contractile function, one or more of the contiguous muscle groups within the circulatory system will automatically increase their contractile activity to compensate the loss of the contractility of the weakened muscle group.
Law 2
The SA and the AV nodes of the heart plus the aorta baroreceptors (AB) are neural centers which generate nervous impulses (action potentials) as soon as blood pressure at the said baroreceptors reaches a specified value [16-18].
Consequence
-
1) It is just the pressure applied to and sensed by the relevant baroreceptor that initiates generation of the nervous impulses (action potentials) and activates the mechanism of the contractile function of the cardiac and vascular muscle involved.
Law 3
The SA node is responsible for closure of atrioventricular valves.
Consequence
-
1) If the atrioventricular valves cannot complete their closing procedure at the end of the atrial systole phase in a cardiac cycle, the residual pressure in the atrium will act on the SA node and necessarily initiate another atrial contraction that will be reflected as the second P wave on ECG (which is the cause of atrial arrhythmia).
Law 4
The AV node controls three mechanisms responsible for the generation of the specific blood flow pattern. These mechanisms are as follows:
-
1. regulation of diastolic pressure in the aorta (carotid artery);
-
2. generation of vortex-type flows of blood before opening of aortic valve (carotid artery valve), and
-
3. opening of the aortic valve (carotid artery valve).
Consequences
-
1) The generation of the nervous impulse at the AV node in each cardiac cycle occurs three times that manifests itself on an ECG as the QRS-complex, the S-L interval and the L-j phase.
-
2) Under intensive physical exercise, nervous impulses of this sort can be generated up to seven times.
Law 5
The CABs (the carotid artery baroreceptors) undertake to maintain the generated specific blood flow pattern and drive blood in the elevated fluidity regime via the blood vessels throughout the body.
Consequences
-
1) Amplitude of the expansion of the aorta (carotid artery) depends on the blood pressure sensed by the CABs that is reflected as amplitude of the T-wave on ECG;
-
2) Amplitude of the aorta expansion regulates resistance to the blood flow.
Law 6
The ECG amplitude varies in direct proportion to the amplitude of the heart muscle contraction, and the ECG amplitude for the T wave varies directly as the expansion of the aorta.
Consequences
-
1) The ECG amplitude in each cardiac cycle phase depends on metabolic processes that determine the contraction and relaxation of the cardiac and vascular muscles.
On the basis of the above laws and the physical principles of fluid flow in a rigid pipe, it is possible to formulate a set of rules which can be utilized as arguments for an interpretation of the compensatory mechanism of cardiovascular system performance.
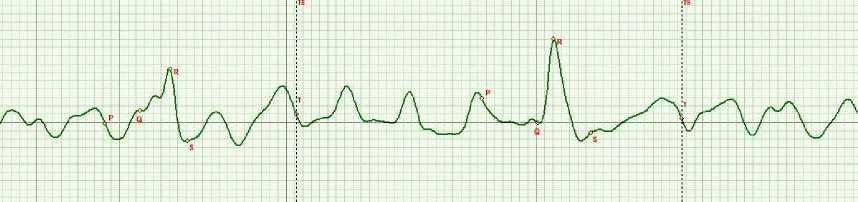
Figure 2. A multiple P wave ECG curve.
Results
The given laws are the most suitable tools for verifying any ECG shape by establishing its correspondence with the relevant biophysical processes which occur in the cardiovascular system. To illustrate this, let us consider some examples.
-
Example 1
Figure 2 displays an ECG curve with multiple P waves. This sort of ECG curves is classified by the classical cardiology as atrial arrhythmia.
Let us consider the given ECG shape using the logics of the proof methods imported from natural sciences as follows:
-
1. In this case, we consider an ECG curve of the ascending aorta to be the most informative graphics that is equivalent to summarized data produced by all conventional standard multi-lead systems.
-
2. To analyze the ECG shape, the above laws taken as arguments and assumed to be in correspondance with the axiomatic logical statements should be used.
-
3. Let us find 3 logically dependent manifestations. They are as follows:
-
3.1 Manifestation 1: Weak myocardium muscle relaxation: no S-wave-effect is detected.
-
3.2 Manifestation 2: The pressure at the SA-node (baroreceptor) remains the same owing to the weak relaxation; the second P wave is generated.
-
3.3 Manifestation 3: The PQ phase is extended, since more time is required to compensate for weakness of myocardial muscle stretching.
-
-
4. Causes leading to the ECG shape changes are determined in terms of physics. The logics of the consideration should identify the primary cause of the changes.
-
5. Modeling of process progression.
Each cardiac cycle phase is limited in its duration. In the given case, the impaired myocardial muscle relaxation cannot provide the proper filling of the ventricles with a sufficient blood volume and the proper closure of the atrioventricular valve (Law 3). Only upon the atrioventricular valve closure, the AV node can start generating the relevant action potential (Law 4). Thus, the SA node remains under the residual atrial pressure that leads to generation of the second P wave. The evidence thereof is an increase in the duration of the PQ phase caused by the weak myocardial muscle stretching.
There are no other ECG shape changes which may be associated with or linked to any other physical processes. In this case, we make a conclusion using the indirect method of proof, namely, the so-called elimination method. It contributes to strengthening the logics of the direct proof method.
Conclusion: the primary cause of the given ECG shape change is the weak myocardial muscle relaxation. It is pathology which is to be treated.
A prerequisite for modeling is that the primary cause of pathology has been properly identified. In the given case, the weak relaxation occurs due to low mitochondria energetic balance only and, first of all, due to low ATP energy. This energy is not high enough to supply the necessary amount of calcium to the cell to reach the required initial level. However, some problems in the coronary blood flow also might be the cause in the case under consideration.
Thus, two prediction cases may be discussed: what will happen if no treatment is performed and what will happen if the proper treatment is carried out?
If no treatment is performed, the weakness of the myocardium will be in further progress, and for the aorta it will be necessary to reduce the blood flow resistance that will be reflected as an increase in the T wave amplitude. It is an indicator of a reduction in the resistance owing to the aorta dilatation. But there are certain limitations in the aorta expansion. If this were the case, the situation would be critical.
-
• Prediction case one: Other processes cannot occur because there are no other causes for that from the point of view of physics (elimination method).
-
• Prediction case two: If to choose the proper treatment, one P wave only will appear on ECG, and the S wave amplitude will increase.
-
6. Under the real conditions, the patient with the above ECG curve has received therapy to recover the coronary blood flow. As a result, our prediction for the above mentioned ECG shape change has become true.
The given logical procedure for finding the primary cause of a disease that is reflected in the ECG shape has been tested in more than 2000 patients. Finally, we have successfully classified all the observed ECG curve variety based on the cardiac cycle phase analysis. Moreover, we have succeeded in predicting the lethal outcome in some patients several tens of minutes before full cardiac arrest. The developed methodology and the appropriate treatment allows for reducing in-hospital mortality by 40%.
It should be noted that additional data obtained by the cardiac cycle phase analysis like non-invasively measured phase-related blood volumes and synchronous point-type aorta rheography provides us with a new reliable tool of verification of every ECG shape change.
-
Example 2
An ECG curve showing the QRS complex of low amplitude and the P and T waves of large amplitudes is presented in Figure 3 below.
Taking into account the above detailed considerations, it is possible to simplify the descriptions following the logics of establishing the primary cause of a disease.
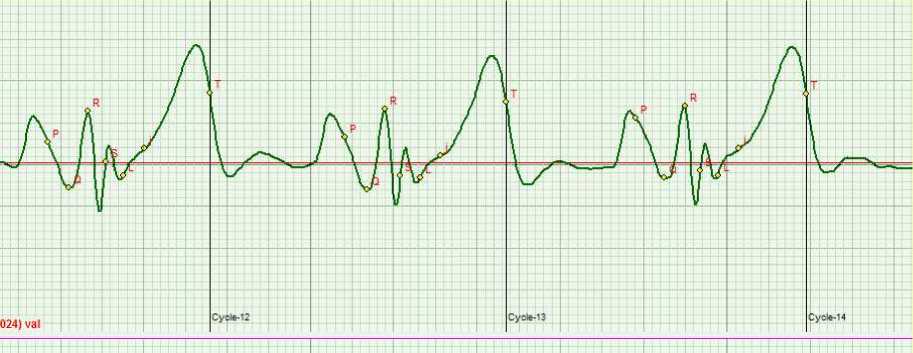
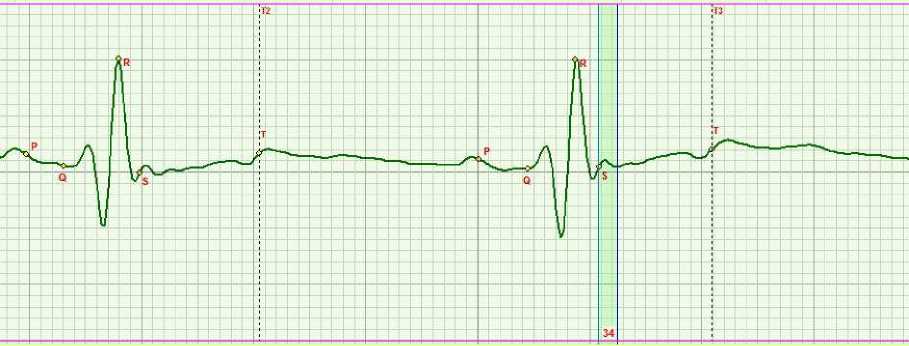
Figure 3. QRS complex of low amplitude and P and T waves of large amplitudes on ECG.
Considering the accepted axiomatics, it is possible to reveal three logically interdependent manifestations:
-
1. Small amplitude of QRS
-
2. Large amplitude of the T wave
-
3. Large amplitude of the P wave.
-
4. Large amplitude of S-L phase.
In our case, we can see one more manifestation which is as follows:
The low amplitudes of the QRS, the R wave and the S wave are indicators of weak energetic processes in mitochondria. There is no other interpretation available. The large P wave amplitude confirms the fact that the heart muscle relaxation is weak. The large T wave is responsible for the aorta expansion, and in the case under consideration it is providing for the reduction in the blood flow resistance in case of a weak heart.
The presence of the large amplitude in the S-L phase contributes additionally to the validation of the above conclusions. It is a marker of significant musculature tension in the phase of preloading that demonstrates the compensatory mechanism.
As a result, we can make a conclusion that the primary cause of the disease is an energetic weakness of ATP in mitochondria of heart muscles. The other cardiovascular functions are within the norm.
The aim of the therapy has been to normalize the function of oxygen transportation chain “serotonin - L carnitine” for oxygen delivery to mitochondria and enhance the Q coenzyme action.
Six months later, the stable therapeutic effect resulted in normalizing the ECG phase amplitudes has been reported for the patient.
-
Example 3
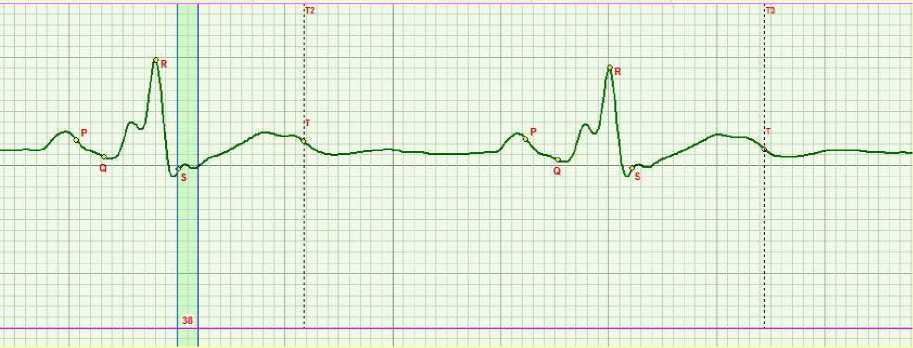
Some ECG curves recorded during orthostatic test are presented in Figure 4 below. In terms of the classical cardiology, these curve shapes are classified as His bundle conduction disorder. However, such a severe pathology cannot be “treated” by changing the body position only as evident from Fig.4. Therefore, the verification assumes a new significance.
a)
b)
Figure 4. ECG of the aorta in lying (a) and sitting (b) position
There are three logically interdependent manifestations on ECG as listed below:
-
1. A weak relaxation of myocardial muscles: no-S-wave effect.
-
2. Reverse of myocardium instead of contraction is observed: a dip at the R wave front edge on the ECG.
-
3. Certain symptoms are available: bursting pain in the left side in the area of the heart apex caused by the reverse of myocardium is reported.
Life expectance of patients showing a phenomenon of this sort is usually long enough. From our experience, we report that we have never achieved normalizing of the reverse motion of the IVS in our patients.
Discussion and conclusions
The basic principles of logics for proof methods imported from natural sciences to cardiology are presented herein. It would serve no purpose to discuss herein the methodology in full. Each case requires its specific comprehensive knowledge. It is just the scientific research philosophy that is the core of successful activities in science.
We have pioneered in the verification by establishing the correspondence of the ECG shape with the relevant biophysical processes exclusively because of the application of the new theory of the cardiac cycle phase analysis [19-26]. A lot of contradictions have been accumulated in the existing cardiology due to the lack of an adequate theory. It is precisely these logical methods of the theoretical analysis and the new knowledge of the cardiac cycle phase structure that allow using the natural science principles of proving procedures in cardiology. Otherwise no success can be achieved.
It opens a new way for creating a principally new ECG classification [19-26] and using the scientific cognition logics for establishing of the primary cause of cardiovascular diseases. The characteristic feature of new potentials of this approach is a simplification of theory and practice cognition. It provides a new tool to make express diagnostics at any time, anywhere. In addition, the new express diagnostic technology is easy in use and cost-effective.
The further development of the logics in cardiology will be connected with expanding the ECG analysis capabilities. We think, first and foremost it might be applied to deriving data on metabolic processes in the cardiovascular system and evaluating psychoanalytic conditions.
Statement on ethical issues
Research involving people and/or animals is in full compliance with current national and international ethical standards.
Conflict of interest
None declared.
Author contributions
The authors read the ICMJE criteria for authorship and approved the final manuscript.
References New philosophy of validation and verification for cardiology: classical proof theory imported from natural sciences
- Knaapen L. Being 'evidence-based' in the absence of evidence: The management of non-evidence in guideline development. Social Studies of Science. October 2013;43(5):681-706.
- Worrall J. Evidence: Philosophy of science meets medicine. Journal of Evaluation in Clinical Practice. April 2010;16(2):356-362.
- Cambrosio A, Keating P, Schlich T, Weisz G. Regulatory objectivity and the generation and management of evidence in medicine. Social Science and Medicine. July 2006;63(1):189-199.
- Vineis P. Evidence-based medicine and ethics: A practical approach. Journal of Medical Ethics. April 2004;30(2):126-130.
- Simms JR. Making the soft sciences hard: The Newton model. Systems Research and Behavioral Science. January 2011;28(1):40-50.
- Rzepiński T. Empirical evidence in a process of clinical decision making [Ewidencja empiryczna w procesie podejmowania decyzji klinicznych]. Filozofia Nauki. 2012;20(3):13-33.
- Von Michalik K, Kwiatkowska M, Kielan K. Application of knowledge-engineering methods in medical knowledge management. Studies in Fuzziness and Soft Computing. 2013;302:205-214.
- Fung YC. Biomechanics: A Survey of the Blood Flow Problem. Advances in Applied Mechanics. 1971;11:65-130 DOI: 10.1016/S0065-2156(08)70341-7
- Jayalalitha G, Shanthoshini DV, Uthayakumar R. Fractal model for blood flow in cardiovascular system. Computers in Biology and Medicine. June 2008;38(6):684-693 DOI: 10.1016/j.compbiomed.2008.03.002
- Krstacic G, Krstacic A, Smalcelj A, Milicic D, Jembrek-Gostovic M. The chaos theory and nonlinear dynamics in heart rate variability analysis: Does it work in short-time series in patients with coronary heart disease? Annals of Non Invasive Electrocardiology. April 2007;12(2):130-6 DOI: 10.1111/j.1542-474X.2007.00151.x
- Krstacic G, Parati G, Gamberger D, Castiglioni P, Krstacic A, Steiner R. Heart rate variability and nonlinear dynamic analysis in patients with stress-induced cardiomyopathy. Medical & Biological Engineering & Computing. October 2012;50(10):1037-46 DOI: 10.1007/s11517-012-0947-z
- Knežević A, Martinis M, Krstačić G, Vargović E. Changes in multifractal properties for stable angina pectoris. Physica A: Statistical Mechanics and its Applications. 2005;358(2-4): 505-515.
- Martinis M, Knežević A, Krstačić G, Vargović E. Changes in the Hurst exponent of heartbeat intervals during physical activity. Physical Review E (Statistical, Nonlinear and Soft Matter Physics). 2004;70(1):1-4.
- Krstacic G, Gamberger D, Smuc T. Coronary Heart Disease Patient Models Based in Inductive Machine Learning. Lecture Notes in Artificial Intelligence. 2001;21(1):113-118.
- Sarayev I, Dovgal V, Kuzmenko A, Semichev A. Myocardial ischemia and determined chaos in integral homeostatic regulation. Journal of Clinical Monitoring and Computing. 2002;17(3-4):167-172.
- Abdul Sukor J, Redmond SJ, Chan GSH, Lovell NH. Signal quality measures for unsupervised blood pressure measurement. Physiological Measurement. March 2012;33(3):465-486.
- La Rovere MT, Maestri R, Pinna GD. Baroreflex sensitivity assessment -latest advances and strategies. US Cardiology. February 2012;9(1):22-25.
- Hainsworth R. Cardiovascular control from cardiac and pulmonary vascular receptors. Experimental Physiology. February 2014;99(2):312-319.
- Rudenko M.Y., Zernov V.A., Voronova O.K. Fundamental Research on the Mechanism of Cardiovascular System Hemodynamics Self-Regulation and Determination of the Norm-Pathology Boundary for the Basic Hemodynamic Parameters and Analysis of the Compensation Mechanism as a Method of Revealing the Underlying Causes of the Disease. Heart Rhythm. November 2012;9(11):1909 DOI: 10.1016/j.jelectrocard.2013.09.016
- Rudenko M.Y., Voronova O.K., Zernov V.A., Makedonsky D.F., et al. Theoretical Principles of Heart Cycle Phase Analysis. München-London-New York: Fouqué Literaturverlag. ISBN 978-3-937909-57-8.
- Rudenko M.Y., Zernov V.A., Mamberger K.K., Rudenko S.M. Heart and aortic baroreceptors: operation in providing hemodynamic processes in cardiovascular system. Cardiometry. November 2013;3:31-44 DOI: 10.12710/cardiometry.2013.3.3144
- Kolmakov SV. Comparative study of measured heart cycle phase durations: standard lead ECG versus original ascending aorta lead ECG. Cardiometry. November 2012;1:143-150 DOI: 10.12710/cardiometry.2012.1.142149
- Zernov V.A., Voronova O.K., Rudenko M.Y., Mamberger K.K., Makedonsky D.F., Rudenko S.M., Fedosov Y.V., Dyuzhikov A.A., Orlov A.N., Sobin S.V. Standardization of the ECG on the basis of cardiac cycle phase analysis. Cardiometry. November 2012;1:102-125 DOI: 10.12710/cardiometry.2012.1.101124
- Rudenko M.Y., Voronova O.K., Zernov V.A., Mamberger K.K., Makedonsky D.F., Rudenko S.M. Theoretical principles of cardiometry. Cardiometry. November 2012;1:7-23 DOI: 10.12710/cardiometry.2012.1.723
- Rudenko M.Y., Zernov V.A., Voronova O.K. Study of Hemodynamic Parameters Using Phase Analysis of the Cardiac Cycle. Biomedical Engineering. July 2009;43(4):151-5 DOI: 10.1007/s10527-009-9121-9
- Rudenko M.Y., Voronova O.K., Zernov V.A. ECG periodic table: a new ECG classification based on heart cycle phase analysis. Cardiometry. May 2013;2:19-28 DOI: 10.12710/cardiometry.2013.2.1928
