Nonlinear Evaluation of Electroencephalogram Signals in Different Sleep Stages in Apnea Episodes

Author: Atefeh Goshvarpour, Ataollah Abbasi, Ateke Goshvarpour
Journal: International Journal of Intelligent Systems and Applications(IJISA) @ijisa
Article in issue: 10 vol.5, 2013.
Free access
Distinct sleep phases are related to different dynamical patterns in electroencephalogram (EEG) signals. In this article, the relationship between the sleep stages and nonlinear behavior of sleep EEG is explored. In particular, analysis of approximate entropy (ApEn) and the largest Lyapunov exponent is evaluated in patients with sleep apnea, which is defined as respiratory flow that is suspended or decreased for more than 10 s. The pathological sleep EEG signals for analysis were obtained from the MIT-BIH polysomnography database available online at the PhysioBank. The results show that for the both normal and apneic sleep epochs, ApEn decreased significantly as the sleep goes into deeper stages. Therefore, it indicated that as sleep becomes deeper, the brain function becomes less activated. Compared with normal sleep, the mean value of largest lyapunov exponents was also significantly lower than that of normal epochs during deep sleep stages. The results also show that the average largest lyapunov exponents of EEG signals increased in the REM state. Because during this stage of sleep, the cortex becomes more active and more neurons incorporate in the information processing. In conclusion, the nonlinear dynamical measures obtained from the nonlinear dynamical analysis such as the approximate entropy and largest lyapunov exponents can be useful for characterizing the physiological or pathological states of the brain.
Approximate Entropy, Electroencephalogram, Largest Lyapunov Exponents, Nonlinear Analysis, Sleep Apnea
Short address: https://sciup.org/15010480
IDR: 15010480
Text of the scientific article Nonlinear Evaluation of Electroencephalogram Signals in Different Sleep Stages in Apnea Episodes
Published Online September 2013 in MECS
The most common respiratory disturbance in human sleeping is sleep apnea. Traditionally, sleep apnea is defined as respiratory flow that is suspended or decreased for more than 10 s. Apnea often means that the amplitude of respiratory flow decreases to below 20%. According to recent epidemiological studies, approximately 20% of people suffer from sleep apnea [1,2].
Typically, Sleep is characterized by a cyclic alternating pattern of non-rapid eye movement (REM) and REM sleep [3-8]. Non- REM sleep includes the deeper stages of sleep (sleep stages 1 and 2, and slow wave sleep with sleep stages 3 and 4), whereas REM sleep is a highly activated state of the brain accompanied by dreaming.
To make the diagnosis of sleep apnea, physiologic monitoring is required. Commonly, the patient sleeps in the sleep laboratory and the measurement of multiple physiological parameters is made. This process is called polysomnography which is the current gold standard. One of the major limitations of polysomnograph in diagnosing sleep breathing disorders is the need for relatively complex procedures as well as bulky and costly equipment.
Alternatively, quantification of breathing abnormalities during sleep, such as sleep apnea can be performed by means of new and sophisticated computer-based signal processing methodologies (both linear and nonlinear approaches), to timely diagnose and treat patients during an early step of the disorder.
These new methods must enable the design of systems to measure sleep and other physiological variables at home providing high accuracy measurements.
Therefore, many novel diagnosis and treatment methods for sleep apnea are proposed by healthcare professionals and sleep researchers in recent years [9,10]. Specifically, capturing and quantifying the dynamical states of the brain during sleep apnea is an important tool in distinguishing normal and pathological sleep and lead to new insights into sleep neurodynamics. The reason can be expressed by terms of due to the cessation of breath in sleep apnea, the subject might experience related changes in the electrical activity of the brain.
Since the electroencephalographic (EEG) signal shows patterns of electrical activity, quantative analysis of this signal provides an objective method for detecting changes in cortical activity. The electroencephalogram is a complex signal resulting from postsynaptic potentials of cortical pyramidal cells. In addition, multiple feedback loops have been detected on each of the hierarchic levels of the central nervous system.
Credibility of using chaos theory and nonlinear methods in the analysis of biological systems was established. Several features of these approaches have been proposed to detect the hidden important dynamical properties of the physiological phenomenon.
Fell et al. [11] have calculated the first lyapunov exponents (L1) for different sleep EEG signals in 15 healthy subjects corresponding to the sleep stages 1—4 and REM. They found statistically significant differences between the values of L1 for different sleep stages. Acharya et al. [12] have studied the normal sleep stages using the nonlinear techniques like: correlation dimension, fractal dimension, largest lyapunov entropy , approximate entropy, Hurst exponent, phase space plot and recurrence plots.
To investigate any possible changes in the human electroencephalographic activity due to Obstructive Sleep Apnoea Hypopnoea Syndrome (mild case of cessation of breath) occurrences, the nonlinear and linear time series methods are applied by Cvetkovic et al [13]. Recently, using nonlinear analysis that quantified the recurrence properties of the EEG, Carrubba et al. [14] described a novel method for producing dynamic markers of brain states during sleep.
In this work, the five different types of sleep stages during apnea is studied using nonlinear parameters: approximate antropy and largest lyapunov exponent.
The outline of this study is as follows. In the next section, we briefly describe the set of EEG time series used in the study. Then, the computation of the approximate entropy and the largest Lyapunov exponent is explained. Finally, the results of present study are shown and the study is concluded.
-
II. Methods2.1 Data Selection
-
2.2 Lyapunov Exponents
In this study, six EEG data for analysis were obtained from the MIT-BIH polysomnography database available from the Physionet databank [15]. It consists of four -channel polysomnographic recordings from male subjects with or without sleep apnea syndrome, each with an EEG signal annotated with respect to sleep stages [16,17]. The mean age of the subjects was 40 (range: 32–56). Records vary in duration from 2 to 7 h and have been sampled at 250 samples per second. Sleep stage was annotated at 30-s intervals according to the criteria of RechtschaHen and Kales with six discrete levels — 1, 2, 3, 4, rapid eye movement (REM) and wake.
Table 1 shows the stage distribution of MIT-BIH polysomnography data that were used in our study.
Table 1: The stage distribution of MIT-BIH polysomnography data used in the current study
|
State |
Apnea |
Normal |
||||||||||
|
Sleep Stage |
Wakefulness |
1 |
2 |
3 |
4 |
REM |
Wakefulness |
1 |
2 |
3 |
4 |
REM |
|
Slp01a |
1 |
0 |
21 |
0 |
0 |
9 |
5 |
0 |
33 |
6 |
1 |
4 |
|
Slp01b |
6 |
9 |
47 |
0 |
0 |
3 |
172 |
18 |
62 |
0 |
0 |
19 |
|
Slp02a |
12 |
8 |
55 |
0 |
0 |
8 |
31 |
4 |
139 |
5 |
2 |
64 |
|
Slp02b |
14 |
5 |
8 |
0 |
0 |
14 |
88 |
5 |
75 |
0 |
0 |
14 |
|
Slp03 |
14 |
61 |
112 |
4 |
0 |
45 |
136 |
43 |
195 |
74 |
0 |
28 |
|
Slp04 |
11 |
28 |
273 |
1 |
0 |
2 |
151 |
29 |
152 |
28 |
0 |
21 |
Since the 30-s intervals of sleep stage 4 are not sufficient, in this study we omitted this stage for further analysis.
Consider two (usually the nearest) neighboring points in phase space at time 0 and at a time t, distances of the points in the ith direction being
II(0)1 and I^ (t)l,
respectively. The lyapunov exponent is then defined by the average growth rate λi of the initial distance
II8xi ( t )l = II S X i И =
(t ^ да )
X i = lim - log2 t ^™ t
II 8 x , (t)
II 8 x , (0)
An exponential divergence of initially nearby trajectories in phase space coupled with the folding of trajectories, ensures that the solutions will remain finite, and is the general mechanism for generating deterministic randomness and unpredictability. Therefore, the existence of a positive λ for almost all initial conditions in a bounded dynamical system is widely used.
In order to discriminate between chaotic dynamics and periodic behavior of signals, lyapunov exponent (λ) is often calculated.
Lyapunov exponent is a measure of the rate at which the trajectories separate from each other. For the chaotic signals the trajectories follow typical patterns in phase space. The trajectories which are closely spaced, converge and diverge exponentially, relative to each other. In addition, for dynamical systems, sensitivity to initial conditions is quantified by the lyapunov exponent (λ). They characterize the average rate of divergence of these neighboring trajectories.
-
- A negative exponent implies that the orbits approach a common fixed point.
-
- A zero exponent means the orbits maintain their relative positions; they are on a stable attractor.
-
- A positive exponent implies the orbits are on a chaotic attractor [18,19].
-
2.3 Approximate Entropy
The reason why chaotic systems, such as brain, show aperiodic dynamics is that phase space trajectory that have nearly identical initial states will separate from each other at an exponentially increasing rate captured by the so-called lyapunov exponent.
Approximate entropy is defined as the logarithmic likelihood that the patterns of the data that are close to each other will remain close for the next comparison with a longer pattern. Therefore, the generalized measure of regularity can be provided by ApEn. A deterministic signal with high regularity has a greater probability of remaining close for longer vectors of the series and hence has a very small ApEn value. In addition, a random signal has a very low regularity and causes high ApEn value.
Approximate entropy is a measure of complexity and is applied to relatively short and noisy data [20,21]. In EEG analysis, there are very few reported results [22] of the application of ApEn.
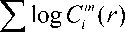
Two parameters m and r must be chosen prior to the computation of ApEn, where m identifies the pattern length and r is the effective filter. Here, one has to compute the correlation integral Cm(r) (with embedding dimension m and time lag 1). This measure is finally obtained as follows:
i L - m
ApEn (m, r, L) = —---£ log Cm *1(r)L - m ,=1
-
L - m + 1
i = 1
Thus, ApEn quantifies the (log) likelihood that sets of patterns that are close on next incremental comparison. Smaller values of ApEn imply a greater likelihood that certain patterns of measurements will be followed by similar measurements. If the time-series is highly irregular, the occurrence of similar patterns in the future is less likely. For this study, m is set to 2 and r is set to 15% of the standard deviation of each time-series.
-
2.4 Statistical Analysis
In this study, the t-test of the null hypothesis that data in the vector x are a random sample from a normal distribution with mean 0 and unknown variance, against the alternative that the mean is not 0 is performed. The result of the test is returned in p-value. P-value→0 indicates a rejection of the null hypothesis at the 5% significance level (p<0.05). P-value→1 indicates a failure to reject the null hypothesis at the 5% significance level.
-
III. Results
An example of electroencephalogram signal (8-s or 2000 sample) is shown in Fig. 1. In this figure, different sleep stages of EEG of a patient during apnea is demonstrated.
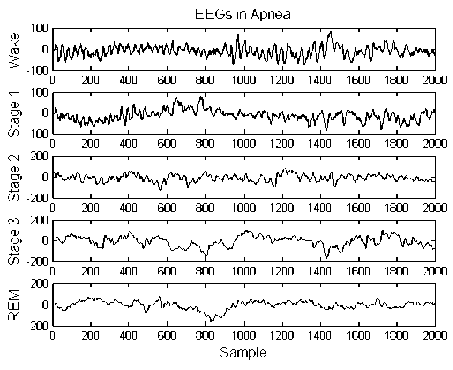
Fig. 1: Example of electroencephalogram signal associated with waking, stage 1, stage 2, slow wave sleep (stage 3 and 4), and REM (from top to bottom) during apnea in a subject
calculated. The mean and standard deviation of largest lyapunov exponents and approximate entropy in normal and apnea episodes are displayed in Table 2 and Table 3, respectively.
As shown in Table 2 and Table 3, the largest lyapunov exponent has higher mean value for wakening state in normal and apneic states due to the highly active cortex and desynchronized EEG signals. In this state, the EEG signals are highly chaotic; whereas, this value falls gradually in sleep 1-4 states both in normal and pathological states.
One may state that this decrement is due to the reduction in the variability of EEG signals or it may be claimed that the cortex is more inactive in these states than that of the wakefulness. Since the variation of EEG signals is increased in the REM state, it is expected that the lyapunov exponent increases (as one can see in Table 2 and Table 3).
Largest lyapunov exponents and approximate entropy of EEG signals of all subjects for each sleep stage are
Table 2: Result of nonlinear parameters of normal EEGs for various sleep stages
|
Parameters |
Wakefulness |
1 |
Normal 2 3 |
4 |
REM |
|
|
ApEn |
0.34±0.44 |
1.21±0.28 |
0.31±0.44 |
0.26±0.4 |
0.29±0.22 |
0.2±0.33 |
|
Lya |
0.84±0.11 |
0.76±0.1 |
0.68±0.11 |
0.52±0.07 |
0.47±0.02 |
0.74±0.06 |
Note- ApEn: approximate entropy; Lya: Lyapunov exponent.
Table 3: Result of nonlinear parameters of apneic EEGs for various sleep stages
|
Parameters |
Wakefulness |
1 |
Normal 2 |
3 |
REM |
|
ApEn |
0.27±0.35 |
0.18±0.3 |
0.32±0.45 |
0.13±0.24 |
0.16±0.25 |
|
Lya |
0.82±0.12 |
0.76±0.08 |
0.69±0.08 |
0.55±0.09 |
0.73±0.06 |
Note- ApEn: approximate entropy; Lya: Lyapunov exponent.
For the average lyapunov exponent results, a decrease was revealed from normal (mean=0.8422, SD=0.1067 and mean=0.7417, SD=0.0607 for waken and REM stages, respectively) to during-apnea (mean=0.82, SD=0.1174 and mean=0.7352, SD=0.0569 for waken and REM stages, respectively) at waken and REM stages, as shown in Table 2 and Table 3; whereas, this value was increased from normal to apneic EEGs in the other states.
As an example, the variation of the approximate entropy in sleep 3 stage in normal and during apnea for one subject is shown in Fig. 2.
As shown in Table 2 and Table 3, the mean approximate entropy was decreased from normal to apnea episodes in all stages (except for stage 2 of sleep in which this value was approximately remained constant).
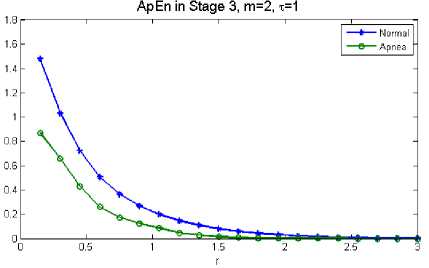
Fig. 2: Example of EEG ApEn in stage 3 of sleep for a subject in normal and during apnea
Statistical test (t-test) was utilized to determine whether or not there is statistical significance in features between two different groups. It was demonstrated that normal and apneic values of ApEn in all stages have a statistically significant difference, with all p<0.05.
-
IV. Discussion
It was shown that the biological system in an unhealthy condition lacks the nonlinear properties and is marked by periodical dynamics and loss of the ability to adapt. Therefore, in this study, two nonlinear parameters (approximate entropy and largest lyapunov exponents) of overnight EEG were evaluated in normal and apnea episodes.
The results demonstrated that for the both normal and apneic sleep epochs, ApEn decreased significantly as the sleep goes into deeper stages. In addition, it indicated that as sleep becomes deeper, the brain function becomes less activated. The results of the current study are consistent with previous studies in which it has shown that, as sleep becomes deeper, the complexity of brain activity characterized by fractal dimension of EEG signal was reduced [23].
During deep sleep stages the mean value of largest lyapunov exponents in apnea episodes was also significantly lower than that of normal epochs (as demonstrated in Table 2 and Table 3). Because the EEG activity is most regular in deeper stages. This regularity leads to lower values of largest lyapunov exponents that we obtained. As a result, one can claim that there is a loss in complexity or dimensionality of the underlying dynamics of neuronal networks corresponding to deeper sleep stages.
The results also showed that the average largest Lyapunov exponents of EEG signals are increased in the REM state (as demonstrated in Table 2 and Table 3). As the blood flow of the brain is increased during this stage of sleep, the cortex becomes more active and more neurons incorporate in the information processing. This result is in line with the previous studies. By analyzing the correlation dimensions, Kobayashi et al. [24] showed that this measure also decreased from the ‘awake’ stage to sleep stages 1—3 and increased during rapid eye movement sleep of a healthy male subject. Acharya et al. [12] have also represented that nonlinear parameters (correlation dimension, fractal dimension, largest lyapunov entropy, approximate entropy, Hurst exponent) of healthy volunteers decreased from sleep state 0 (wake) to 4 and these values increased in sleep 5 state (REM). The results from the Cvetkovic et al. [13] study indicated that at C3 EEG electrode site the average lyapunov exponent values were significantly lower during the hypopoea (a certain class of apnea in which the amplitude of respiratory flow decreases between 20% and 50%) in comparison to pre-hypopnoea.
-
V. Conclusion
In this work, we have analyzed the cortical functioning at different pathological sleep stages using the nonlinear parameters: approximate entropy and largest lyapunov exponents. The results of this article suggested that the underlying dynamics of neuronal networks in the brain associated with different sleep stages and in different states (normal against pathological) are different. In addition, the nonlinear dynamical measures obtained from the nonlinear dynamical analysis such as the approximate entropy and largest lyapunov exponents can be useful for characterizing the physiological or pathological states of the brain.
There are some limitations for our analysis. For example, it is desirable to study these parameters separately in different apnea classes such as central, obstructive and mixed apnea syndromes. Although our results show that the nonlinear parameter was significantly different in various sleep stages, further studies with a larger sample size are required to prove the usefulness of this methodology. According to the clinical guideline, sleep apnea is divided into mild, moderate and severe, based on the apnea/hypopnea index [25]. Therefore, the association between the nonlinear parameters and severity of symptoms will also be very informative and should be included in the design of the future study protocols.
References Nonlinear Evaluation of Electroencephalogram Signals in Different Sleep Stages in Apnea Episodes
- Friedman M, Bliznikas D, Klein M, Duggal P, Somenek M, Joseph NJ. Comparison of the incidences of obstructive sleep apnea/hypopnea syndrome in African-Americans vs. Caucasians. Otolaryngol Head Neck Surg. 134 (2006) 545—550.
- Huang S.G., Li Q.Y., Sleep respiratory disorder study group, respiratory disease branch, Shanghai medical association, Chin. J. Tuberc. Respir. Dis. 26 (2003) 268.
- Dijk D.J, Shanahan T.L, Duffy J.F, Ronda J.M, Czeisler C.A. Variation of electroencephalographic activity during non-rapid eye movement and rapid eye movement sleep with phase of circadian melatonin rhythm in humans, J. Physiol. 505 (1997) 851—858.
- Agnew H.W, Webb W.B, Williams R.L. Sleep patterns in late middle age males: an EEG study, Electroencephalogr. Clin. Neurophysiol. 23 (1967) 168—171.
- Bes F., Schulz H., Navelet Y., Salzarulo P. The distribution of slow-wave sleep across the night: a comparison for infants, children and adults, Sleep 14 (1991) 5—12.
- Bixler E.O., Kales A., Jacoby J.A., Soldatos C.R., Vela-Bueno A. Nocturnal sleep and wakefulness: effects of age and sex in normal sleeper, Int. J. Neurosci. 23 (1984) 33—42.
- Bliwise D.L. Sleep in normal aging and dementia, Sleep 16 (1993) 40—81.
- Feinberg I., Koresko R.L., Heller N. EEG sleep patterns as a function of normal and pathological aging in man, J. Psych. Res. 5 (1967) 107—144.
- Agarwal R. Automatic detection of micro-arousals. In Proceedings of the 27th IEEE international conference on engineering in medicine and biology society, (2006) 1158—1161.
- Hsu C-C., Shih P-T. A novel sleep apnea detection system in electroencephalogram using frequency variation, Expert Systems with Applications 38 (2011) 6014–6024
- Fell J., Roschke J., Beckmann P. Deterministic chaos and the first positive Lyapunov exponent: a nonlinear analysis of the human electroencephalogram during sleep, Biol. Cybernet. 69 (2) (1993) 139—146.
- Acharya U.R., Faust O., Kannathal N., Chua T., Laxminarayan S. Non–linear analysis of EEG signals at various sleep stages, Computer Methods and Programs in Biomedicine 80 (2005) 37—45
- Cvetkovic D., Ubeyli E.D., Holland G., Cosic I. Alterations in sleep EEG activity during the hypopnoea episodes, J. Med. Syst. 34 (2010) 485—491
- Carrubba S., Kim P.Y., McCarty D.E., Chesson Jr. AL., Frilot C., Marino A.A. Continuous EEG–based dynamic markers for sleep depth and phasic events. Journal of Neuroscience Methods 208 (2012) 1—9
- www.physionet.org
- Ichimaru Y., Moody G.B. Development of the polysomnographic database on CD-ROM, Psychiatry and Clinical Neurosciences 53 (1999) 175—177
- Goldberger A.L., Amaral L.A.N., Glass L., Hausdor J.M., Ivanov P.Ch., Mark R.G., Mietus J.E., Moody G.B., Peng C.K., Stanley H.E. PhysioBank, PhysioToolkit, and Physionet: components of a new research resource for complex physiologic signals. Circulation 101(1999) e215–e220.
- Haykin S., Li X.B. Detection of signals in chaos. Proc IEEE, 83(1) (1995) 95–122.
- Abarbanel H.D.I., Brown R., Kennel M.B. Lyapunov exponents in chaotic systems: their importance and their evaluation using observed data. Int. J. Mod. Phys. B. 5(9) (1991) 1347–1375.
- Pincus S.M. Approximate entropy as a measure of system complexity, Proc. Natl. Acad. Sci. U.S.A. 88 (1991) 2297—2301.
- Pincus S.M., Goldberger A.L. Physiological time-series analysis: what does regularity quantify? Am. J. Physiol. 266 (1994) H1643—H1656.
- Diambra L., Bastos de Figuereda J.C., Malta C.P. Epileptic activity recognition in EEG recording, Physica A 273 (1999) 495—505.
- Zhang J., Yang X.C., Luo L., Shao J., Zhang C., Ma J., Wang G.F., Liu Y., Peng C.-K., Fang J. Assessing severity of obstructive sleep apnea by fractal dimension sequence analysis of sleep EEG, Physica A. 388 (2009) 4407—4414
- Kobayashi T., Misaki K., Nakagawa H., Madokoro S., Ihara H., Tsuda K., Umezawa Y., Murayama J., Isaki K. Nonlinear analysis of the sleep EEG, Psychiatry Clin. Neurosci. 53 (2) (1999) 159—161.
- Tong M.R., Pei L., Tong M.Q., Susumu S. Textbook of Polysomnogramology, People's Military Medical Press, Beijing, 2004.
