Nonparametric method for testing the hypothesis of independence of random variables and its application in the analysis of remote sensing data

Author: Sharueva А.V.
Journal: Siberian Aerospace Journal @vestnik-sibsau-en
Section: Informatics, computer technology and management
Article in issue: 1 vol.26, 2025.
Free access
Testing the hypothesis of independence of random variables is one of the main stages of sys-tem analysis of statistical data. Based on its results, the synthesis of effective decision-making algorithms is carried out. The traditional method of testing the hypothesis of independence of random variables is based on the use of the Pearson criterion, which contains a difficult to formalize stage of dividing the range of the values of random variables into multidimensional intervals. A method for testing the hypothesis of independence of random variables is proposed, which uses a nonparametric pattern recognition algorithm corresponding to the maximum likelihood criterion. Its application makes it possible to circumvent the problem of decomposing the range of the values of random variables into intervals. The idea of the approach is to form a training sample based on the initial statistical data to solve a two-alternative pattern recognition problem. Each class is defined under the assumption of independence or dependence of random variables, which is manifested in the difference in their distribution laws in the classes. Under these conditions, it becomes possible to replace the initial hypothesis with the task of checking the reliability of the difference in the probabilities of pattern recognition errors in classes. Using the apparatus of graph theory, the proposed method is developed in the formation of sets of independent random variables. The obtained results are generalized when testing the hypothesis of independence of random variables for large volumes of statistical data based on compression of the original information. This allows increasing the computational efficiency of the problem being solved. The article substantiates the method for testing the hypothesis of independence of random variables, based on the use of a nonparametric pattern recognition algorithm in conditions of large volumes of statistical data. The results of comparing the technique with the generally recognized Pearson consensus criterion in the study of ambiguous dependences between random variables of varying complexity are presented. The effectiveness of the proposed method is confirmed by the results of its application in processing remote sensing information from anthropogenic territories in the vicinity of the city of Krasnoyarsk.
Testing the hypothesis of independence of random variables, kernel probability density esti-mation, regression probability density estimation, pattern recognition, Pearson criterion, remote sensing
Short address: https://sciup.org/148330597
IDR: 148330597 | UDC: 519.7 + 004.93 | DOI: 10.31772/2712-8970-2025-26-1-48-59
Text of the scientific article Nonparametric method for testing the hypothesis of independence of random variables and its application in the analysis of remote sensing data
The universal and generally accepted criterion for testing hypotheses about the distributions of random variables, including their independence, is the Pearson criterion [1]. When using it, it is necessary to solve the problem of partitioning the area of values of random variables into multivariate intervals and to establish the law of distribution of the criterion that determines the dependences between the probabilistic characteristics of random variables. In [2–4] a new approach is proposed that allows simplifying the test of the hypothesis of independence of random variables using a nonparametric algorithm of nuclear-type pattern recognition corresponding to the maximum likelihood criterion. The idea of the approach is to solve a two-alternative problem of pattern recognition. The classes being considered are defined by assumptions about dependence and independence of random variables. On this basis, a training sample is formed from the initial statistical data on observations of random variables and the problem of pattern recognition is solved. The ratio between the estimates of recognition error probabilities of the introduced classes confirms or refutes the hypothesis being considered.
The purpose of this paper is to generalise and develop a nonparametric method of testing the hypothesis of independence of random variables for conditions of the large volume of statistical data and its application in the analysis of information on remote sensing of anthropogenic territories.
Methodology for testing the hypothesis of independence of random variables
Let there be a sample V = ( x i , i = 1, n ) of the n volume, composed of independent observations of a two-dimensional random variable x = ( x 1 , x 2 ) . Let us suppose that the V sample is drawn from the general population characterised by the densities of the probabilities p ( x 1 ) p ( x 2 ) or p ( x 1 , x 2 ) . On the basis of statistical data of V it is necessary to test the hypothesis
H о : P ( x i , x 2 ) = P ( x i ) P ( x 2 )
of independence of random variables x 1 , x 2 .
To test the H0 hypothesis let us solve the two-alternative problem of pattern recognition. By classes Q1, Q2 areas of definition for probability densities p (x1) p (x2), p (x1, x2) are meant. Under these conditions, the Bayesian decision rule corresponding to the maximum likelihood criterion has the following form m (x): <
x eQ 1 , if p ( x i , x 2 ) < p ( x i ) p ( x 2 ) , x 6^ 2 , if p ( x 1 , x 2 ) > p ( x 1 ) p ( x 2 ) •
In contrast to the traditional formulation of the pattern recognition problem, while synthesizing a decisive rule m ( x ) there is no a priori training sample containing information about the belonging of the V sample elements to one or another class. This information must be discovered in the process of implementation of the H 0 hypothesis testing methodology, which is based on the following actions.
From the V sample recover probability densities p (x1, x2), p (x1) p (x2), using their nonparametric Rosenblatt – Parzen type estimates [5; 6], p (xi, x 2 ) =
n c 1 c 2
n
Z F i=1
i x1 x1
V c 1 J
F
x 2
_
x 2 i
V c 2
J
p ( x1) p ( x 2 ) =
nn
ZZF
n c 1 c 2 i = 1 j = 1
x 1
_
xJ
j x x
F 2 2
V c 1 J
V c 2 J
In the statistics p ( x 1, x 2 ) , p ( x 1 ) p ( x 2 ) nuclear functions F ( u v ) satisfy the conditions of positivity, symmetry and normalization.
The values of blurring coefficients cv , v = 1, 2 of the nuclear functions decrease as the n volume of the V sample of statistical data increases. Then the nonparametric decision rule for classification of random variables x = (x1, x2) is written as follows m (x): -
x 61 , if p ( x 1 , x 2 ) < p ( x 1 ) p ( x 2 ) , ч x 6^ 2 , if p ( x 1 , x 2 ) > p ( x 1 ) p ( x 2 ) •
The optimal blurring coefficients of the nuclear functions of the m ( x ) decision rule are chosen on the basis of the analysis of approximation properties of nonparametric estimates of probability densities p ( x 1, x 2 ) , p ( x 1 ) , p ( x 2 ) from the minimum condition, their corresponding estimates of standard deviations from the p ( x 1, x 2 ) , p ( x 1 ) , p ( x 2 ) . For example, for p ( x 1 ) such a criterion is [7-11]
^ ? n / \ jp 2 (x1) dx1 --£ p (x1).
-M j =
Let us define the estimates of probabilities of pattern recognition errors p 1 ( c ( 1 ) ) , p 2 ( c ( 2 ) ) using the m ( x ) dsision rule on the basis of raw statistical data of V at optimal blurring coefficients c ( 1 ) = ( C 1 ( 1 ) , c 2 ( 1 ) ) , c ( 2 ) = ( C 1 ( 2 ) , c 2 ( 2 ) ) of the nuclear functions of statistics p ( x 1 ) p ( x 2 ) , p ( x 1 , x 2 ) respectively.
The values p t ( c ( 1 ) , c ( 2 ) ) are calculated in the ‘rolling examination’ mode on the V sample assuming that its elements belong to the Q t class.
n pt (c (1), c (2))= - £1(5( j), 5( j)), t = 1,2, nj=1
where S ( j ) = t are designations of the type of x t = ( x t , x t ) gQ t ;
« ( j ) =
t , if x j e Q t
0, if x j £ Q t
-
- «solving» the algorithm of m ( x ) about the belonging of the xj situation to on of the classes Q t , t = 1,2.
While calculating p t ( c ( 1 ) , c ( 2 ) ) in accordance with the ‘rolling examination’ methodology the situation xj = ( x j , x 22 ) from the V sample, which is fed into the algorithm of m ( x ) for control, is excluded from the process of producing statistics p ( x 1 , x 2 ) , p ( x 1 ) p ( x 2 ) .
The indicator function is defined by the expression
1( Ш). ад)=М 8 (» =* < j ) • ( (■" ■ w,) ( 1, (r 8 ( j ) ^s ( j ) .
Let us denote by p t the value of the estimation of the probability of pattern recognition error assuming that the V sample elements belong to the class Q t , t = 1,2. Let us compare the values p 1 , p 2 .
Then the H 0 hypothesis is valid if p 1 < p 2. Otherwise, at p 2< p 1 the random variables x 1 and x 2 are independent.
When the n volume of the V smple is limited, the problem of confidence estimation of probabilities of pattern recognition errors arises. For its solution, the traditional methodology of confidence estimation of probabilities or Kolmogorov – Smirnov criterion is used.
For example, when using the Kolmogorov - Smirnov criterion, the deviation D 12 =|p 1 -p 2| is compared to the threshold value [12]
D
Here p is a probability (risk) of rejecting the hypothesis H 0 : p 1 = p 2 . If the ratio D 12 < D p is satisfied, then the H 0 hypothesis is valid and the risk of rejecting it does not exceed the value of p . At D 12 > D p the H 0 hypothesis rejected.
Formation of sets of independent random variables
There is a sample of observations V = ( xv, , v = 1, k , i = 1, n ) of the n volume composed of statistically independent observations of the components of the multivariate random variable x = ( xv , v = 1, k ) . The type of the p ( x ) probability density function is unknown a priori. It is necessary according to the statistics of V , using the hypothesis testing criterion proposed above [13–16]
H vj : P ( x v , x j ) = P ( x v ) P ( x j )
For the components x v , v = 1, k , x j , j = 1, k , v > j , to form the sets of the independent random variables x ( t ) = ( xv , v g It ) , t = 1, m . The m number of sets of components of the random variable x is unknown, and It is a set of component numbers that make up the set x ( t ) .
The proposed methodology is based on performing the following steps:
-
1. In accordance with the above recommendations, to test the Hv j hypotheses for each pair of the components ( xv , x j ) of the multivariate random variable x = ( xv , v = 1, k ) . The number of such pairs corresponds to the value k ( k - 1)/2 .
-
2. Based on the results of step 1, construct an information graph G ( X , A ) , where X is a set of its vertices corresponding to the components of the random variable x , and A is a set of edges. Between the two vertices xv , xj there is an edge if the Hv j hypothesis is satisfied, i.e. the components xv , xj are independent.
-
3. Analyse the information graph G ( X , A ) and determine its complete subgraphs G ( Xt , A t ) , t = 1, m . Each vertice of the subgraph G ( Xt , A t ) has an edge if the components of the random variable x are independent. Detect complete subgraphs using algorithms for cutting the original graph, which are based on analysing its adjacency matrix. The components xv , v g It correwsponding to the vertices of the complete subgraph G ( Xt , At ) form a set of independent random variables.
Modification of the method of testing the hypothesis of independence of random variables in conditions of large volumes of statistical data
With large n volumes of the statistical data V = ( x i , x 2 , i = 1, n ) regression estimates of probability densities p ( x 1 , x 2 ) , p ( x 1 ) , p ( x 2 ) are used in the proposed methodology. These estimates are based on the compression of the original information, e.g., V 1 = ( x i , i = 1, n ) into the data array V 1 = ( p i j , z j , j = 1, N ) by decomposing the area of values x 1 into N intervals. Here zj are centres of sampling intervals of values x 1 , and p 1 j = P 1 j /А is probability density estimation in the j th interval; A is a sampling interval length; P 1 j is frequency of occurrence of the x 1 i values from the V 1 sample in the interval numbered j . Then the regression estimate of the probability density function p ( x 1 ) according to V 1 has the form [17; 18]
j x1 - z
. c 1 >
.
1N p (x1 ) = “E P1 jф с1 j=1
The proposed approach allows reducing by orders of magnitude the n volume of initial statistical information when estimating probability densities. The peculiarity of the statistics of the p (x1) type allows simplifying considerably the choice of coefficients of с blurring of nuclear functions in the p (x1) statistics from the condition of minimum criterion
|£( p i - p ( x i ) ) .
I = 1
By analogy the estimation of the probability densities p ( x 2 ) , p ( x 1 , x 2 ) is carried out. Regression estimates of probability densities are used in testing the hypothesis of independence of random variables according to the proposed methodology.
Analysing the results of the computational experiment
The effectiveness of the proposed method of testing the hypothesis of independence of twodimensional random variables and Pearson's criterion in the conditions of ambiguous dependences at different volumes of statistical data has been compared [19–21]. The sensors of random variables x 1 , x 2 were formed on the basis of the uniform distribution law x 1 , which was used in the calculation of the values of x 2 in the form of nonlinear transformations x 1 . At the same time the values of x 2 were superimposed with disturbances with the normal distribution law, which has zero mathematical expectation and standard deviation c . An example of the values of random variables x 1 and x 2 is shown in Fig. 1.
*2 9 n2
Рис. 1. Значения случайных величин x 1 , x 2 из выборки исходных статистических данных V при n = 500 и c = 0,5 (темные точки), а при c = 2 (серые точки) при использовании зависимостей различной сложности
9 i
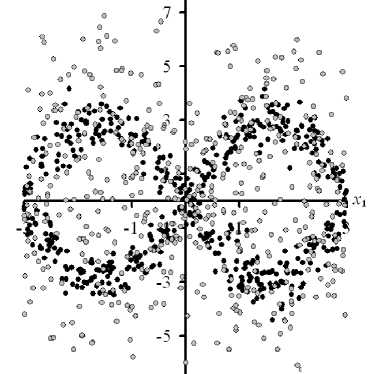
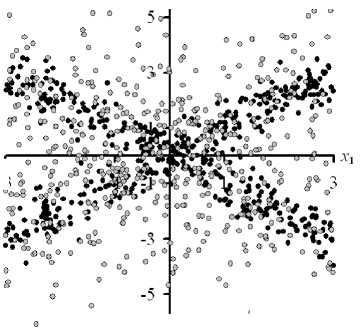
Fig. 1. Values x 1 , x 2 of random variables from a sample of initial statistical data V at n = 500 and c = 0.5 (dark dots), and at c = 2 (grey dots) when using dependencies of varying complexity
When testing the independence hypothesis of a two-dimensional random component based on the Pearson criterion, the results of the optimal selection of the number of sampling intervals are used [22–24]
x 1, x 2
да да
The value ||p (x1, x2 )|| = J J P2 (xi, x2) dx1 dx2 , and Av is the length of the interval between val-да -да ues of the random value xv , v = 1.2. The works [25–27] are devoted to the traditional formulas of discretization of the range of values of random quantities.
By the results of computational experiment the offered methodology and Pearson's criterion at the analysis of ambiguous dependences between random variables in conditions of relatively small volumes of statistical data and mean square deviations a of interferences are comparable and unmistakably determine dependence of random variables. This conclusion does not hold for the dependence between random variables (Fig. 1, a ), when the Pearson criterion does not establish dependence under the conditions n = 100 and a e [0.5; 2]. As a increases, the efficiency of the criteria being compared decreases. This fact is explained by the peculiarities of ambiguous dependences and large values of a , when the area of definition of random variables hides the desired dependence. With the increase in the n volume of initial data the efficiency of the compared criteria for testing the hypothesis of independence of random variables increases. This conclusion is expected, since asymptotic properties of nonparametric estimates of probability densities and frequencies of occurrence of random variables in their two-dimensional intervals rise as n increases. The advantage of the proposed methodology for testing the hypothesis of independence of random variables is observed at small values of a , limited and large n . At large n and a , the advantage of Pearson's criterion is often revealed if the procedure of optimal discretisation of the area of values of a two-dimensional random variable is used [22].
Application of the proposed methodology in analysing remote sensing data
The developed methodology was tested when analysing the remote sensing data [2; 28]. The object of the study is anthropogenic territories (quarry, suburban development) in the vicinity of the city of Krasnoyarsk. The initial information was formed on the fragments of Sentinel-2 satellite imagery on 26.08.2021 (Fig. 2). The spectral channels x j , j = 1,9 were used. These channels are characterised by wavelengths (nanometres): x 1 – (458–523), x 2 – (543–578), x 3 – (650–680), x 4 – (698–713), x 5 – (733–748), x 6 – (773–793), x 7 – (785–899), x 8 – (1565–1655), x 9 – (2100–2280).
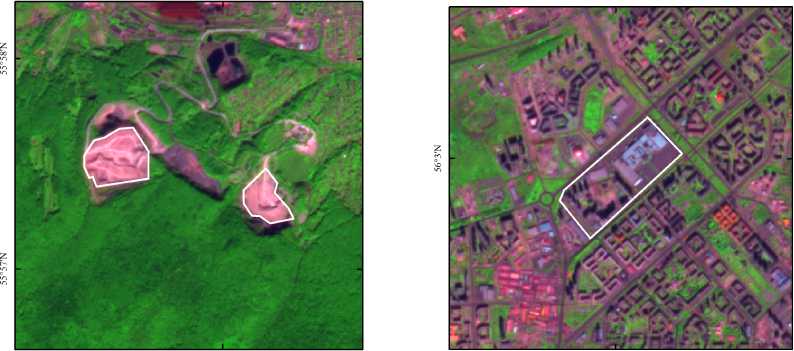
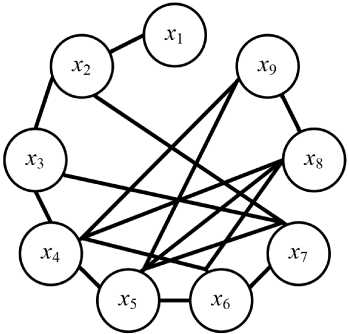
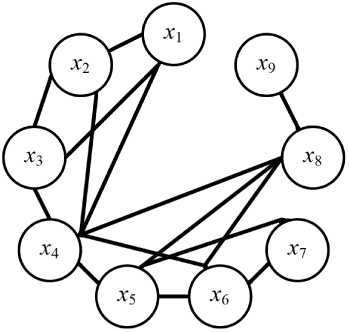
The proposed methodology allows forming pairs of independent and dependent random variables by changing the ratio between their parameters. The application of the methodology allowed us to detect 31 and 29 pairs of spectral features with strong linear dependence for the objects ‘quarry’ and ‘suburban development’, respectively. The obtained results are presented in Fig. 3.
Additionally, non-linear dependences between spectral features were found for the object ‘quarry’
( x i, x 9
) , ( x i, x 8 ) , ( x i, x 7 ) , ( x i , x 5 ) , ( x i, x 4 )
and the object ‘suburban development’
( x7
x 9
) , ( x 4, x 9
) , ( x 3 , x 9
) , ( x 2 , x 9
) , ( xi, x 9
) , ( x i , x 8 ) , ( x i , x 7 )
The obtained results are reliable for all pairs of spectral features, since the condition | p i - p 2 1 > D p is met at D p = 0.029 and the risk P = 0.025 reject the H 0 hypothesis of equality of values p i, p 2 .
а
b
Рис. 2. Фрагменты спутниковой съемки Sentinel-2. Антропогенные территории: a – карьер; b – пригородная застройка
Fig. 2. Fragments of Sentinel-2 satellite imagery. Anthropogenic territories: a – quarry; b – suburban development
a b
Рис. 3. Иллюстрация сильной линейной зависимости между парами спектральных признаков ( x i , X j ) , характеризующихся оценками коэффициентов корреляции больше 0,9: a – карьер; b – пригородная застройка
Fig. 3. Illustration of a strong linear relationship between pairs of spectral features ( x i , X j ) characterized by correlation coefficient estimates greater than 0.9: a – quarry; b – suburban development
The problem of detecting anthropogenic areas from spectral data is considered. The error of their recognition in the space of spectral features x = ( X j , j = 1,9 ) based on the training sample V = ( xl , o ( i ) , i = 1, n ) is equal to 0.012, where n = n 1 + n 2 , n 1 = 3377 (‘quarry’, o ( i ) = 1), n 2 = 5049
(‘Suburban Development’ o( i) = 2). When excluding from the training sample, for example, the spectral features (x4, x5), (x5, x6), (x4, x5, x6) the estimates of pattern recognition errors correspond to the values 0.011; 0.01; 0.008. The obtained reduction in pattern recognition errors is not reliable com- pared to the error estimate in feature space Xj, j = 1,9. Nevertheless, the obtained result justifies the possibility of reducing spectral features in the synthesis of decision-making algorithms and simplifying their optimisation.
Conclusion
The methodology of testing the hypothesis of independence of pairs of random variables, based on the use of nonparametric algorithm of pattern recognition, allows bypassing the problem of discretisation of the area of the values of random variables into multidimensional intervals. This problem is inherent in the generally recognised Pearson criterion. The conditions of competence of the proposed method and Pearson's criterion in the analysis of unambiguous and ambiguous dependences between random variables are determined. Using the apparatus of graph theory, the proposed method is developed in the formation of sets of independent random variables. The obtained results are generalised in testing the hypothesis of independence of random variables for large volumes of statistical data on the basis of compression of initial information, which allows increasing by orders of magnitude the computational efficiency of the problems being solved. The effectiveness of the proposed methodology is confirmed when analysing remote sensing data of anthropogenic territories and assessing their states. In the presence of a set of spectral features characterised by a strong linear dependence between its pairs, it is possible to reduce the number of spectral features in the recognition of anthropogenic territories with a decrease in the estimate of the probability of error in their recognition.
