On Construction of Gene-PDB Structure Mapping with Applications in Functional Annotation of Human Genes

Author: Xi Chen, Hao Jiang, Wai-Ki Ching, Limin Li
Journal: International Journal of Information Technology and Computer Science(IJITCS) @ijitcs
Article in issue: 2 Vol. 3, 2011.
Free access
Protein 3D structure is one of the key factors in recognizing gene functions. The availability of protein structure data in Protein Data Bank (PDB) enables us to conduct gene function analysis. However, the molecules in the PDB, whose structures have been determined, are always not corresponding to a unique gene. That is to say, the mapping from gene to PDB is not one-to-one. Thus this uncertain property complicates the analysis and increases the difficulty of gene function analysis. In this paper, we attempt to tackle this challenging issue and we study the problem of predicting gene function from protein structures based on the gene-PDB mapping. We first obtain the gene-PDB mapping, which is important in representing a gene by the structure set of all its corresponding PDB molecules. We then define a new gene-gene similarity measurement based on the structure similarity between PDB molecules. We further show that this new measurement matches with gene functional similarity nicely. This means that the measurement we introduced here can be useful for gene function prediction. Numerical examples are given to demonstrate our claim.
Classifiction, Gene Functions, Protein Structures, Prediction, Similarity
Short address: https://sciup.org/15011617
IDR: 15011617
Text of the scientific article On Construction of Gene-PDB Structure Mapping with Applications in Functional Annotation of Human Genes
Published Online March 2011 in MECS
Genes and proteins both play important role in a lot of biological processes and functions in a cell and living organisms. Therefore functional annotation of genes is a fundamental problem in the post-genomic era. However, even for yeast, one of the most well-studied organisms, still there are about one-fourth of all genes remain uncharacterized according to SGD (Saccharomyces Genome Database) [18]. This indicates that gene annotation is a challenging problem. Various types of data have been used for predicting gene functions in the literature. These include gene sequences, gene expressions, protein sequences, protein structure, proteinprotein interactions and phylogenetic profiles, see for instance [13], [14], [16] and the references therein. Although gene sequences and microarray expressions are useful information which can be measured for any gene, a problem is that each of these two information sources has its own flaws. Sequence similarity is, in most cases, correlated to functional similarity, but there exist exceptions. In fact it has been reported that even highly aligned sequences have totally different functions in some cases [17]. Microarray expressions have problems in their data quality, e.g. bad probes can be contained and elements in an expression matrix can be corrupted [21]. Even though there are statistical methods for the estimation of such missing data [9], still one cannot avoid the statistical errors.
Protein 3D structure can represent a protein more precisely than the protein sequence. Thus it can reflect more information about the functions of the captured protein. In this paper we address the issue of predicting gene functions based solely on the protein 3D structures. PDB is a central repository for all 3D structure for molecules including DNA, protein and other macromolecules. It is well known that very often proteins transcripted from a gene are not unique, and a protein may also be transcripted from more than one gene. This kind of multiple-to-multiple mapping makes the gene function analysis complicated and challenging. Here we represent each gene by the set of the structures of its related proteins, and we then define a similarity measurement for genes by comparing their representing sets. We note that genes can be considered as nodes in a weighted graph, where the weightings of the edges are the similarity scores. By making use of this mathematical framework, gene functions can be predicted based on this gene network.
Furthermore if we fix the set of gene functions beforehand, the problem can be a multi-class classification problem, and in fact classification techniques such as Support Vector Machine (SVM) have been already applied to gene annotation [7] though the data is not confined to protein structure. We note that this type of data transformation has a major problem: significant information might be lost, being easily implied by the fact that we cannot reproduce the original data from the transformed data. Conducting clustering analysis in a network usually results in a minimization problem whose objective is a dissimilarity cost function [12]. Similarly clustering over associations, i.e., a gene network, can be an optimization problem that minimizes criterion like normalized cut over a network [19].
Here we propose two classification methods for the captured problem. In the first method, we classify a pair of genes into the same class if their structural similarity is more than a certain threshold predetermined. After we compare all the pairs of genes with the threshold, all the genes will then be well classified into their classes. The advantage of this method is that, one can still conduct the classification without defining the number of classes beforehand. In the second method, we propose to apply spectral clustering method to the genetic network obtained. We emphasize that spectral clustering is a highlighted approach in the current machine learning literature as well as a de facto standard approach in modern graph partitioning. Furthermore, for the clustering criterion to be optimized, our method focuses on the idea of network modularity [10], [11], [15]. This is a well-recognized, important network property as well as small-world phenomena [22], scale-free property [6] and self-similarity [20], which are all common to a lot of modern network-shaped data such as world wide web and various biological networks. In this aspect, our proposed method is a computationally original as well as a powerful approach for the captured gene annotation problem.
The remainder of this paper is structured as follows. In Section 2, we present our proposed methods and our data source. Numerical experiments are then given in Section 3 to illustrate the effectiveness of our methods. Finally concluding remarks are given in the last section to address further research issues.
-
II. The methodology
In this section, we introduce the data sources and our proposed method. The method we proposed here for gene annotation has four steps.
-
i. Based on the gene-PDB mapping, we try to represent each gene by the set of 3D structures of all its related proteins in PDB database.
-
ii. We then define the gene-gene similarity based on the similarity between protein sets, and represent the genes as a weighted graph.
-
iii. We classify the training genes by two different classification methods.
-
iv. Finally we classify each of the test genes into one of the classes and see if the test gene has the same function or a high functional similarity with the genes which are classified to the same class.
-
A. Data Sources
We adopt the PDB structure similarity taken from DALI.http://www.ebi.ac.uk/. There are 10088 PDB IDs available. The structural similarities of these PDB IDs are given by a matrix with the size of 10088 by 10088, and entries ranges from 0 to 80. To collect the corresponding PDB IDs for the human genes, we search the information
about Gene IDs and their corresponding PDB IDs from the data base downloaded from uniprot (. After data processing, we finally get 578 human genes and 684 PDB IDs related to human genes. Since many PDB IDs are not related to the above 578 human genes, we delete those IDs from our data set. The similarity matrix of PDB structure is then reduced to the size of 684 by 684. We remark that, the similarity matrix of PDB structure is not symmetric. To facilitate the study of structure similarity of human genes, we need to make this matrix a symmetric matrix by the following transformation: (A + AT) / 2.
The Gene Ontology (GO) consists of controlled vocabularies describing three aspects of gene product functions:
-
i. molecular function;
-
ii. biological process; and
-
iii. cellular component
Each of these three aspects is called an ontology and represented by a directed acyclic graph (DAG) where each GO term is attached to a node in the graph. The root (or the starting point) exists in a DAG, and GO terms are arranged hierarchically from general ones to specific ones in a DAG. This means that if a gene is assigned to one term (or a node), then the gene can be assigned to all ancestors of this term. Thus the number of genes assigned to a node is not less than that to any of its children.
Gene Representation and Gene Similarity Measurement: Based on the mapping from genes to IDs in PDB, one can represent each gene gi by the set of ki related PDBs from p1 to pki , i.e.
P g, = { P^ K , P U
The similarity between two genes g and gj can be defined as follows:
S ( g , , g j ) = max S$ ( p , q )
-
p e Pg,, q e P gj
Where S s ( p , q ) is the structure similarity between PDB ID p and PDB ID q .
In order to check whether the gene similarity based on protein structure reflect their functional similarity or not, we further define a gene functional similarity. Each gene has several associated GO terms, which is denoted by
F . = { k.k , r ; }
Here one simple method to define functional similarity for g and g is the following. If F and F have non-j g gj empty overlap, i.e. g and gj share the same functions, then S“f (gi, gj) is set to be 1, otherwise, we set
-
S ; ( g , , g j ) = 0.
This functional similarity measurement between genes can’t reflect the similarity when two genes are similar but not have the same functions. Thus a more sophisticated definition for functional similarity between genes involve function distance in the whole Gene Ontology.
We define the similarity between GO terms fi and f as follows: j
-
- d ( f , f j )"
S f ( f,fj) = exp(— _ 2 )
2a where a is a parameter and d (f, fj) is the length of the shortest path from fi to fj in the graph of the whole Gene Ontology. Then the functional similarity between genes gi and gj can be defined as follows:
S в ( g ; , g j ) = max. s f ( f , h )
-
f e F h e F
where s f ( f , h ) is the similarity between function GO term f and h .
We will demonstrate in experimental results section the relationship between the gene functional similarity and the gene structural similarity.
-
B. Funcion Prediction
In this section, we propose two classification methods. The first method is to classify the genes based on their structural similarity. By defining a threshold, we may classify a pair of genes into the same class if their structural similarity is greater than the defined threshold. After we consider all the pairs of the genes, we can classify all the genes into a number of classes.
For the second method, we apply spectral clustering to the structural similarity matrix. But before we apply spectral clustering, we have to determine the parameter k beforehand. By analyzing the GO terms in the whole Gene Ontology, we can estimate a reasonable range for k . Spectral clustering is a classical method for clustering on graphs. Suppose a set of data points is given, we then define the similarity matrix of the data points, as a measure of their similarity. The idea of spectral clustering is to make use of the spectrum of the similarity of the data to perform dimensionality reduction for clustering in lower dimensions.
To predict gene function, the test data is assigned to one of the classes by using the above classification methods. Here we propose 3 different measurements to evaluate the prediction of gene functions. In the first measurement, suppose the test gene gt is classified into the i th class Ci , then the prediction rate for test gene gt is defined as
-
(1) _ {( g t , g j )| ^ J ( g t , g j ) = 1 g j e C ; }|
r& = C
Then the prediction rate for the testing set T is defined as follows:
R 2 g t eT r g't ’
-
1 = T
In this way, a pair of genes is considered to have a function similarity only if they share the same GO ID.
However, this may lead to the inaccuracy of the results. Even if a pair of genes have different functions but very similar, they are still considered to have no similarity at all. Hence we need also to consider some other methods. In the second measurement, we select the maximum similarity between the test gene and the training genes as the prediction rate
-
4 2) = max g j eC ; S в (.g j , g t)
The prediction rate for the test set T is defined as
R 2 g, Л2)
R 2 = T
.
In the third measurement, we choose the average similarity between the test gene and the training genes as the prediction rate.
-
(3 ) = 2 g , e Sв ( gj , gt ^
2
.„d.3
gt " C i l
Then the prediction rate for the test set T is defined as
R ' = T l '
In the next section, we will give the results of these two classification methods and compare their performance on function prediction.
iii. experimental results
A.Relationship between gene functional similarity and structural similarity
We first obtain the gene-PDB mapping for all human genes from the database of Uniprot, define for each pair of genes their structural similarity Ss ( gi , gj ) based on Definition 1. We then collect their associated GO terms from the database of Gene Ontology. Finally we got 518 human genes which have been annotated to one or more GO terms. Totally there are 1429 GO terms associated with these 518 human genes. We then calculate the functional similarity between GO terms based on the Definition 2, and further calculate the pairwise functional similarity S “ f and S в for the 518 human genes.
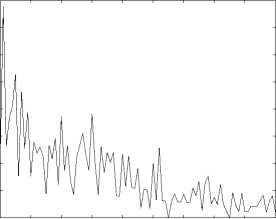
We define a conditional probability as
-
_ |{ ( g ; , g j )| S “ ( g ; , g j ) = 1}n { ( g ; , g j )| S s ( g ; , g j ) > t }| P a ( t ) = ITT UTT T Tl
| { ( g ; , g j) | S s ( g ; , g j) > t II
Here P a ( t ) represents the conditional probability of genes sharing the same functions when their structural similarity is larger than t . Figure 1 shows how that P a ( t ) changes as t increases.
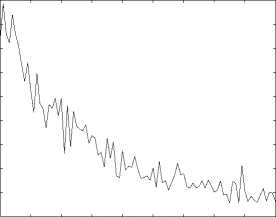
For S в , we define P e ( t ) as
P e ( t ) =
2{ ( g ; , g ;)| S s ( g ; , g , ) > 1 1 S / ( g;, g j] । { ( g ; , g j )| S s ( g ; , g j ) > 1 1|
Here P p ( t ) represents the expectation of the function similarity of a pair of genes when their structural similarity is larger than t . Figure 2 shows how P e ( t ) changes as t increases.
validation to get a more reliable result. The results are reported in Figures 6-8.
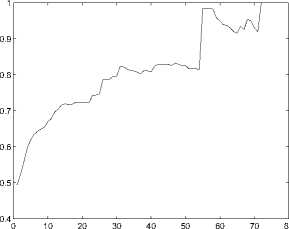
Figure 1. Relationship between S ^f and S s
-
B. Function Prediction
-
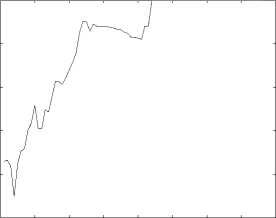
1) Classification Based on Structural Similarity: In this subsection, we classify genes based on their structural similarity matrix. We perform the classification when the thereshold (H) ranges from 0 to 79. For the 518 available genes, we choose 90% of the genes as training data, and the others are test data. We adopt 10-fold validation to get a more reliable result. We use R1, R2 and R3 to evaluate the performance of function prediction. The results are then reported in Figures 3-5.
-
2) Spectral Clustering: In this section, we apply spectral clustering to the structural similarity matrix. Before running the algorithm of spectral clustering, we need to determine a reasonable range for the parameter k , which is the number of clusters. Therefore, we begin with analyzing the 1429 GO terms in the whole Gene Ontology[23], and obtain an estimation on the number of classes these GO terms can be classified to. We define n -distance graph Gn for these GO terms in the following way: each GO term is defined as a node; An edge between fi and fj is defined in Gn if the shortest path from fi to fj in the whole Gene Ontology is smaller than or equal to n . In other words, if the length of shortest path between fi and fj is less than or equal to n , then these two GO terms are in the same connected component. Hence the larger the value of n is, the fuzzier relationship is defined in Gn . We calculate the connected components in graph G n , n = 1,2,...10.When n is 10, the distribution of the connected components is tending towards stability, therefore we do not consider the graph when n > 10 . Table I shows the numbers of GO terms in the first 10 largest connected components ( C 1 to C 10 ).
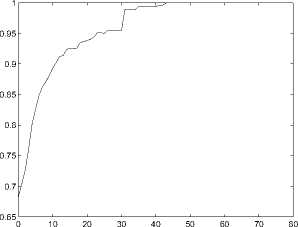
Figure 2. Relationship between S в and S fs

Figure 3. The performance(measured by R2) of function prediction by the first classification method
From the above table, we found that the first 10 largest components include 23 . 6% to 73 . 1% of all 1429 GO terms when n ranges from 1 to 10. For the connected components other than these 10 components, the sizes are between 1 and 10. Intuitively, when k < 10, the gene with GO terms outside these 10 components may be misclassified. Furthermore, by the graphing results, the top 100 largest components include 43 . 1% to 84 . 5% of all 1429 GO terms when n ranges from 1 to 10. For the connected components other than these first 100 components, the sizes are not larger than 2. The results indicate that, most of the GO terms outside the first 100 components are “outliers”. If k > 100 , these “outliers” may bring serious influence on the clustering results. Therefore, a reasonable range for k is 10 to 100. Then we perform spectral clustering when the value of k increases from 1 to 100, and see which value of k is better. Also, we choose 90% of the 518 available genes as the training data, and the others are test data. We use 10-fold cross
-
0 10 20 30 40 50 60 70 80
Figure 4. The performance(measured by R3) of function prediction by the first classification method
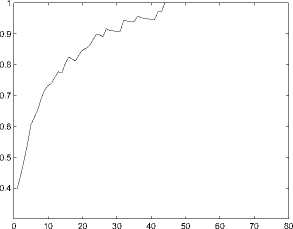
Figure 5. The performance(measured by R3) of function prediction by the first classification method
From these figures, we can see the prediction performs best when k = 11.
Iv. prediction of gene function
From the experimental results, we can see that the more structural similarity the genes share, the more functional similarity they have. This would give us an indication of using defined measurement to predict gene function.
0.4
0.35
0.3
0.25
0.2
0.15
0.1
0.05
10 20 30 40 50 60 70 80 90 100
Figure 6. The performance(measured by R1) of function prediction by spectral clustering.
Function Prediction can be viewed as a classification problem. Comparing the two different classification methods we can claim the spectral method is inferior to the first method. For spectral clustering method, the best prediction rate under R1, R2 and R3 criterion are 0 . 3889, 0 . 8851 and 0 . 6615 respectively. On the other hand, for the first classification method, when threshold H is 20, the prediction rate under R1, R2 and R3 criterion are 0 . 8523, 0.9289 and 0.8612 respectively, which outperforms the spectral clustering method. This further confirms the superiority of the first classification method.
At the end of this section, we look into the details of the results given by the first classification method and hence discuss the possibility of more detailed function prediction. We set threshold H = 10, and apply the first classification method. The following 8 genes: GOLGA2, Saps3, GTF2E1, RPS2P46, OA18, CXB3S, CD247 and SOS1 are classified into the same class (as shown in Figure 9). In Figure 9, the number next to each edge gives the structural similarity of the two genes connected by this edge. Table II gives the GO terms of these 8 genes.
10 20 30 40 50 60 70 80 90 100
Figure 7. The performance(measured by R2) of function prediction by spectral clustering.
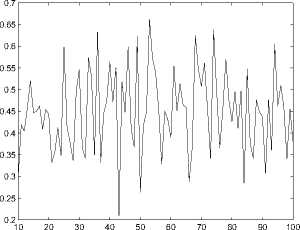
Figure 8. The performance(measured by R3) of function prediction by spectral clustering.
From the table II, we find that “GO:0006468” is the most “popular” GO term in this class. These results imply us that, in our future work we can propose some method for extracting one or more GO terms for each class as the representative functions (candidates of predicted function) of each class. Table III reports the most frequent GO terms in the first ten largest classes obtained by using the first classification method. We find that, the most frequent GO terms in Classes 3, 5, 6 and 7 are the same. One of the possible reasons is due to the limit number of genes available. We can see this point from Figure 9. Suppose gene SOS1 is missing, then the left 7 genes will be classified into two separate classes. This means, missing one gene is already enough to change the classification results of the first method. Therefore, another work of ours in the future is to add more genes to our gene set and obtain more reliable results. But we also find that, even one or more genes are missing, the predicted function similarity will not be changed greatly. Hence we remark that our method is robust with respect to missing data.
v. concluding remarks
In this paper, we study the problem of inferring functional similarity for human genes from PDB-structural similarity. We develop a new measurement to describe the structural and functional similarity for genes. Moreover, we show that high structural similarity usually correspond to high functional similarity. This implies that
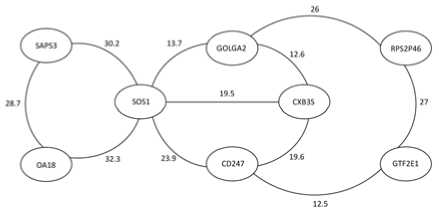
Figure 9. An 8-gene class obtained by the first classification method(H=10)
TABLE I. THE CONNECTED COMPONENTS IN GRAPH Gn
|
C 1 |
C 2 |
C 3 |
C 4 |
C 5 |
C 6 |
C 7 |
C 8 |
C 9 |
C 10 |
|
|
G 1 |
117 |
89 |
28 |
24 |
23 |
16 |
14 |
9 |
9 |
8 |
|
G 2 |
305 |
181 |
41 |
30 |
29 |
21 |
18 |
11 |
10 |
9 |
|
G 3 |
412 |
238 |
59 |
52 |
46 |
21 |
13 |
12 |
12 |
11 |
|
G 4 |
470 |
328 |
62 |
47 |
21 |
13 |
13 |
12 |
11 |
11 |
|
G 5 |
485 |
339 |
63 |
47 |
21 |
13 |
13 |
12 |
11 |
11 |
|
G 6 |
496 |
343 |
63 |
47 |
21 |
13 |
13 |
12 |
11 |
11 |
|
G 7 |
498 |
344 |
63 |
47 |
21 |
13 |
13 |
12 |
11 |
11 |
|
G 8 |
498 |
408 |
47 |
21 |
13 |
13 |
12 |
11 |
11 |
10 |
|
G 9 |
498 |
408 |
47 |
21 |
13 |
13 |
12 |
11 |
11 |
10 |
|
G 10 |
498 |
408 |
47 |
21 |
13 |
13 |
12 |
11 |
11 |
10 |
TABLE II. GO T erms of the 8 genes
However, our classification method cannot determine the exact GO ID for a gene. In our further research, we will improve our method in prediction accuracy and to give a more specific prediction.
Acknowledgment
The preliminary version of this paper has been accepted for presentation in ICBECS 2011 and publication in the proceedings of the 2nd International Conference on Biomedical Engineering and Computer Science (ICBECS 2011). Research supported in part by HKRGC Grant No. 7017/07P, HKU Strategy Research Theme fund on Computational Sciences, National Natural Science Foundation of China Grant No. 10971075 and Guangdong Provincial Natural Science Grant No. 9151063101000021.
TABLE III. F irst 10 largest classes obtained by first classification method (H = 10)
|
Class 1 |
Class Size |
13 genes |
|
No. of GO terms involved |
2 |
|
|
Most frequent GO term |
GO:0006094 |
|
|
Frequency |
12 |
|
|
Class 2 |
Class Size |
10 genes |
|
No. of GO terms involved |
2 |
|
|
Most frequent GO term |
GO:0006508 |
|
|
Frequency |
10 |
|
|
Class 3 |
Class Size |
10 genes |
|
No. of GO terms involved |
2 |
|
|
Most frequent GO term |
GO:0055114 |
|
|
Frequency |
7 |
|
|
Class 4 |
Class Size |
8 genes |
|
No. of GO terms involved |
2 |
|
|
Most frequent GO term |
GO:0006468 |
|
|
Frequency |
7 |
|
|
Class 5 |
Class Size |
7 genes |
|
No. of GO terms involved |
2 |
|
|
Most frequent GO term |
GO:0055114 |
|
|
Frequency |
7 |
|
|
Class 6 |
Class Size |
6 genes |
|
No. of GO terms involved |
2 |
|
|
Most frequent GO term |
GO:0055114 |
|
|
Frequency |
3 |
|
|
Class 7 |
Class Size |
6 genes |
|
No. of GO terms involved |
2 |
|
|
Most frequent GO term |
GO:0055114 |
|
|
Frequency |
3 |
|
|
Class 8 |
Class Size |
5 genes |
|
No. of GO terms involved |
2 |
|
|
Most frequent GO term |
GO:0009405 |
|
|
Frequency |
4 |
|
|
Class 9 |
Class Size |
5 genes |
|
No. of GO terms involved |
2 |
|
|
Most frequent GO term |
GO:0008218 |
|
|
Frequency |
3 |
|
|
Class 10 |
Class Size |
5 genes |
References On Construction of Gene-PDB Structure Mapping with Applications in Functional Annotation of Human Genes
- http://hkumath.hku.hk/∼wkc/data/gene.PDBid.txt.
- http://hkumath.hku.hk/∼wkc/data/gene.struc.similarity.mat.
- http://hkumath.hku.hk/∼wkc/data/gene.goset.mat.
- http://hkumath.hku.hk/∼wkc/data/gene.func.similarity.mat.
- http://hkumath.hku.hk/∼wkc/data/go.distance.mat
- Barabasi, A. and Albert, R. Emergence of scaling in randomnetworks, Science, 286 509 - 512,1999.
- Brown, M., Grundy, W. N., Lin, D., Cristianini, N., Sugnet, C. W., Furey, T. S., Ares, M. Jr. and Haussler, D. Knowledge-based analysis of microarray gene expression data by using support vector machines, Proc. Natl. Acad. Sci., 97 262-267, 2000.
- Chen, X., Jiang, H., Ching,W. and Li,L. Inferring Functional Annotation for Human genes from Gene-PDB Structure Mapping, Proceedings of the 2nd International Conference on Biomedical Engineering and Computer Science (ICBECS2011), 23-24 April, 2011, Wuhan, China.
- Ching, W., Li,L, Tsing, N., Tai, C.Ng, T., Wong A. and Cheng, K. A Weighted Local Least Squares Imputation Method for Missing Value Estimation in Microarray Gene Expression Data, Journal of Data Mining and Bioinformatics 4 331-347, 2010.
- Guimera, R. and Nunes Amaral, L. A. Functional cartographyof complex metabolic networks, Nature,433(7028):895–900, 2005.
- Guimera, R., Sales-Pardo, M., and Amaral L. A. N. Modularity from fluctuations in random graphs and complex networks, Phys. Rev.E, 70:025101, 2004.
- Li, L., Shiga, M., Ching, W. and Mamitsuka, H. Annotating gene functions with integrative spectral clustering on microarray expressions and sequences, Genome Informatics, 22 95-120,2009.
- Marcotte, E., Pellegrini, M., Thompson, M., Yeates, T. and Eisenberg, D. A combined algorithm for genome-wide prediction of protein function, Nature, 402 83-86, 1999.
- Marcotte, E., Pellegrini, M., Thompson, M. Yeates, T. and Eisenberg, D. Detecting protein function and protein-protein interactions from genome sequences, Science, 285 751-753, 1999.
- Newman, M. E. J. and Girvan, M. Finding and evaluating community structure in networks, Phys. Rev. E, 69:026-113,2004.
- Pellgrini, M., Marcotte,E.M., Thompson, M.J., Eisenberg,D. and Yeates, T. Assigning protein functions by comparative genome analysis: protein phylogenetic profiles, Proc. Nat.Acad. Sci.,96 (8) 4285-4288,1999.
- Rost B. Enzyme function less conserved than anticipated, J.Mol.Biol.,318 595-608,2000.
- SGD project. “Saccharomyces Genome Database” ftp://ftp.yeastgenome.org/yeast/sequence similarity/yeast vs yeast/.
- Shi, J. and Malik, J. Normalized cuts and image segmentation, IEEE Trans. on Pattern Analysis and Machine Intelligence, 22 888–905,2000.
- Song, C., Havlin, S. and Makse, H. Self-similarity of complexnetworks, Nature 433, 392-395,2005.
- Troyanskaya, O., Cantor, M., Sherlock, G., Brown, P., Hastie, T., Tibshirani, R., Botstein, D. and Altman, R. Missing value estimation methods for DNA microarray, Bioinformatics, 17 520-525,2000.
- Watts, D. and Strogatz, S. Collective dynamics of ’small-world’ networks, Nature 393, 440-442,1998.
- Gene Ontology. http://www.geneontology.org
