On the relationship between the water level and water discharge in the downstream of the Uglich Water Power Station

Author: Agafonnikova E.O., Khoperskov A.V.
Journal: Природные системы и ресурсы @ns-jvolsu
Section: Геоэкология
Article in issue: 4 т.14, 2024.
Free access
The dynamics of the hydraulic parameters of the Volga River downstream of the Uglich HPS are considered. The observed relationship between the water level in the downstream and the discharge of water through the dam is atypical compared to other sections of both the Volga River and other river systems. This difference is due to the strongest influence of water dynamics in the Rybinsk Reservoir under conditions of a small difference in water levels in the reservoir compared to the downstream of the Uglich hydroelectric power station. Our analysis allowed us to reconstruct the natural relationship between the level and discharge of water through the dam, which demonstrates a weak hysteresis dependence, which is typical for other similar water bodies.
Hydrological regime, volga river, flood, hysteresis, water levels, hydrograph
Short address: https://sciup.org/149147578
IDR: 149147578 | UDC: 528.931.2 | DOI: 10.15688/nsr.jvolsu.2024.4.6
О связи между уровнем и расходом воды на примере данных гидропоста нижнего бьефа Угличской ГЭС
Рассмотрены особенности динамики гидравлических параметров реки Волга ниже Угличской ГЭС. Зависимость между уровнем воды в нижнем бьефе и расходом воды через дамбу является атипичной по сравнению с другими участками как реки Волга, так и иными речными системами. Такое отличие обусловлено сильнейшим влиянием динамики воды в Рыбинском водохранилище из-за маленького перепада уровней воды в водохранилище по сравнению с нижним бьефом Угличской ГЭС. Проведенный анализ позволил реконструировать связь между уровнем воды и расходом через плотину, которая демонстрирует слабую гистерезисную зависимость, что типично и для других похожих водных объектов.
Text of the scientific article On the relationship between the water level and water discharge in the downstream of the Uglich Water Power Station
DOI:
An interesting phenomenon of river dynamics is the hysteresis loop between the dependence of the water level η on the water discharge Q in the cross-section of the channel [12]. An increase in the value of Q during seasonal floods is accompanied by a regular increase in the depth H at a fixed point or water surface level η [3; 21]. The end of the flood leads to a decrease in η . However, the dependences η ( Q ) at the stages of flood rise and fall do not coincide with each other due to the heterogeneity of the flow under the conditions of non-stationary behavior of the hydrograph Q ( t ) which is manifested in the formation of a hysteresis loop. Thus, a wide variety of rivers are characterized by special hysteresis in the stage-discharge relation [4; 5].
The discussed hydrological hysteresis is associated with the presence of memory in the system, when the current state is determined both by the characteristics at a given time and by the values of the system parameters in the previous time interval т ( hy s ) . The duration T hys ) is the length of the memory, which affects the hysteresis width [10; 14].
Examples of such hysteretic behavior of unsteady flow are described in the literature [6]. Hysteretic loops of the dependence η ( Q ) can be associated with nomograms of dynamic water volumes [1]. Quite powerful hysteretic loops were obtained from measurements on the Chattahoochee River (USA) [18], Tisza River, Yeongsan River in Korea, Illinois River [12], Snake River below the CJ Strike Dam in Idaho (USA) [16]. The Ohio River at Wheeling and the Tennessee River at Scottsboro show a weaker difference on the rising and falling branches of η ( Q ) [18]. The hydrological regime of the downstream of the Tsimlyansk hydroelectric power station on the Don River also gives a loop dependence for η ( Q ) [2].
Interest in the study of hysteresis loops in the dependence η ( Q ) is associated with the possibility of revealing hidden patterns in the hydrodynamic system of the river. Apparently, the properties of the hysteresis curve depend on the morphology of the bottom, the turbulent state of the flow, the presence of water sources and drains in the channel, the structure of the river valley, the sediment transport, the presence of islands and other characteristics [14; 19].
This work is aimed at studying some features of the hydrological regime of the Volga River near the downstream of the Uglich hydroelectric power station. Our goal is to reconstruct hysteresis loops of the water level dependence on the hydrograph in this area.
Measurement data from the gauging station of the Uglich HPS
The hydrological regime of the Volga River has changed significantly due to the system of hydroelectric power stations along the entire watercourse. The natural water flow is disrupted by a large number of large reservoirs. The water flow through the dams is characterized by hydrographs Q ( t ), which are established by government agencies. These hydrographs poorly reproduce natural processes, since they are determined by the opposing interests of various institutions and economic entities. The pressure of economic activity, increased urbanization of floodplains and adjacent territories require a more uniform hydrograph. Therefore, the volume of flood waters is redistributed throughout the year, reducing the peak values of the hydrograph [7].
The Uglich hydroelectric complex zone belongs to the Upper Volga with an average water discharge of about 500 m 3 /sec (fig. 1). The Uglich reservoir is located above this dam and is of the passable type with a small water reserve. The narrow channel of the Volga extends below the dam for about 80 km, smoothly turning into the wide Rybinsk reservoir. The volume of water in the Rybinsk reservoir exceeds the water reserve in the Volga channel from the Uglich dam to this reservoir by about 500 times. Therefore, an increase in water in the Rybinsk reservoir can significantly affect the hydrological regime of the entire Volga River to the Uglich hydroelectric power station.
Building a relationship between the water level η (or depth H ) and water discharge Q in the form of functions Q = Q ( η ) (or Q = Q ( H )) is a standard problem in hydrology [8; 17], since it allows one to estimate the difficult-to-measure quantity Q using a reliably determined water level or depth [15]. A more subtle analysis indicates an ambiguous dependence η = η ( Q ) at the stages of growth and decrease of Q ( t ) and η ( t ):
η ( t1< t < t2 ) < η ( t3< t < t4 ), (1)
if the following conditions are met dQ dQ
—— > 0 при t< t < t,, —— < 0 при t < t < t . dt 1 2 dt 3 4
The hydrological regime of the Uglich hydroelectric complex is considered in more detail below. Figure 2 shows the annual variation of the hydrograph and water levels below the dam of the Uglich HPS. The hysteresis curve in Figure 2c differs significantly from the typical dependence in Figure 3. The hydrograph of the Saratov HPS shows an increase in Q(t), by about five times in spring compared to low-water values (fig. 3a). We also see an increase in the water level in the downstream by about 4 meters during this period (fig. 3b). This behavior yields a typical loopshaped dependence on the parameter plane (Q, η) (fig. 3c). Different colors highlight regions of the dependence η (Q) in accordance with the colors in the inset in panel b, where time intervals with different types of η (t) change are highlighted. The growth stage of η (t) (red line) corresponds to the ascending branch of η (t) (fig. 3c). The next short interval (blue line) is responsible for the short
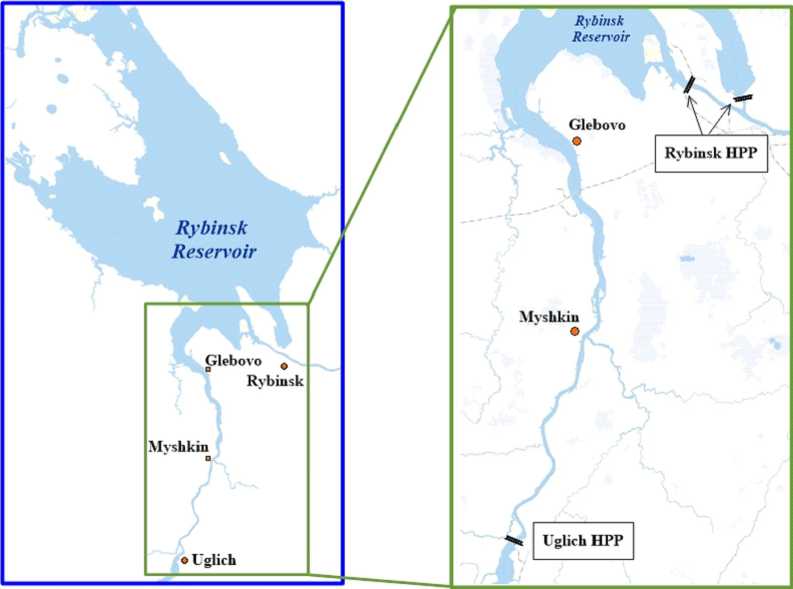
Fig. 1. The map of the region under study includes the Volga River below the Uglich Dam and the Rybinsk Reservoir. The insert contains section of the Volga River on an enlarged scale
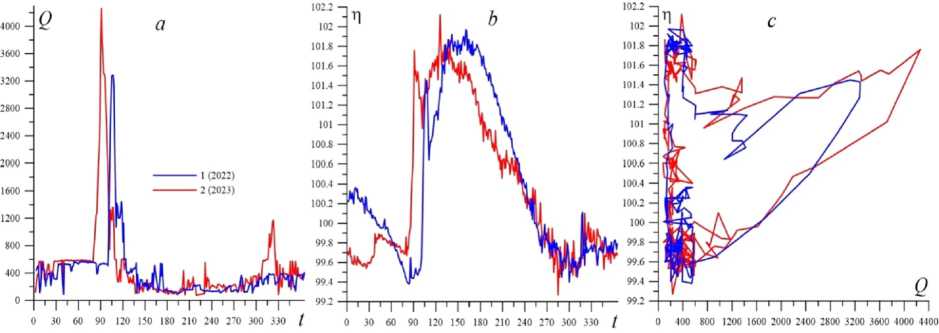
Fig. 2. Dependencies Q ( t ), η ( t ) and η ( Q ) for the downstream of the Uglich dam in 2022 and 2023
loop in the region of the Q maximum. The green line shows the descending branch of the main hysteresis loop. The purple line at Q 18000 m 3 /sec also yields an internal loop for η ( Q ). The subsequent decline in water discharge completes the main loop (light blue line).
Analysis of hysteresis curves
It is convenient to characterize the hysteresis loop by the maximum difference between water levels on the rise and fall branches of η (Q), which is designated as Δη(hys). The width of the hysteresis Δη(hys) for the Saratov hydroelectric power station is 0.6-1.0 m, which is quite typical for the Volga River in the middle and lower reaches. The value of Δη(hys) in the upper reaches generally decreases with a decrease in low-water and maximum water flow rates. Small rivers, compared to the Lower Volga, are characterized by lower values of Δη(hys), as in the case of the Don River with Δη(hys) = 15 cm in the downstream zone of the Tsimlyansk hydroelectric power station [2]. The average discharge at this dam is 655 m3/sec, which is comparable to the Volga regime near Uglich.
The hystereses for the Uglich HPS in the figures 2 have a form that is very different from the dependence in figure 3 for the Saratov HPS. There is an extremely powerful hysteresis with Δ η ( hys ) ~ 2 m, and the maximum width Δ η ( hys ) is achieved at small (low-water) values of Q ( D ) . Such unusual behavior requires special analysis.
Comparison of the time series Q ( D ) ( t ) and η ( t ) yields a striking contradiction if we compare panels a and b in figure 2. The duration of the spring flood for the Uglich HPS with increased water discharge lasts approximately 40 days. The time interval with an increased water level reaches 150 days. Obviously, the behavior of η ( t ) is associated not so much with an increase in Q , but rather reflects other physical factors.
Let us consider in more detail a short time interval from March 20 to April 29, 2024, lasting 40 days (fig. 4). The discharge of water increases approximately 3 times over 15 days and then there is another surge for 5–6 days with a smaller
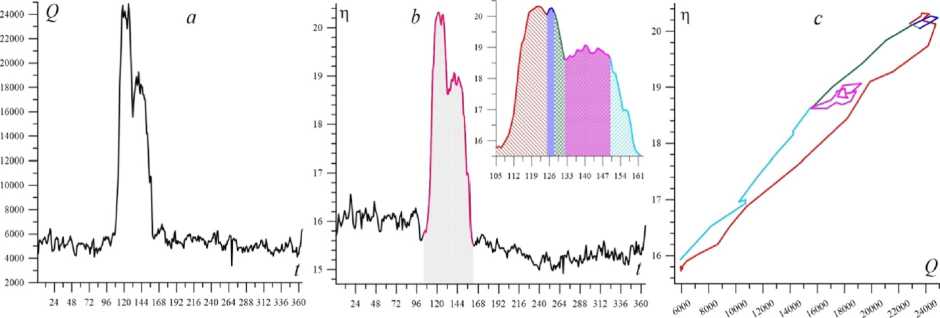
Fig. 3. Example of classical hysteresis for the downstream of the Saratov hydroelectric power station in 2021
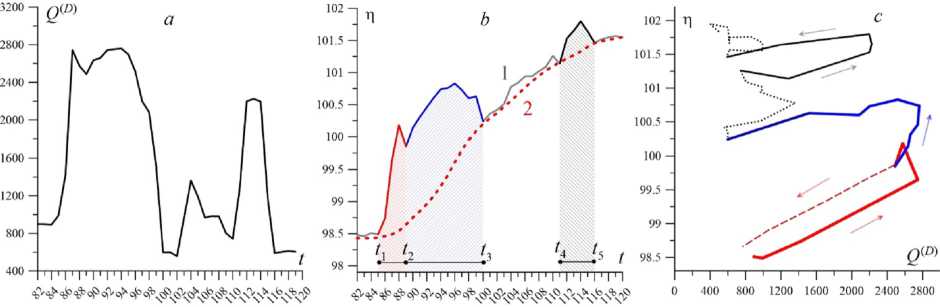
Fig. 4. Dependencies Q ( t ) ( a ), η ( t ) ( b ) and η ( Q ) ( c ) below the Uglich dam in the period from March 20 to April 29, 2024
amplitude. The corresponding dynamics of the water level η ( Ugl ) ( t ) is shown by curve 1 (solid line) in figure 4 b . The dotted line shows the change in the water level in the upstream of the Rybinsk HPS η ( Ryb ) ( t ). The distance between these points along the watercourse is approximately 107 km, which consists of 80 km along the riverbed itself and 27 km along the Rybinsk Reservoir. The water levels in the Rybinsk Reservoir and in the downstream of the Uglich hydroelectric power station are very close, forming a kind of single reservoir in terms of the water surface. The hypsometric profile across the Volga River valley confirms this. The discharge due to the difference in levels is often very small, since the volume of water in the reservoir is hundreds of times greater than the water reserves in the river bed in this section. Therefore, the hydrological regime in the Volga section from the Uglich Dam to the beginning of the Rybinsk Reservoir can be determined to a greater extent by the operating mode of the Rybinsk HPS.
Figure 4 b allows us to clearly distinguish four states of the downstream of the Uglich HPS in the spring of 2024.
-
1) The interval t 1 ≤ t ≤ t 2 is characterized by the growth of η ( Ugl ) ( t ) with almost unchanged η ( Ryb ) ( t ). The increase in the water level in the downstream is mainly due to the increase in the discharge of water Q ( D ) . This interval is short (4 days), when we have a fairly standard section of the initial hysteresis phase (thick red line in panel c ).
-
2) The second stage begins with the growth of η ( Ryb ) ( t ) and continues until η ( Ryb ) η ( Ugl ) is
reached at time t 3. The corresponding interval t = ( t 2, t 3) on the plane ( Q ( D ) , η ) is highlighted by the thick blue line. This section of the function η ( Q ( D ) ) is strongly influenced by the rising water level in the Rybinsk Reservoir.
-
3) The interval t 3 ≤ t ≤ t 4 is characterized by the approximate equality η ( Ugl ) η ( Ryb ) against the background of a general increase in the water level. This means that this effect is entirely due to the filling of the Rybinsk Reservoir, since the hydrograph of the Uglich dam downstream fluctuates near the low-water values. Therefore, the dependence η ( Q ( D ) ) does not reveal a clear hysteresis loop (the black dotted line in figure 4 c ).
-
4) The fourth interval t 4 ≤ t ≤ t 5 is interesting due to a short-term increase in the hydrograph to 2200 m 3 /sec. As a result, there is a slight excess of η ( Ugl ) over η ( Ryb ) by about 0.4 m over an interval of several days. This is manifested by another hysteresis loop, shown by a black thick line in panel b (fig. 5).
The thick red line in figure 5 c can be extended by a hypothetical falling branch (dashed red line), which would manifest itself in the absence of the influence of the Rybinsk Reservoir. We try to reconstruct the dependence η ( Q ) by subtracting the non-stationary effect of the Rybinsk Reservoir from η ( Ugl ) ( t ). The low-water level before t 1 is taken as the zero point for the curve δ η ( t ). This determines the difference δ η ( t ) = η ( Ugl ) – η ( Ryb ) provided that η ( Ugl ) ( t 1) = η ( Ryb ) ( t 1). Figure 5 shows the result of such a restoration of the dependence η ( Q ) if we remove the influence of water level variability in the Rybinsk Reservoir.
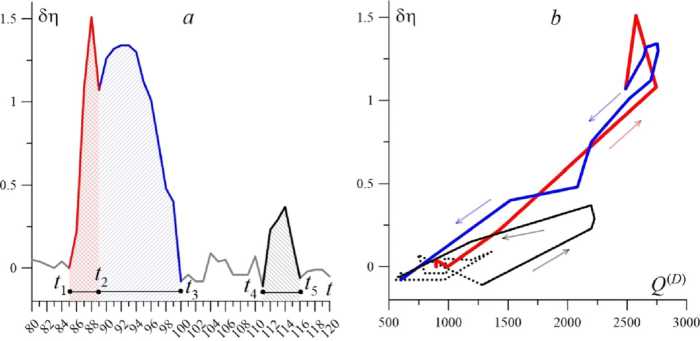
Fig. 5. The result of the reconstruction of the hysteresis loop in 2024
Conclusion and discussion
References On the relationship between the water level and water discharge in the downstream of the Uglich Water Power Station
- Badnaruk S.E., Diljman N.A., Klenov Ye.M., Chukanov VV Ispol'zovanie nomogramm dinamicheskih ob'emov v imitacionnoj modeli Volzhsko-Kamskogo kaskada vodohranilisch [Usage of Nomograms of Dynamic Volumes in the Simulation Model of the Volga-Kama Cascade of Water Reservoirs]. Environmental Engineering, 2017, no. 1, pp. 24-30.
- Buber A.L., Fedotova E. V Podbor parametrov ekstrapolyacionnyh krivyh Q/H dlya postov Nizhnego Dona na osnove metodov optimizacii [Selection of Parameters of Extrapolation Curves Q/H for the Lower Don Posts Based on Optimization Methods]. Forest Reclamation andEcologically-HydrologicalProblems of the Don Catchment Area: National Scientific Conference Materials, Volgograd, O^ober 29-30, Federal Center of Agroecology of RAS, 2020, p. 595.
- Fenton J.D. Rating Curves: Part 2-Representation and Approximation. Proc. Conference on Hydraulic in civil Engineering. Habart, Institution of Engineering, 2001, pp. 28-30.
- Fenton J.D., Keller R.J. The Calculation of Streamflow from Measurements of Stage. Cooperative Research Centre for Catchment Hydrology. Report, 2001, vol. 1, no. 6, p. 84.
- Fenton J.D. On the Generation of Stream Rating Curves. Journal of Hydrology, 2018, vol. 564, pp. 748757. DOI: https://doi.org/10.1016/jjhydrol.2018.07.025
- Graf W.H., Qu Z. Flood Hydrographs in Open Channels. Proceedings of the Institution of Civil Engineers-Water Management. Thomas Telford Ltd, 2004, vol. 157, no. 1, pp. 45-52. DOI: https://doi.org/ 10.1680/wama.2004.157.1.45
- Gorelits O.V., Ermakova G.S., Terskii P.N. Hydrological Regime of the Lower Volga River Under Modern Conditions. Russian Meteorology and Hydrology, 2018, vol. 43, pp. 646-654. DOI: https:// doi.org/10.3103/S1068373918100035
- Herschy R.W. Streamflow Measurement. CRCpress, 2008. 536 p. DOI: https://doi.org/10.1201/ 9781482265880
- Isaeva I.I., Voronin A.A. Models for Managing Hydraulic Projects in Floodplain Areas, Considering the Activity of Economic Entities. Mathematical Physics and Computer Simulation, 2024, vol. 27, no. 1, pp. 45-61. DOI: https://doi.org/ 10.15688/mpcm.jvolsu.2024.1.2
- Khoperskov A.V, Khrrapov S.S., Klikunova A.Y, Popov I.E. Efficiency of Using GPUs for Reconstructing the Hydraulic Resistance in River Systems Based on Combination of High Performance Hydrodynamic Simulation and Machine Learning. Lobachevskii Journal of Mathematics, 2024, vol. 45, no. 7, pp. 3085-3096. DOI: https://doi.org/10.1134/ S199508022460376X
- Khrapov S.S. Numerical Modeling of Self-Consistent Dynamics of Shallow Waters, Traction and Suspended Sediments: II. Study of the Transverse Deformations of the Channel and the Redistribution of Water Discharges Along the Branches of the Volga River During Industrial Sand Mining. Mathematical Physics and Computer Simulation, 2022, vol. 25, no. 4, pp. 52-65. DOI: https://doi.org/10.15688/mpcmjvolsu.2022A5
- Muste M., Kim K., Kim D., Fleit G. Decoding the Hysteretic Behavior of Hydraulic Variables in Lowland Rivers with Multivariate Monitoring Approaches. EarthArXiv eprints, 2024, pp. X53M5F. DOI: https://doi.org/10.31223/X53M5F
- Klikunova A.Yu., Khoperskov A.V. Calculation of Hydrological Connection Between the Volga River and the Akhtuba River Using Numerical Hydrodynamic Modeling. St. Petersburg Polytechnic University Journal: Physics and Mathematics, 2023, vol. 63, no. 1.1, pp. 326-330. DOI: https://doi.org/ 10.18721/JPM. 161.154
- Klikunova A.Yu., Polyakov M.V, Khrapov S.S., Khoperskov A.V. Problem of Building High-Quality Predictive Model of River Hydrology: The Combined Use of Hydrodynamic Simulations and Intelligent. Communications in Computer and Information Science, 2023, vol. 1909, pp. 191-205. DOI: https:// doi.org/10.1007/978-3-031-44615-3\_13
- Matyugin M.A., Miltsyn D.A. Sovremennye pribory i metody izmereniya rashoda vody v otkrytyh vodotokah [The Modern Devices and Methods of Measurement of Water Discharge in Open Waterways]. Russian Journal of Water Transport, 2015, no. 44, pp. 66-76.
- Muste M., Lee K., Kim D., et al. Revisiting Hysteresis of Flow Variables in Monitoring Unsteady Streamflows. Journal of Hydraulic Research, 2020, vol. 58, no. 6, pp. 867-887. DOI: https://doi.org/10.1080/ 00221686.2020.1786742
- Orlova V.V. Gidrometriya [Hydrometry]. Leningrad, Gidrometeoizdat Publ., 1974. 414 p.
- Petersen-Overleir A. Modelling Stage-Discharge Relationships Affected by Hysteresis Using the Jones Formula and Nonlinear Regression. Hydrological Sciences Journal, 2006, vol. 51, no. 3, pp. 365-388. DOI: https://doi.org/10.1623/hysj.5L3.365
- Sinichenko E.K. Ekstrapolyaciya krivoj svyazi rashodov i urovnej Q=F(H) [Extrapolation of Curve of Relationship of Flowrate and Water Level Q=F(H)]. RUDN Journal of Engineering Research, 2003, no. 2, pp. 62-66.
- Solodovnikov D.A., Khavanskaya, N.M., Semenova, D.A., Shilova, N.V. The Influence of Climatic and Hydrological Changes on the Forest-Growing Conditions of the River Floodplains of the Don Basin. Prirodnye sistemy i resursy, 2023, vol. 13, no 3, pp. 27-35. DOI: https://doi.org/10.15688/ nsr.jvolsu.2023.3.4
- Venetis C. A Note on the Estimation of the Parameters in Logarithmic Stage-Discharge Relationships with Estimates of Their Error. Hydrological Sciences Journal, 1970, vol. 15, no. 2, pp. 105-111. DOI: https://doi.org/10.1080/ 02626667009493957
