On the Selection of Physical Layer Optimized Network Topologies for the Zigbee Network

Author: Manpreet, Jyoteesh Malhotra
Journal: International Journal of Information Technology and Computer Science(IJITCS) @ijitcs
Article in issue: 1 Vol. 8, 2016.
Free access
Zigbee standard has been designed for low data rate, low cost and limited power applications for short-range wireless communication. The successful implementation of Zigbee based network depends on the suitable selection of physical (PHY) layer and medium access control (MAC) layer parameters. In this work the PHY layer parameters have been optimized for star, tree and mesh topologies. The performance investigations have been carried out for different frequency band and data rate and different bandwidth (BW) in each of standard topologies. Through extensive simulations, QoS parameters like throughput, network load and delay have been evaluated to achieve optimal performance of physical layer.
Zigbee, frequency band, data rate, bandwidth, star topology, mesh topology, tree
Short address: https://sciup.org/15012426
IDR: 15012426
Text of the scientific article On the Selection of Physical Layer Optimized Network Topologies for the Zigbee Network
Published Online January 2016 in MECS
■ MyWork-St«Topology_2450MHz-OES-1
О MyWork-TreeTopologv_2450MHz-DES-1
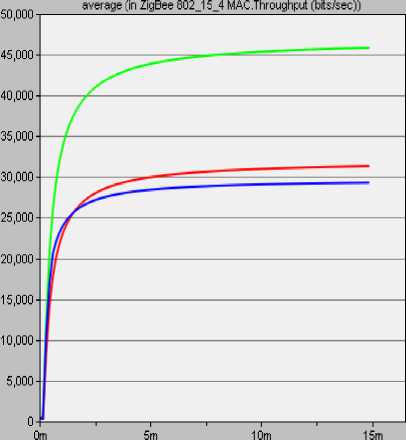
Fig.7. Throughput (2.4GHz)
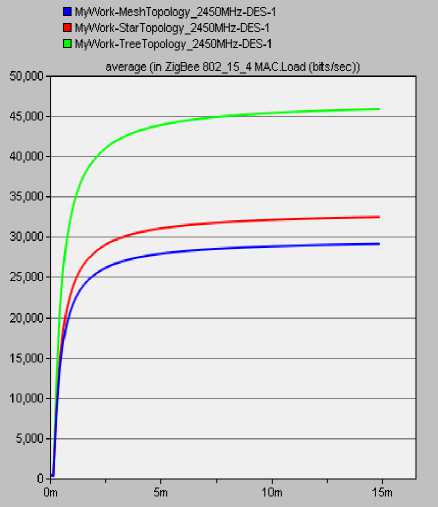
Fig.9. Load (2.4GHz)
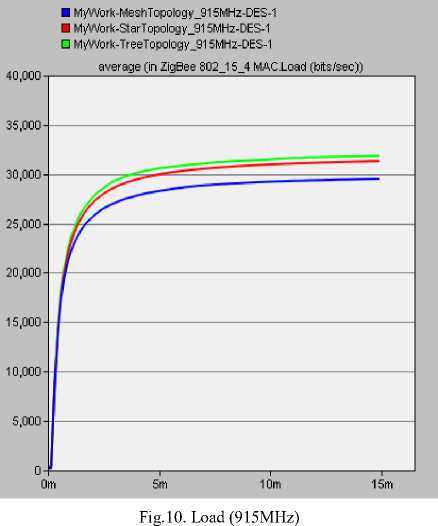
For 2.4 GHz band, load is less in mesh topology (29110 bits/sec). Load of star topology is more than load in mesh topology (32440 bits/sec) but tree topology has highest load (45860 bits/sec). It is observes in figure for 915 MHz, load of star topology decreases as from load for 2.4 GHz and load in mesh topology increases. Load for tree topology (31850 bits/sec) is less as compared to 2.4 GHz.
For 2.4GHz delay slightly different in all the cases with minor variations. Delay in tree topology is 0.0103 sec and delay in star topology is 0.0095 sec and delay in mesh topology is 0.009 sec. For 915 MHz, tree topology is showing maximum delay as 0.15 sec and in mesh and star delay is 0.083 sec and 0.104 sec respectively.
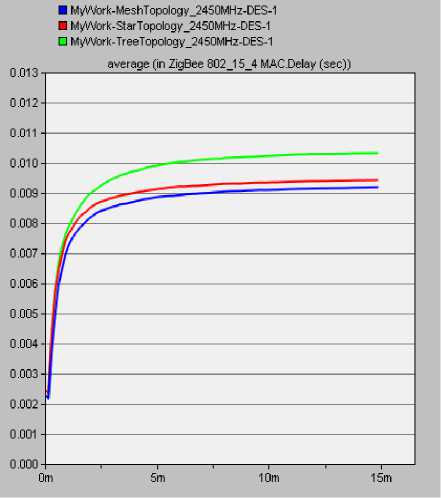
Fig.11. Delay (2.4 GHz)
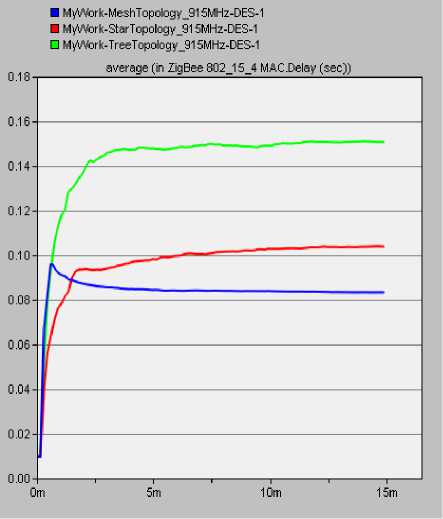
Fig.12. Delay (915MHz)
Results show that Star topology show minor decrease in performance for throughput, load, and data traffic sent and data traffic received in 915 MHz as compared to 2.4 GHz frequency band. Tree topology outperforms in 2.4GHz frequency band and mesh topology perform better as compared to performance for 915MHz. For 915 MHz, all topologies show enormous increase delay as compared to delay at 2.4 GHz as shown in Table II.
Table.2. Performance of Zigbee Topologies for 915MHz and 2.4 Ghz Frequency Band
|
Resulted Parameters (Maximum Average) |
Frequency Band = 2.4 GHz |
Frequency Band = 915MHz |
||||
|
Star |
Tree |
Mesh |
Star |
Tree |
Mesh |
|
|
Throughput (bits/sec) |
31320 |
45860 |
29290 |
30200 |
29500 |
28500 |
|
Load (bits/sec) |
32440 |
45860 |
29110 |
31320 |
31850 |
29500 |
|
Delay (seconds) |
0.0094 |
0.00103 |
0.00918 |
0.104 |
0.15 |
0.083 |
It can be seen from the Fig. 13 that for 50kbps, tree topology gives highest throughput (about 33800 bits/sec) and throughput of mesh topology (32600 bits/sec) and star topology give least throughput (30500 bits/sec). By increasing data rate more than 100kbps throughput of mesh increased (38300 bits/sec) and throughput of tree topology also increased (49000 bits/sec) and fluctuation in throughput of both topologies mesh and tree decreased
But further increase in data rate decreases the throughput of tree and mesh topologies. Throughput of star topology remains same for 100 kbps and 150 kbps.
■ MyWork-MeshT opology_50kbps-DES-1
■ MyWork-StarTopology_5Okbps-DES-1
□ MyWork-Treel opology_50kbps-DES-1
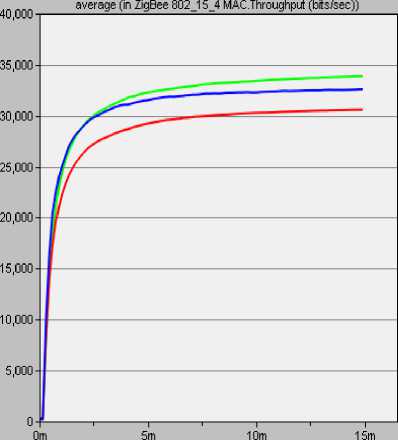
Fig.13. Throughput (50kbps)
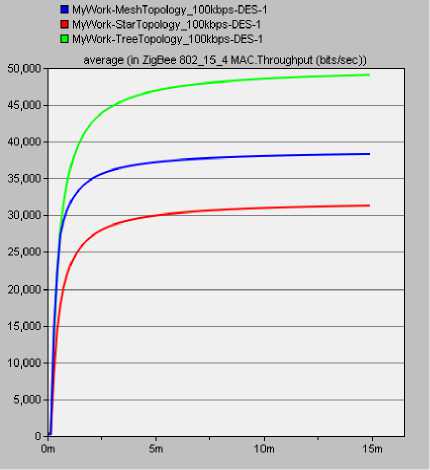
Fig.14. Throughput (100kbps)
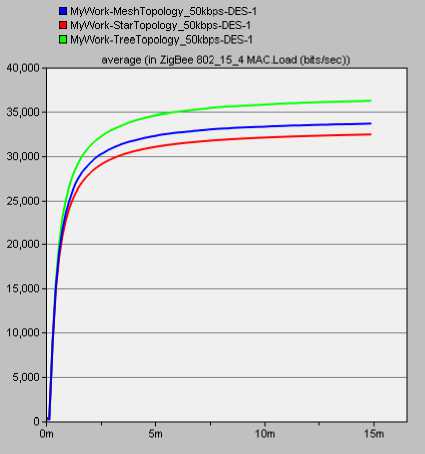
Fig.16. Load (50kbps)
■ MyWork-MeshTopology_150kbps-DES-1
■ MyWork-StarTopology_150kbps-DES-1
□ MyWork-TreeTopologyJ 50kbps-DES-1
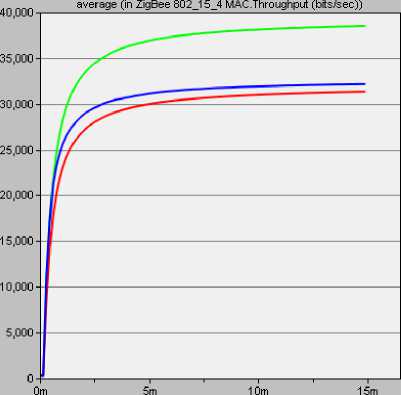
Fig.15. Throughput (150kbps)
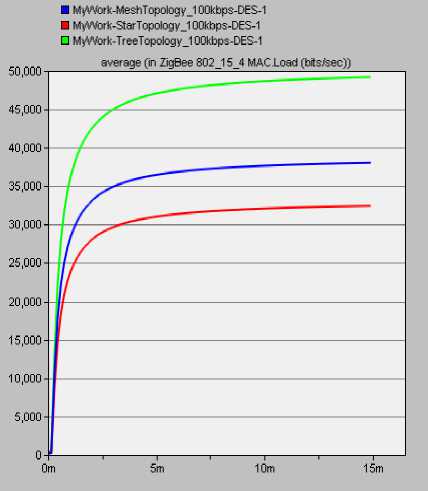
Fig.17. Load (100kbps)
It can be seen from the below figures that for 50kbps, tree topology show highest load (about 36200 bits/sec) but show minor fluctuation and load of mesh topology (33600 bits/sec) also fluctuate and star topology give least load (32400 bits/sec). By increasing data rate to 100kbps load of both topologies mesh and tree show increment and do not show fluctuation. But further increase in data rate decrease the load of tree and mesh topologies. Load of star topology show minor change by varying data rate from 50 kbps to 100 kbps but further increase in data rate do not affect the load in star topology.
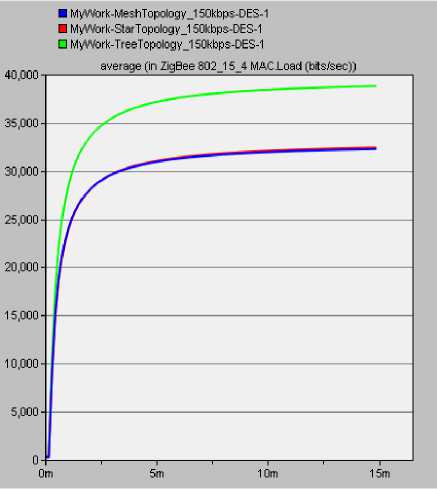
Fig.18. Load (150kbps)
Data traffic sent for 50kbps is highest in tree topology (39700 bits/sec) but show minor fluctuation and data traffic sent of mesh topology (37900 bits/sec) is moderate and show fluctuation and star topology have least data traffic sent (35600 bits/sec). By increasing data rate to 100kbps, data traffic sent of both topologies mesh and tree increase and do not show fluctuation. But further increase in data rate, decrease the data traffic sent of tree and mesh topologies. Data traffic sent of star topology remains show minor variation.
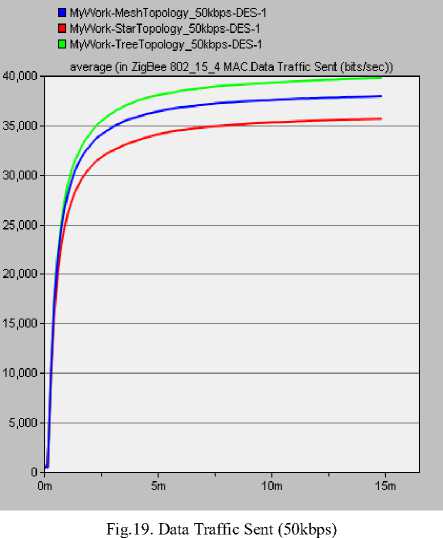
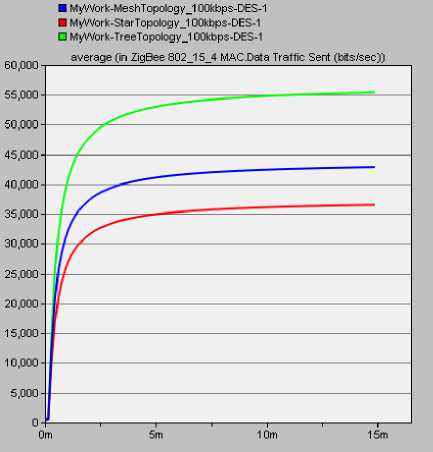
Fig.20. Data Traffic Sent (100kbps)
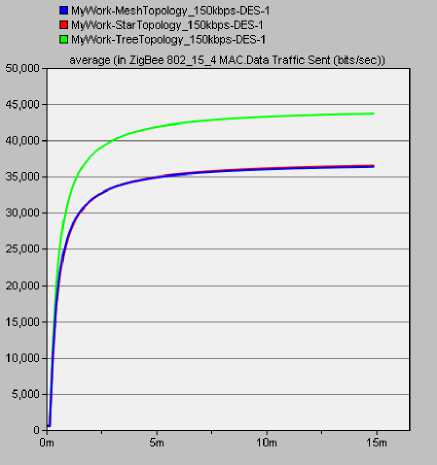
Fig.21. Data Traffic Sent (150kbps)
All the results show that star topology have minor effect by varying data rate from 50 kbps to 100 kbps and tree and mesh topologies perform better for data rate 100kbps. Further increase in data rate fall the performance of tree and mesh topologies. All results have been summarized in Table III.
Table 3. Performance of Zigbee topologies by varying data rate
|
Resulted Parameters |
Data Rate = 50kbps |
Data Rate =100kbps |
Data Rate = 150kbps |
||||||
|
Star |
Tree |
Mesh |
Star |
Tree |
Mesh |
Star |
Tree |
Mesh |
|
|
Throughput (bits/sec) |
30500 |
33800 |
32600 |
31300 |
49000 |
38300 |
31300 |
38500 |
32100 |
|
Load (bits/sec) |
32400 |
36200 |
33600 |
32400 |
49200 |
38000 |
32400 |
38000 |
32200 |
|
Data Traffic Sent (bits/sec) |
35600 |
39700 |
37900 |
36500 |
55400 |
42800 |
36500 |
43700 |
36300 |
|
Data Traffic Received (bits/sec) |
498800 |
513700 |
492700 |
510000 |
773000 |
600000 |
510000 |
584000 |
486000 |
In this 2 network size have been taken one is of 15 nodes and one is of 50 nodes. QoS parameters such as throughput and delay have been evaluated by varying BW as 10 kHz and 100 kHz.
It can be seen from the figure that for small network (15 nodes) there is no change in throughput in each topology by varying BW. Tree topology has highest throughput (45850 bits/sec) for each BW size. Star topology is showing intermediate throughput (31300 bits/sec) for each BW and mesh topology is showing lowest throughput (29200 bits/sec) for each topology. For large network (50 nodes), when BW increases from 10 kHz to 100 kHz then throughput increases in tree (from 181500 bits/sec to 186500 bits/sec) and mesh topologies (113600 bits/sec to 122200 bits/sec). In star topology throughput (108500 bits/sec) remain same for 10 kHz and 100 kHz.
-
■ MyWork-MeshTopologyJ 5node_1 OkHz-DES-1 ■ MyWork-MeshTopologyJ 5node_100kHz-DES-1
-
□ MyWork-StarTopology_15node_1 OkHz-DES-1
-
□ MyWork-StarTopology_15node_100kHz-DES-1
-
□ MyWork-TreeTopology_15node_1 OkHz-DES-1
-
■ MyWork-TreeTopology_15node_100kHz-DES-1
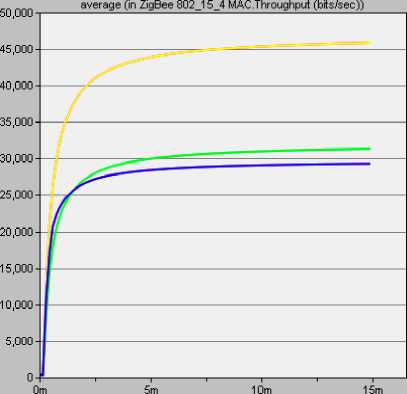
Fig.22. Throughput at 10 kHz and 100 kHz (15 nodes)
-
■ MyWork-MeshTopology_50node_1 OkHz-DES-1 ■ MyWork-MeshTopology_50node_100kHz-DES-1
-
□ MyWork-StarTopology_50node_1 OkHz-DES-1
-
□ MyWork-StarTopology_50node_100kHz-DES-1
-
□ MyWork-TreeTopology_50node_1 OkHz-DES-1 ■ MyWork-TreeTopology_50node_100kHz-DES-1
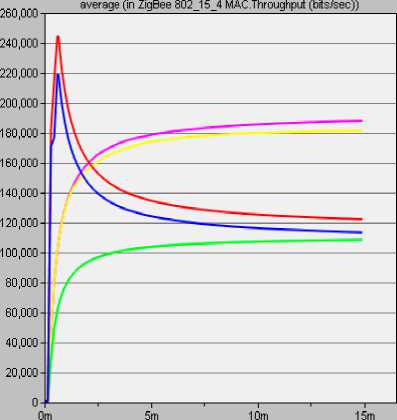
Fig.23. Throughput at 10 kHz and 100 kHz (50 nodes)
As shown in figure that for small network (15 nodes) there is no change in load in each topology by varying BW. Tree topology has highest load (45850 bits/sec) for each BW size. Star topology is showing intermediate load (32400 bits/sec) for each BW and tree topology is showing lowest load (45850 bits/sec) for each topology. But for 50 nodes network, each topology is showing different load. For large network (50 nodes), when BW increases from 10 kHz to 100 kHz then load increases in tree (from 193800 bits/sec to 201300 bits/sec) and in mesh topologies (109100 bits/sec to 115200 bits/sec). In star topology load (109600 bits/sec) remain same for 10 kHz and 100 kHz.
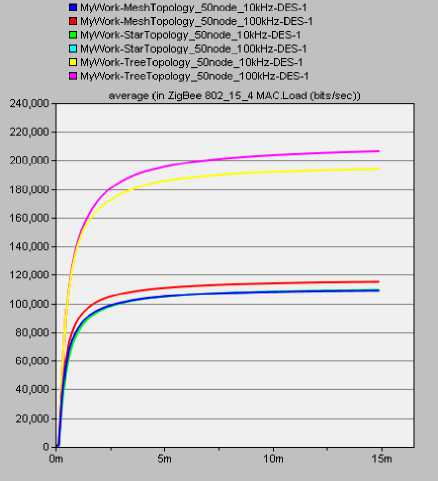
Fig.25. Load at 10 kHz and 100 kHz (50 nodes)
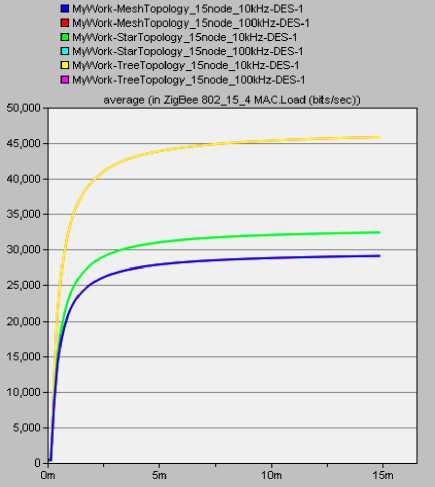
Fig.24. Load at 10 kHz and 100 kHz (15 nodes)
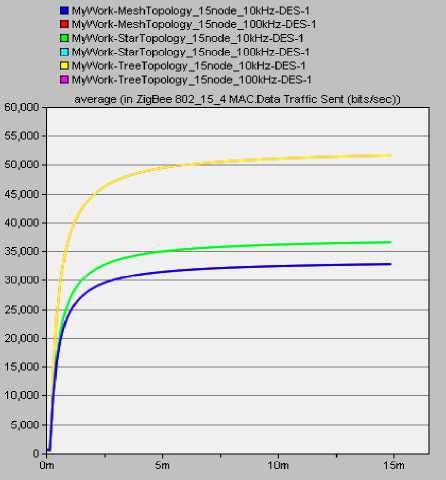
Fig.26. Data Traffic Sent at 10 kHz and 100 kHz (15 nodes)
It can be seen from the figure that for small network (15 nodes) there is no change in data traffic sent in each topology by varying BW. Tree topology has highest data traffic sent (51640 bits/sec) for each BW size. Star topology is showing intermediate data traffic sent (36500 bits/sec) for each BW and mesh topology is showing lowest data traffic sent (32790 bits/sec) for each topology. For large network (50 nodes), when BW increases from 10 kHz to 100 kHz then data traffic sent increases in tree (from 218200 bits/sec to 221600 bits/sec) and mesh topologies (123000 bits/sec to 129900 bits/sec). In star topology data traffic sent (123400 bits/sec) remain same for 10 kHz and 100 kHz.
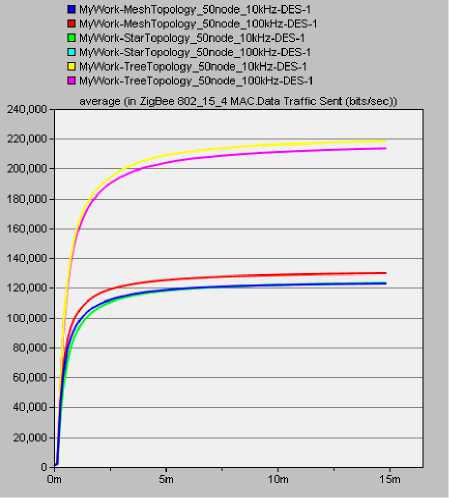
Fig.27. Data Traffic Sent at 10 kHz and 100 kHz (50 nodes)
All the results show that star topology has no effect by varying BW. Throughput, network load, data traffic sent and data traffic received increase in tree and mesh topologies by increasing network size and BW. All results have been summarized in Table III.
Table 4. Performance of Zigbee topologies by varying Bandwidth
|
Network Size= 15 nodes |
||||||
|
BW = 10kHz |
BW = 100kHz |
|||||
|
Star |
Tree |
Mesh |
Star |
Tree |
Mesh |
|
|
Throughput (bits/sec) |
31300 |
45850 |
29200 |
31300 |
45850 |
29200 |
|
Load (bits/sec) |
32400 |
45850 |
29100 |
32400 |
45850 |
29100 |
|
Data Traffic Sent (bits/sec) |
36500 |
51640 |
32790 |
36500 |
51640 |
32790 |
|
Data Traffic Received (bits/sec) |
510000 |
722900 |
458000 |
510000 |
722900 |
458000 |
|
Network Size= 50 nodes |
||||||
|
BW = 10kHz |
BW = 100kHz |
|||||
|
Star |
Tree |
Mesh |
Star |
Tree |
Mesh |
|
|
Throughput (bits/sec) |
108500 |
181500 |
113600 |
108500 |
186500 |
122200 |
|
Load (bits/sec) |
109600 |
193800 |
109100 |
109600 |
201300 |
115200 |
|
Data Traffic Sent (bits/sec) |
123400 |
218200 |
123000 |
123400 |
221600 |
129900 |
|
Data Traffic Received (bits/sec) |
6050000 |
9595000 |
5600000 |
6050000 |
123400 |
1299000 |
V. Conclusion
Performance evaluation has been done in terms of throughput, load, data traffic sent/received and it was observed that tree topology outperforms both in terms of throughput and delay at 2.4 GHz. However it was observed that all the three topologies performs better at 2.4 GHz in comparison to 915 MHz. Further the effect of data rate has been evaluated by varying at 50kbps, 100 kbps and 150 kbps. It was observed that 100 kbps data rate give optimal performance for 15 nodes network but performance of star topology show minor variation in performance. Considering BW as an important resource in the Zigbee network performance evaluation has also been done by varying the BW. It was observed that the network throughput increases with increase in BW. This performance gain can only be achieved for large size networks. Thus the results obtained here, can be used as ready reference for the design engineering implementing Zigbee network based prototypes.
References On the Selection of Physical Layer Optimized Network Topologies for the Zigbee Network
- Muthu Ramya.C, Shanmugaraj.M, Prabakaran.R. Study on Zigbee Technology, IEEE, 3rd International Conference on Electronics Computer Technology (ICECT), Vol. 6, Kanyakumari, India, 8-10 April 2011.
- Jin-Shyan Lee, Yu-Wei Su, and Chung-Chou Shen. A Comparative Study of Wireless Protocols:Bluetooth, UWB, ZigBee, and Wi-Fi. The 33rd annual conference of the IEEE industrial electronics society (IECON), Taipei, Taiwan, 5-8 November, 2007.
- Manpreet, Jyoteesh Malhotra, Zigbee:Cureent Status and Future Scope, International conference on computer and cmputational sciences (ICCCS), IEEE, Greater Noida, India, , 27-29 January 2015.
- Manpreet, Jyoteesh Malhotra. Simulation analysis of tree and mesh topologies in Zigbee network, Internation journal of grid and distributed computing, Vol.1, No. 1, pp. 81-92, 2015.
- Sukhvinder Singh Bamber and Ajay Kumar Sharma. Simulative Performance Evaluation of 802.15.4 with Different Modulations for Wireless Sensor Networks, International journal of computer network and communications, Vol. 2, No. 6, November 2010.
- Khaled Shuaib, Maryam Alnuaimi, Mohamed Boulmalf, Imad Jawhar, Farag Sallabi and Abderrahmane Lakas. Performance. Evaluation of IEEE 802.15.4: Experimental and Simulation Results, Journal of Communications, Vol. 2, No. 4, June 2007.
- Er. Anamika Vatsal , Prof. Mehajabeen Fatima. Impact of Frequency Offset on Interference between Zigbee and Wifi for Smart Grid Applications. IOSR Journal of Electronics and Communication Engineering (IOSR-JECE).Volume 7, Issue 5, PP 59-64, September-October, 2013.
- Wireless Networking Technology Rackley 2007
- Wireless Comm and Networking vijay 2007
- The network simulator- OPNET, http:// www.opnet.com/ solutions/network_rd/modeler.html.
- The network simulator-ns-2, http://www.isi.edu /nsnam /ns/.
- Ke Dong, Dr. Venkatesha Prasad Ranga Rao,Huaizhou Shi “Performance and Fairness Enhancement in ZigBee Networks”, Masters Thesis, Delft University of Technology, Oct 2011.
