Оптическое проявление работы бортовых двигателей низкоорбитальных космических аппаратов

Автор: Белецкий А.Б., Михалев А.В., Хахинов В.В., Лебедев В.П.
Журнал: Солнечно-земная физика @solnechno-zemnaya-fizika
Статья в выпуске: 4 т.2, 2016 года.
Бесплатный доступ
В настоящей работе представлены результаты оптических наблюдений в космическом эксперименте (КЭ) «Радар-Прогресс» 17 апреля 2013 г. и 30 июля 2014 г. после включения сближающе-корректирующего двигателя (СКД) транспортных грузовых кораблей (ТГК) «Прогресс М-17M» и «Прогресс М-23М» на высотах термосферы. Во время работы СКД зарегистрированы области свечения повышенной интенсивности, предположительно связанные с рассеянием сумеречного солнечного излучения на продуктах работы СКД на орбите ТГК и, возможно, с появлением дополнительного свечения в эмиссии атомарного кислорода [OI] 630 нм. Максимальные наблюдаемые размеры области свечения составили ~330-350 км вдоль орбиты и ~250-270 км поперек. Скорость расширения области свечения в первые моменты после включения СКД составила ~6-7 км/c вдоль орбиты и ~3-3.5 км/с поперек. Максимальная интенсивность области возмущения в сеансе КЭ с «Прогресс М-17M» оценивается величиной, эквивалентной ~40-60 Рл в спектральной полосе 2 нм. В сеансе с «Прогресс М-23М» в ближней и дальней зонах от орбиты ТГК зарегистрированы незначительные возмущения атмосферной эмиссии [OI] 630.0 нм, возможно, связанные с инжекцией выхлопных газов СКД.
Собственное свечение атмосферы, ионосфера, космические аппараты
Короткий адрес: https://sciup.org/142103623
IDR: 142103623 | УДК: 550.388.1, | DOI: 10.12737/21169
Текст научной статьи Оптическое проявление работы бортовых двигателей низкоорбитальных космических аппаратов
Optical effects caused by spacecraft (SC) flights and their running approach correction engines (ACE) are divided into several types depending on mechanisms, heights, and spatial scales of their manifestation [Adushkin et al., 2000; Platov et al., 2003]. Mechanisms of ACE impact on Earth’s atmosphere and ionosphere, which occurs with optical effects, are directly associated with cargo spacecraft exhaust jets containing gas and dispersed components, sunlight scattering by them [Adushkin et al., 2000], modification of the atmosphere and ionosphere by ACE exhaust jets [Mendillo et al., 1975; Karlov et al., 1980], hydrodynamic disturbances such as acoustic gravity waves [Karlov et al., 1980; Mikhalev and Ermilov, 1997; Mikhalev, 2011], etc. Most optical effects are observed in the troposphere and stratosphere when their brightness is relatively high [Platov et al., 2003].
This paper presents optical observations made during the Radar-Progress active space experiments on April 17, 2013 and July 30, 2014 after start of ACE of the Progress-M cargo spacecraft in the thermosphere.
RADAR-PROGRESS ACTIVE SPACE EXPERIMENT
The space experiment SE “Investigation of ground-based observations of reflection characteristics of ionospheric plasma irregularities generated by onboard engines of Progress cargo spacecraft” (code “Radar-Progress”) has been performed since 2007. Until 2010, this experiment was called Plasma-Progress SE [Lebedev et al., 2008; Potekhin et al., 2009; Khakhinov et al., 2010, 2012, 2013]. Participating organizations: FSUE TSNIIMASH, ISTP SB RAS, and RSC Energia.
The Radar-Progress space experiment is held during Progress SC autonomous flights upon completion of its main mission of delivering cargo to the International Space Station (ISS). A SE session is performed during an SC flight in the field of view of the Irkutsk Incoherent Scatter Radar (IISR) [Khakhinov et al., 2009]. The onboard liquid jet ACE is activated. We employ unique ground-based scientific facilities and equipment of the ISTP SB RAS Common Use Center (CUC) “Angara” [].
During or immediately after a SE session, we determine heliogeophysical and weather conditions: solar activity, geomagnetic conditions, background parameters of the ionosphere, light conditions (solar zenith angle), cloudiness.
We pre-plan governing conditions for each SE session: orbital height, direction of an exhaust velocity vector, type and duration of ACE operation. The last ones define the mass of burned fuel and the amount of exhaust gases injected into the ionosphere. The ACE in use burns 1 kg of liquid fuel per second. Working for 11 s, the ACE injects exhaust jets from 11 kg of fuel into the ionosphere along the arc of the SC orbit more than 80 km long. Such insignificant effects on ionospheric plasma, comparable in strength to natural sources of disturbances, and the pre-planned conditions for each session constitute a distinguishing feature of the ongoing SE.
EXPERIMENTAL CONDITIONS, EQUIPMENT AND OBSERVATIONAL METHODS
Conditions of the April 17, 2013 SE session (Progress M-17-M SC). Heliogeophysical conditions: very quiet geomagnetic conditions, the solar activity index F 10.7=107.1, the maximum electron density 5.87·105 cm–3 was at 301 km. Meteorological conditions favored photometric measurements. Design conditions: the SC orbital height was 412 km, the duration of ACE operation was 9 s (13:24:38–-13:24 47 UT), which corresponds to combustion of 9 kg of fuel; the direction of fuel jets was toward IISR beam. Optical equipment is installed at 120 km from IISR, at the ISTP SB RAS Geophysical Observatory (GO) (52° N, 103° E).
Conditions of the July 30, 2014 SE session (Progress M-23M SC) . Heliogeophysical conditions: quiet geomagnetic conditions, the solar activity index F 10.7=157, the maximum electron density 2.8·105 cm–3
was at 352 km. Meteorological conditions favored photometric measurements. Design conditions: the SC orbital height was 418 km, the duration of ACE operation was 8 s (18:11:10–18:11:18 UT), which corresponds to combustion of 8 kg of fuel; the direction of fuel jets was toward GO.
The estimated molar percentage of exhaust gases:
-
• H 2 O=2.932·10–1, N 2 =2.676·10–1, CO=1.932·10–1,
-
• H 2 =1.877·10–1, CO 2 =4.946·10–2, H=8.524·10–3,
-
• NO=3.392·10–4, OH=2.853·10–5, O 2 =2.744·10–5,
-
• O=1.391·10–5, N=5.376·10–8.
-
• gasing rate is ~ 2.8 km/s,
-
• density is ~ 2.7·10–3 kg/m3,
-
• temperature is ~ 590 K.
We have used the following optical equipment: spectrograph SATI-1M [], a wide-angle color CCD camera
[], a wide-angle optical system KEO Sentinel designed to observe the spatial distribution of [OI] 630 nm emission intensity. The July 30, 2014 SE session additionally used a high-aperture monochromator MDR-2 equipped with an image intensifier tube (IIT) and a CCD camera.
The SATI-1M spectrograph was developed from the ISP-51 spectrograph (LOMO design) and from the color CCD matrix SONY ICX285AQ (camera Videoscan-285 produced by NPO Videoscan, []). In order for the matrix dimensions to agree with the dimensions of the spectra in the focal plane, a Gelios-40 lens (F=85 mm, 1:1.5) is installed as a camera lens. The entrance spectrograph slit is illuminated by the Jupiter-3 lens (F=50 mm, 1:1.5). The operating spectral bandwidth of the spectrograph is 400–700 nm, exposure time is 260 s, the optical SATI 1M axis points northward with a zenith angle of ~67°.
The Filin-1C camera was developed from the cooled color CCD matrix Kodak KAI-11002 (camera Videoscan-11002 designed by NPO Videoscan, []). As the entrance lens we use the Mir-20 lens (F=20 mm, 1:3.5). The camera has a thermostable case, a rotating turret, and is pointed toward the northern sky, toward the celestial pole. The angular field of view of the Filin-1C camera is ~90°, the exposure time is 300 s, the matrix resolution is 4004×2671 pixel.
The wide-angle optical system KEO Sentinel centered on the atomic oxygen line [OI] 630 nm is produced by KEO Scientific Ltd []. The field of view of the optical system is 145°; the half-width of the interference filter (630 nm) is ~2 nm; the optical system is directed to the zenith; the exposure time is 30 s; the binning is 4. Frames are taken continuously, one by one. The technical pause between frames is ~1 s.
The spectrograph developed from the high-aperture monochromator MDR-2 (MDR-2 spectrograph), IIT, and CCD matrix is designed to record the spectral composition of airglow at high temporal resolu-109
tion. Its primary purpose is to study disturbances in the main emission lines and bands (OI 557.7, OI 630.0, NaI 589.0–589.6 nm, etc.), continuum, and individual weak emissions during heliogeophysical disturbances of different nature. The viewing direction is the zenith; the field of view is ~10°; the exposure time is 10 s; frames are taken continuously.
The solar zenith angle during ACE operation in the April 17, 2013 SE was ~–100°, i.e. observations were carried out under nautical twilight conditions.
For the July 30, 2014 SE, this angle was ~–109°, i.e. observations were made in conditions close to astronomical twilight.
The Progress M-17M and Progress M-23M SC fight paths did not fall within the field of view of the SATI-1M spectrograph and the wide-angle color CCD camera. These devices are used for patrol observations of natural (background) nightglow and for monitoring heliogeophysical disturbances, which require fixed orientation of these devices. In this work, they are employed to monitor the atmosphere transparency, the dynamics of the main emission lines of the upper atmosphere, and to record disturbances in atmospheric regions distant from the injection of Progress M-17M and Progress M-23M SC exhaust gases.
OBSERVATIONAL RESULTS
Optical observations (KEO Sentinel optical system)
April 17, 2013 experiment
While ACE was running, the zenith of the lower boundary of the atmosphere still illuminated by the Sun was at ~140 km. Thus, SC and its surrounding area were illuminated by direct solar radiation. This favored light scattering by gas and dispersed components of ACE fuel jets. On the other hand, these conditions have already allowed the detection of airglow in order to evaluate optical effects observable during ionospheric modification [Mendillo, Baumgardner, 1982], in particular in the 557.7 and 630 nm atomic oxygen emission lines.
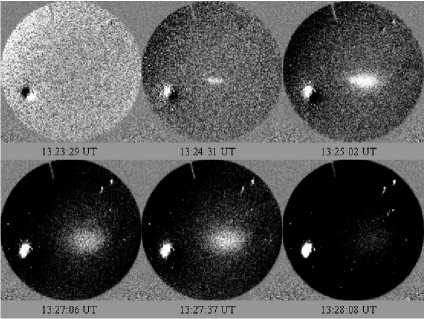
Figure 1 . Sequence of processed frames taken by the KEO Sentinel optical system in the 630 nm emission line on April 17, 2013 The ACE running time is 13:24:38–13:24:47 UT
Figure 1 presents observational data acquired by the all-sky camera at 630 nm during ACE operation. The starting time of exposure of respective frames is specified. Images were obtained by subtracting the key frame, taken just before ACE ignition, from current frames. The bright spot in the bottom left part of the images is an image of the Moon, broadened due to the blooming effect. The processing technique is described in more detail in [Mikhalev et al., 2016].
From the frame with the starting time of exposure at 13:24:31 UT, including the time of ACE running, to the south-east of the center of images (zenith) there is a region of enhanced emission, which in subsequent moments extends along and across the SC flight path. This region was observed for a total of ~5 min. According to preliminary estimates, with the height of the SC flight path of ~400 km the rate of emission expansion for the first 60 seconds after ACE ignition was ~ 7 km/s and ~3.5 km/s along and across the SC orbit respectively. Maximum dimensions of the region were observed in ~120–150 s and were ~350 and ~250 km along and across its orbit respectively.
Brightening of the disturbed part of the image at a maximum relative to the surrounding background was ~20 %. Given that the natural intensity of atmospheric emission at the zenith at early night is usually 200–300 R (this is consistent with the measurement data on the 630 nm emission intensity acquired by SATI-1M in the northern sky (Figure 3)), we can estimate the equivalent maximum disturbance intensity at ~40–60 R in the 2 nm spectral bandwidth of the interference filter.
July 30, 2014 experiment
Figure 2 shows a sequence of frames similar to that presented in Figure 1. From the frame with the starting time of exposure at 18:11:19 UT (Figure 2), taken immediately after ACE ignition (18:11:18 UT), there is a region of enhanced emission, which in subsequent moments extends along and across the SC flight path.
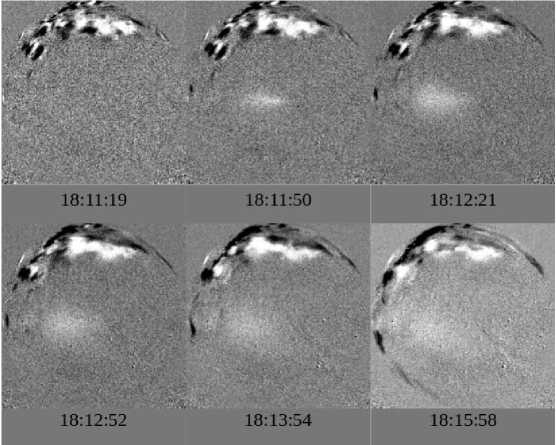
Figure 2. Sequence of processed frames taken by the KEO Sentinel optical system in the 630 nm emission line on July 30, 2014. The ACE running time is 18:11:10–18:11:18 UT
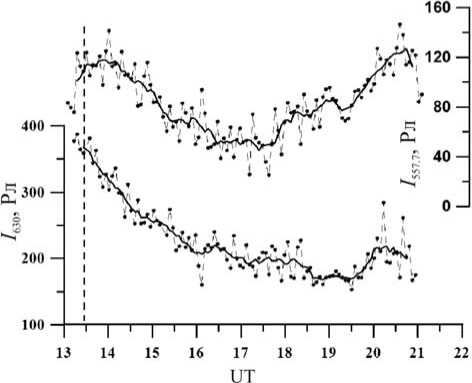
Figure 3 . Variations in the intensity of [OI] 557.7 and 630.0 nm emission lines during the night on April 17/18,
2013. The vertical dashed line indicates the time interval of ACE running
According to preliminary estimates, the expansion rate, maximum observed dimensions, and total time of observation are similar to those determined for the April 17, 2013 SE session.
Spectral observations (SATI-1M and MDR-2 spectrographs)
April 17, 2013 experiment
Figure 3 presents observations of the airglow intensity in the atomic oxygen emission lines [OI] 557.7 nm (heights of the emission are ~85–115 km) and [OI] 630.0 nm (~180–300 km) during the April 17/18, 2013 night as inferred from SATI-1M data. These lines are dominant emissions that are normally recorded in ionospheric modification experiments during SC ACE operation [Mendillo, Baumgardner, 1982]. The natural airglow was observed at ~235 km (for the height of the maximum spontaneous emission at 557.7 nm) and ~600 km (630.0 nm) northward of the zenith. In Figure 3, the vertical dashed line indicates the time interval of ACE operation. The preliminary analysis of 557.7 and 630 nm emission intensity variations does not allow us to identify disturbances produced by ACE ignition, which far exceed natural variations of these emissions. This leads to the tentative conclusion that there is no large-scale ionospheric modification in this SE session.
July 30, 2014 experiment
In the July 30, 2014 experiment, we employed the SATI-1M spectrograph and the MDR-2 spectrograph that was oriented toward the near-zenith region of the sky close to the Progress M-23M SC flight path. This provided the possibility of comparing the behavior of the 630 nm emission intensity for the first minutes after ACE was cut off, using the two differently directed spectral instruments.
Figure 4 illustrates 630 nm emission intensity variations as inferred from observational data acquired by the SATI-1M and MDR-2 spectrographs. ACE was started in the second half of the night against the natural decrease in the 630 nm emission intensity. Unlike the SATI-1M spectrograph with the exposure time of 260 s, the exposure time of the MDR-2 spectrograph was 10 s. Perhaps this may explain the fairly large signal variations in the MDR-2 spectrograph channel. Nevertheless, by smoothing initial data (averaging over 5 points for 112
MDR-2 and over 3 points for SATI-1), we can find tendencies for minor increases in 630 nm emission intensities after ACE was cut off, using both the devices. Maximum intensities were observed in 7–12 min for MDR-2 data and in 14–18 min for SATI-1M data.
RESULTS
Geophysical conditions of observations, typical lifetimes, and spatial dimensions of observed optical structures allow us to examine two mechanisms of the observed optical effects.
The former one may be associated with the scattering of sunlight by ACE exhaust jets [Adushkin et al., 2000; Platov et al., 2003]. Platov et al. [Platov et al., 2011] note that the most important factor determining the intensity of such effects is the presence of dispersed particles. The dispersed particles originate from vapor and carbon dioxide condensation in an exhaust jet.
The latter mechanism is related to ionospheric modification and emergence of additional radiation in the [OI] 630 nm atomic oxygen emission [Mendillo, Baumgardner, 1982]. The analysis of data on spatial distribution of the [OI] 630 nm emission, acquired by the wide-angle optical system KEO Sentinel during Progress M-17M and Progress M-23M SC ACE operation enables us to reliably identify regions with enhanced emission.
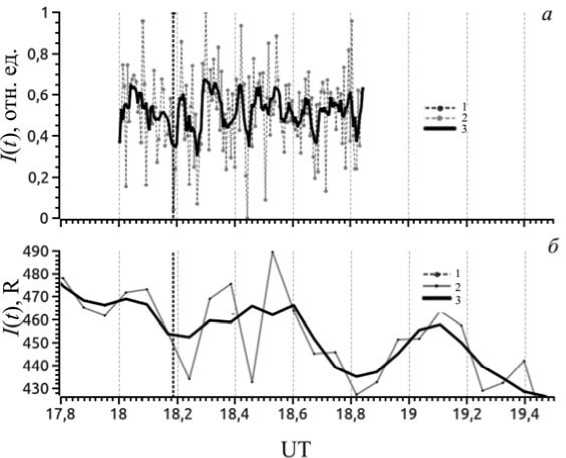
Figure 4 . Variations in the 630 nm emission intensity as inferred from observational data obtained by the MDR-2 ( a ) and SATI-1M ( b ) spectrographs. Line 1 is the time interval of ACE operation, line 2 indicates initial data; line 3 marks average data (5 points for MDR-2 data ( a ) and 3 points for SATI1-M data ( b ))
The maximum observed dimensions of the region are ~330–350 km and ~250–270 km along and across the orbit respectively. The rate of emission expansion at the first moments after the start of ACE is ~6–7 km/s and ~3–3.5 km/s along and across the orbit respectively.
Supersonic extension (~1–4 km/s) of optical structures in the upper atmosphere during ACE operation has been observed previously [Vetchinkin et al., 1993; Tagirov et al., 1995]. One of the mechanisms of propagation of ACE exhaust jets in the upper atmosphere is considered to be diffusion. In the region covered by diffusion, ACE exhaust jets, in addition to the normal process of mixing with the atmosphere, can lead to changes in aerodynamic processes at injection heights and occur with ionospheric modification, including changes in airglow in the main emission lines and bands [Adushkin et al., 2000].
Data acquired by the optical system KEO Sentinel does not allow us to divide effects of the light scattering by ACE exhaust jets and ionospheric modification (630 nm emission increase). Of particular interest in this regard are the spectral observations in the experiment with the Progress M-23M SC and the results obtained previously by other authors in active experiments with injection of large masses of burned fuel.
Thus, according to [Biondi, Simpler, 1984], the injection of ~2.7·1026 CO2 and 7.4·1026 H2O molecules into the ionosphere at ~323 km led to the formation of an enhanced emission region. Within 2 min after the injection, the 630 nm emission increased up to 400 R, and in 3 min the enhanced emission region expanded to a diameter of 250 km.
In the experiment described in [Bernhadt et al., 1986], 18 kg of SF 6 were injected at a height of ~350 km. This resulted in the formation of a 56 km enhanced emission region. The OI emission at the 777.4 and 630 nm lines exceeded the background by 150 and 15 R respectively; the maximum intensities were observed 2 min after the injection.
In [Mendillo, 1980; Mendillo et al., 1981], the authors describe the results of the study of ionospheric effects of the HEAO-C spacecraft launch. On launch, the spacecraft injected 7×1029 H 2 O and H 2 into the atmosphere, thus leading to the formation of an ionospheric hole, which extended its influence over an area of (1÷3)·106 km2. The hole was located along the spacecraft track at 2000–3000 km to the east of the launch site; its transverse size was 600–1000 km. In the center of the hole at the first two minutes, more than 80% of electrons and ions disappeared. The integral vertical emission at a wavelength of 630 nm in the hole was 8300 R (before the launch of the spacecraft, it was 100 R). The 557.7 nm emission increased from 300 to 900 R. The maximum intensities were observed a few minutes after the SC launch, and in 10–20 min the intensities returned to their baseline values. A similar situation was noted in [Mendillo, Baumgardner, 1982] which took place during the NOAA-C SC launch followed by a burst of the 630 nm emission at a maximum up to 9 kR.
Of key importance for us in the results obtained in the above studies are the characteristic dimensions of enhanced emission regions and the dynamics of optical structures and atmospheric emissions.
So, according to the reported data, sizes of the disturbed region transverse to the SC flight path can be as large as 600–1000 km, which is comparable to the distance from the zenith direction of the region, where the 630 nm emission was detected by the SATI-1M spectrograph (~600 km). In our case, with the 114
recorded velocities (~3 km/s) of disturbances across the SC flight path, it takes the disturbances ~3 min or more to get the working area of the SATI-1M spectrograph (if the propagation velocity decreases).
According to the reported data, the emission in the injection zone peaked two or more minutes after the injection of exhaust gases. The characteristic lifetime of regions with enhanced 630 nm airglow ranges from one to tens of minutes.
The time delays of 630 nm emission intensity maxima recorded on July 30, 2014 (7–12 min for the near-region and 14–18 min for the far region) and the characteristic lifetime of the disturbance in the 630 nm emission intensity (~5–15 min) are comparable by orders of magnitude to the published data acquired in similar experiments with the injection of large amounts of chemicals into the upper atmosphere and with the ionospheric modification.
In interpreting spectral observations, of particular importance is yet another experimental fact such that several Radar-Progress experiments detected an electron density decrease [Khakhinov et al., 2013] characteristic of ionospheric modification. This is attributed to the reaction of dissociative recombination of molecular ions (H 2 O+, O 2 +, OH+), which may arise from injection of H 2 O, H 2, CO 2 and OH molecules composing ACE exhaust gases .
Hence, we can state that the nature of the observed peculiarities of OI 630 nm emission variations in the spectral observations on July 30, 2014 does not exclude that they might be caused by the injection of ACE exhaust gases. Indeed, confirmation of this result requires further investigations in order to determine the most favorable geophysical conditions for this effect and, in particular, to interpret the absence of this effect on April 17, 2013.
CONCLUSION
The analysis of optical observations carried out during sessions involving the Progress M-17M SC on April 17, 2013 and the Progress M-23M SC on July 30, 2014 allows for the following conclusions.
-
1. During ACE operation, we detected regions with enhanced emission, which might have been caused by the scattering of twilight solar radiation by ACE exhaust gases along the SC flight path or by the appearance of an additional airglow in the [OI] 630 nm atomic oxygen emission. The maximum observed dimensions of the emission region were ~330–350 and ~250–270 km along and across the orbit respectively. The rate of emission expansion at the first moments after the start of ACE was ~6–7 km/s and ~3–3.5 km/s along and across the orbit respectively. The maximum intensity of the disturbed region for the Progress M-17M SC is estimated at ~ 40–60 R in the 2 nm spectral bandwidth.
-
2. In the SE session with Progress M-23M on July 30, 2014, we recorded minor disturbances of atmospheric [OI] 630.0 nm emissions in the near and far regions from the SC flight path, which might have been caused by the injection of ACE exhaust gases.
The work was carried out using the scientific equipment of the ISTP SB RAS Common Use Center “Angara” and was supported by the grant No. NSh-6894.2016.5 of the President of the Russian Federation for State Support of Leading Scientific Schools.
Список литературы Оптическое проявление работы бортовых двигателей низкоорбитальных космических аппаратов
- Адушкин В.В., С.И. Козлов, А.В. Петров. Экологические проблемы и риски воздействия ракетно-космической техники на окружающую среду: Справочное пособие. М.: Изд. Анкил, 2000. 638 с.
- Ветчинкин Н.В., Границкий Н.В., Платов Ю.В., Шейчуе А.И. Оптические явления в околоземной среде при работе двигательных установок ракет и спутников. I. Наземные и спутниковые наблюдения искусственных образова-ний при запусках ракет//Косм. иссл. 1993. Т. 31, вып. 1. С. 93-100.
- Карлов В.Д., Козлов С.И., Ткачев Г.Н. Крупномасштабные возмущения в ионосфере, возникающие при полете ракеты с работающим двигателем (обзор)//Косм. иссл. 1980. Т. 18, вып. 2. С. 266-277.
- Лебедев В.П., Хахинов В.В., Габдуллин Ф.Ф. и др. Исследование методами радиозондирования харак-теристик плазменного окружения низкоорбитальных космических аппаратов//Космонавтика и ракетостроение. 2008. № 50 (1). С. 51-60.
- Михалев А.В., Ермилов С.Ю. Наблюдение возмущений эмиссионных ионосферных слоев, возникаю-щих при полете космических систем//Иссл. по геомагнетизму, аэрономии и физике Солнца. Новосибирск: СО РАН, 1997. Вып. 107. С. 206-217.
- Михалев А.В., Хахинов В.В., Белецкий А.Б. и др. Оптические эффекты работы бортового двигателя космического аппарата «Прогресс М-17М» на высотах термосферы//Косм. иссл. 2016. Т. 54, № 2. С. 113-118.
- Платов Ю.В., Куликова Г.Н., Черноус С.А. Классификация газопылевых образований в верхней атмо-сфере, связанных с выбросами продуктов сгорания ракетных двигателей//Косм. иссл. 2003. Т. 41, № 2. С. 168-173.
- Платов Ю.В., Семенов А.И., Филиппов Б.П. Конденсация продуктов сгорания в выхлопной струе ра-кетных двигателей в верхней атмосфере//Геомагнетизм и аэрономия. 2011. Т. 51, № 4. С. 556-562.
- Хахинов В.В., Потехин А.П., Лебедев В.П. и др. Радиофизические методы диагностики ионосферных возмущений, генерируемых бортовыми двигателями ТГК «Прогресс»: алгоритмы, инструменты и результаты//Журнал радиоэлектроники. 2010. С. 555-571.
- Хахинов В.В., Потехин А.П., Лебедев В.П. и др. Результаты дистанционного зондирования ионосфер-ных возмущений в активных космических экспериментах «Радар-Прогресс»//Современные проблемы дистанционного зондирования Земли из космоса. 2012. Т. 9, № 3. С. 199-208.
- Хахинов В.В., Потехин А.П., Лебедев В.П. и др. Некоторые результаты активных космических экспе-риментов «Плазма-Прогресс» и «Радар-Прогресс»//Вестник Сибирского государственного аэрокосмического университета им. академика М.Ф. Решетнева. Спец. вып. 2013. № 5 (51). С. 160-163.
- Bernhadt P.A, Weber E.J., Moorc J.G., et al. Excitation of oxygen permitted line emissions by SF injection into the F region//J. Geophys. Res. 1986. V. A91, N 8. P. 8937-8946.
- Biondi Manfred A., Simpler Dwight P. Studies of equatorial 630 nm airglow enhancements produced by a chemiсal release in F region//Planet and Space Sci. 1984. V. 32, N 12. P. 1605-1610.
- Khakhinov V.V., Lebedev V.A., Medvedev A.V., Ratovsky K.G. Capabilities of the Irkutsk incoherent scat-tering radar for space debris studies//Proc. 5th European Conf. on Space Debris. ESA SP-672. Darmstadt, Germany, 2009.
- Mendillo M.J., Hawkins G.S., Klobuchar J.A. A sudden vanishing of the ionospheric F region due to the launch of Skaylab//J. Geophys. Res. 1975. V. 80, N 16. P. 2217-2218.
- Mendillo M.J. Report on investigations of atmospherique effecte due to HEAO-C launch//AIAA Pap. 1980, no. 888. pp. 1-5.
- Mendillo M., Rote D., Bernhardt P.A. Preliminary report on the HEAO hole in the ionosphere//EOS Trans. Amer. Geophys. Union. 1981. V. 61, N 28. P. 529-530.
- Mendillo M., Baumgardner J. Optical signature of ionospheric hole//Geophys. Res. Lett. 1982. V. 9, N 3. P. 215-218.
- Mikhalev А.V. Midlatitude airglow during heliogeophysical disturbances//Geomagnetism and Aeronomy. 2011. V. 51, N 7. P. 974-978.
- Potekhin A.P., Khakhinov V.V., Medvedev A.V., et al. Active space experiments with the use of the transport spacecraft Progress and Irkutsk IS Radar//PIERS Proc. Moscow, 2009. P. 223-227.
- Tagirov V.R., Arinin V.A., Ismagilov V.V., Klimenko V.V. Unusual optical emission in the atmosphere caused by human activity//22nd European Meeting on Atmospheric Studies by Optical Methods. Finland, Nurmijarvi. 1995. P. 7.
- URL: http://ckp-angara.iszf.irk.ru/html/history.html (дата обращения 5 сентября 2016 г.).
- URL: http://atmos.iszf.irk.ru/ru/ground-based/spectr (дата обращения 5 сентября 2016 г.).
- URL: http://atmos.iszf.irk.ru/ru/ground-based/color (дата обращения 5 сентября 2016 г.).
- URL: http://videoscan.ru (дата обращения 5 сентября 2016 г.).
- URL: http://keoscientific.com/space-science-imagers.php#SEN-TINEL (дата обращения 5 сентября 2016 г.).
