Optimal Placement and Sizing of Capacitor and Power-Electronic Interfaced Distributed Generation in Heavy Harmonic Polluted Systems

Author: Mohamadreza Heydari Sharafdarkolai, Hamed Dehghan Niyazi, Tahere daemi, Ali Akbar Kasiri
Journal: International Journal of Intelligent Systems and Applications(IJISA) @ijisa
Article in issue: 7 vol.6, 2014.
Free access
Presence of distributed generation (DG) in distribution systems has significant impacts on the operational characteristics of these systems, also using capacitor for reactive compensation and loss reduction is so common. Injected harmonic currents from non-linear loads into distribution system distort all of voltages and currents and must be considered when placing the capacitor banks so that the resonance will not occur. Distributed Generation is often connected to the network via power-electronic interfaces for a proper coupling with the distribution networks. Inverters are capable of producing harmonic components and can be used as ancillary services for reducing harmonics by designing of a proper controlling system. In this paper discrete particle swarm optimization (DPSO) approach is used for the optimal placement and sizing of distributed generations and capacitors in distorted distribution systems for simultaneous voltage profile improvement, loss and total harmonic distortion (THD) reduction. Constraints include voltage limit, voltage THD, number/ size of capacitors and generators. For evaluating the proposed algorithm, the IEEE 33-bus test system is modified and employed.
Capacitor, Distributed Generation, Discrete Particle Swarm Optimization, Harmonic, Optimal Placemen, Power-Electronic, Resonance
Short address: https://sciup.org/15010582
IDR: 15010582
Text of the scientific article Optimal Placement and Sizing of Capacitor and Power-Electronic Interfaced Distributed Generation in Heavy Harmonic Polluted Systems
Published Online June 2014 in MECS
search [1], analytical approaches [2].[3], second-order algorithm [4], meta-heuristic approaches[5].[6], fuzzy-GA algorithm[7], etc. Most of these techniques suffer from the inability to escape local optimal and burden heavy computational time. PSO (particle swarm optimization) is a good method which is fast and has ability to escape local optimal. PSO is a self-adaptive search optimization was introduced by Kennedy and Ebhart[8]. PSO has been applied to many optimization problems such as: dynamic systems [9], optimal capacitor placement in distribution system [10], constrained optimization [11], multi- objective optimization problems [12], etc. Some works have used PSO for optimal placing of capacitors, it was considered as a continuous problem but as we know capacitors are commercially available in discrete sizes, so in this paper a modified version of PSO which is suitable for discrete problems and is called discrete particle swarm optimization (DPSO) or binary particle swarm optimization is used.
The rest of this paper is organized as follows: in section II an ancillary service for improving system's power quality will be introduced. Problem formulation for the objective function for improving voltage profile and minimization of loss and THD is presented in section III. In section IV the PSO algorithm is described briefly. The results of DG and capacitor placement on 33-bus test system are presented and discussed in section V. Finally, section VI summarizes the main points and results of this paper.
-
II. Ancillary Service
The Today's distributed generators and appliances are increasingly built up with power electronics. This trend is expected to grow further in the future. Fig. 1 shows the interface of an inverter-based DG unit operating in standalone mode. 14 Represents the rms value of the ac voltage generated by the inverter. The DG source is tied to the point of common coupling (PCC) through an inverter and a series inductor having an inductance" L" and an internal resistance "R". The presence of nonlinear loads affects the performance of all the loads connected at the PCC. In this case, the nonlinear current (I N L) , drawn by the nonlinear load, leads to a nonlinear voltage drop(V „e) across the line impedance.
Vlilie = V i + 2 V h n (1)
Where 14 is the fundamental component of VHne and Vim represents its nth harmonic component. Hence, even if the inverter is controlled to generate a sinusoidal output voltage, the voltage at the PCC, ( VPc c = Vs — V ,ne ) will be nonsinusoidal. The problem of distorted supply voltage at the PCC, as shown in Fig. 1, can be handled by compensating the nonlinear drop across the line impedance. The compensation voltages, required to eliminate voltage harmonics, are injected across the compensating transformer's secondary windings which are in series with the line. Fig. 2 shows the series compensation scheme, where voltage E Vhn , equal to the nonlinear drop across the line impedance, is applied externally in series with the source to produce sinusoidal voltage at the PCC.
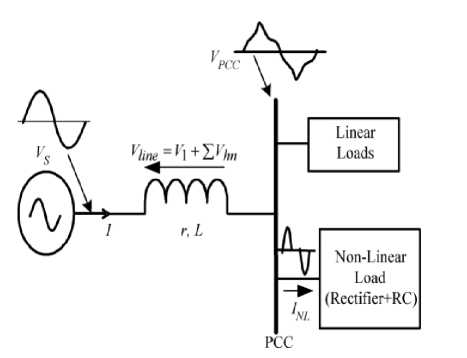
Fig. 1. DG source interface with the loads at the PCC
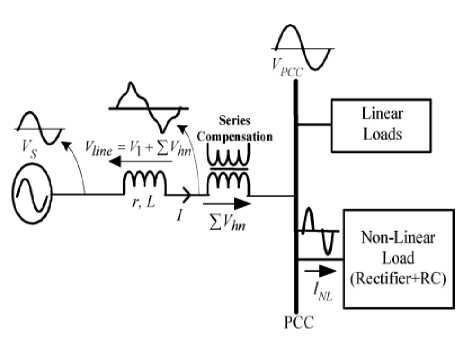
Fig. 2. Series compensation to compensate the voltage drop across line impedance
As mentioned, converters are capable of producing harmonics and can be used as ancillary services for compensating of harmonic voltage drop across the line impedance instead of using external compensator just by using of a good controlling system. Some good control systems are designed and introduced in papers. In this paper, the control system of [13] is used. Fig 3 shows this control system. The detail of this system is fully described in [13]. Harmonic calculator and harmonic generator are two main parts of this control system. Harmonic calculator, calculates the phase and amplitude of harmonics in the system and harmonic generator, generates harmonics which are same in the amplitude and 180 degree shifted phase with their counterpart on the load side. This result cancellation of nonlinear drop across the line impedance to achieve a sinusoidal voltage at the PCC. This controlling system is called harmonic injection system.
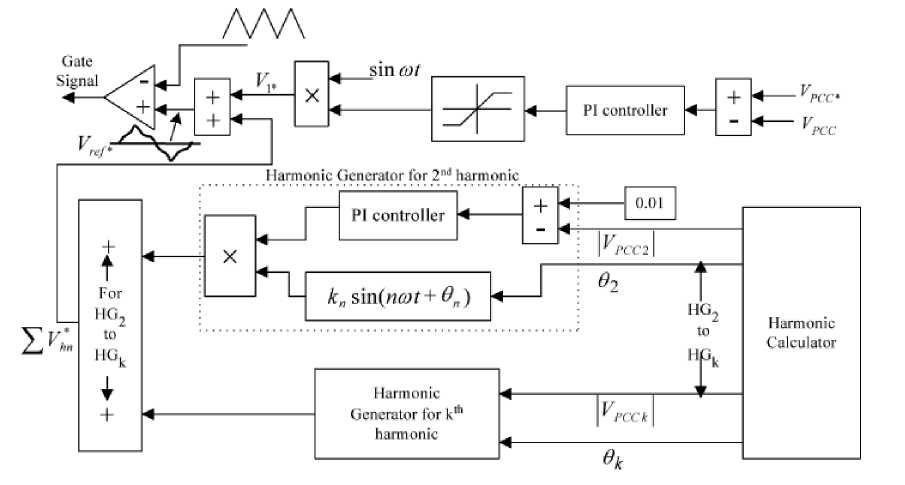
Fig. 3. Schematic diagram of the control scheme
-
III. Problem Formulation
In this paper the following assumptions are made:
-
- Capacitors are fixed type.
-
- Both linear and non-linear loads are presented in a 3-wired 3-phase system.
-
3.1 Constraints
п v = ^пот - Vt л2
^index =∑( ) (4)
^—* "пот 1=1
Where Vпот is the nominal of system voltage (Vпот=1) , V[ is the voltage at node i and n is number of buses.
Voltage constraint will be defined as follows:
утип
≤√ Eh ( Vt )2≤ утах
Where V min is lower , V max is upper bounds of rms voltage and V ih is h th harmonic order of voltage at bus i . In this paper V min =0.95 and V max=1.05.
Total harmonic distortion of voltage (THD) should be less than the maximum of allowable ( THD™>- ).
THDV , =
⎜ ⎛[√ ( 5 ) ]⁄ . ⎟⎞
⎝⎠
≤ THD
max
Where , is the total harmonic distortion of voltage of bus i
In this paper according to IEEE-519, THD max =0.05.
-
3.2 Indexing
-
3.2.1. Voltage Deviation Index
-
3.2 .2 Active and Reactive Power Loss Index
For forming of objective function some indexes are defined.
This index is for improving of voltage profile and defined as follows:
This index is for improving of voltage profile and defined as follows:
^^index = (5)
rL-NO
Ql
QLindex = (6)
VL—NO
Where PL, QL are active and reactive power losses after installation of DG and capacitor respectively and PL-NO , QL-NO are active and reactive power loss before installation.
-
3.2 .3 THD Index
3.2.4 Resonance Index (RES-I)
This index is for minimizing of total harmonic distortion:
n
THDlndex =∑( THDt / THDiN0 ) (7)
Where THDj is the total harmonic distortion of bus I after installation and THDiN0 is the total harmonic distortion of bus I before installation.
Many works concerning capacitor placement, consider all loads are linear, recently some works take non-linear loads into account , so the capacitor placement problem
mixed with harmonic consideration, but as it is shown in [18] even in these works, capacitor placement led to harmonic resonance at one or some harmonic frequencies. In this paper there is a term in the objective function which prevents harmonic resonance. So resonance index is defined as follow:
^^^index =∑∑(V ,h /V i)
-
1 1 n m(8)
-
3.3 Objective Function
+∑∑(Iг /I i)
i=l h=l
Where V ih , IЬ are the voltage and current of bus I at h th harmonic order after installation and V i, I i are before installation of DG and capacitor.
By introducing above indexes objective function is defined as follows:
F = + ^R^index + «3 Q^index
+ ^4THD[n^ex + asRES[ndex (9)
+ PF
Where α is the index weight, these weights indicate the importance of each index in the placement problem. They depend on the required analysis.
PSO is initialized with a group of random particles and then searches for optima by updating generations. In every iteration, each particle is updated by following two "best" values. The first one is the best solution it has achieved so far. This value is called Pbest . Another "best" value tracked by the particle swarm optimizer is the best value, obtained so far by any particle in the population. This best value is a global best and called Sbest . After finding the two best values, the particle updates its velocity and positions with following formulas.
Xi ( t+1)=xi( ‘ )+vi( t+1)(11)
-
V[ ( t+1)=w. V[ ( 1 )+ c-jand
×(Pbest^ - Xi )(12)
+
×( Pbesti - Xi )
Where x and v are the particle position and velocity of the particle respectively. w is the inertia weight, c 1 and c2 are the acceleration constants, and r , r2 are two random values in range [0,1]. The acceleration constants (c , c2) control how far a particle will move in a single iteration. Typically these both are set to a value of 2. The inertia weight (w) is used to control the convergence of behavior of PSO. Small values of (w ) lead to more rapid convergence usually on suboptimal position, but large value may prevent divergence. In general the inertia weight is set according to the following equation:
∑a=1
a=l
a e [0 1]
( ^max - ^min ) \ .
= - . (13)
\ Пестах /
In table 1 these weights are defined, for selecting these weights, the guides of [14].[15] are used.
Table 1. index weights
|
index |
Index weight |
value |
|
^index |
α |
0.3 |
|
P^index |
α |
0.2 |
|
Q^index |
α |
0.2 |
|
THDtndex |
α |
0.15 |
|
REStndex |
α5 |
0.15 |
PF is the penalty factor which has two values zero and a very big number. If any particle violates any above constraints, the PF will be set to the big number and make the objective function become so big. This result omitting of that particle from the solution.
-
IV. PSO Algorithm
The particle swarm optimization algorithm is a stochastic optimization algorithm which maintains a swarm of candidate solutions, referred to as particles, they are members in the population, have their own positions and velocities, and they fly around the problem space in the swarms searching for the position of optima.
For binary discrete search space, Kennedy and Ebhart [21] have adopted the PSO to search in binary space by applying a sigmoid transformation to the velocity component given in (14) to squash the velocities into a range [0,1],and force the component values of position to be 0 or 1. The equation for updating positions in (11) then is replaced by (15)
sigmoid, ( Vi )= 1
1+ e pi
t ={1
if rand < sigmoid ( a-1 ) ot ℎ er wℎ ise
-
V. Simulation Results:
The presented algorithm was implemented in Matlab computing environment. In order to evaluate the proposed algorithm, the 12.6 kv 33-bus IEEE distribution system is modified and applied.
The single diagram of this system is shown in Fig.4. The specification of this system is given in [17] .two none-linear loads are replaced with loads in buses 5 and 26. These loads are two six-pulse converters with active and reactive power of 1MW and 0.75MVAR. The harmonic current spectra of these converters are given in table 2.
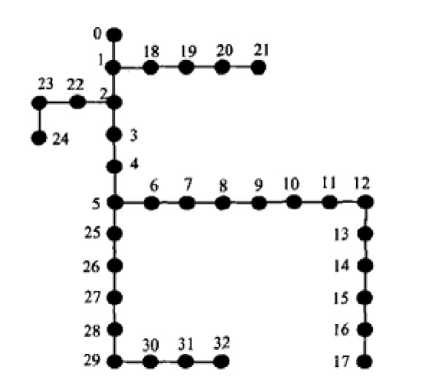
Fig. 4. single line diagram of 33-bus IEEE distribution system
Table 2. six-pulse converter harmonic spectra
|
Harmonic order |
Percentage of harmonic current |
|
1 |
100 |
|
5 |
20 |
|
7 |
14 |
|
11 |
9 |
|
13 |
8 |
|
17 |
6 |
|
19 |
5 |
|
23 |
4 |
|
25 |
4 |
Capacitors and Distributed generations are commercially available in discrete sizes. In table 3and 4 the size of capacitor bank and DG are given:
Table 3. capacitor sizes
|
Capacitor (KVAR)ar) |
Capacitor (KVAR))ar) |
Capacitor (KVAR))ar) |
|
150 |
1500 |
2850 |
|
300 |
1650 |
3000 |
|
450 |
1800 |
3150 |
|
600 |
1950 |
3300 |
|
750 |
2100 |
3450 |
|
900 |
2250 |
3600 |
|
1050 |
2400 |
3750 |
|
1200 |
2550 |
3900 |
|
1350 |
2700 |
4050 |
Table 4. DG sizes
|
DG SIZES (KW) |
100 |
300 |
800 |
3000 |
5000 |
This simulation contains two scenarios.
-
5.1 Scenario1:
In most papers only converters are considered as harmonic sources and the effect of nonlinear loads are not taken into account. In this scenario we come closer to reality and take the non-linear loads into account. In this scenario 20% of loads on buses are considered non-linear. In this scnario Distributed generations are not armed with harmonic injection system.
It is obvious system is heavy harmonic polluted. In table 5, rms voltages and THD of all buses for the base case are demonstrated. As observed in table 5, THD of some buses are reached to 13%.
Table 5. bus voltage and THD before installation
|
Bus number |
V |
THD |
Bus number |
V |
THD |
|
0 |
1 |
- |
17 |
0.8737 |
12.79 |
|
1 |
0.9952 |
0.35 |
18 |
0.9947 |
0.37 |
|
2 |
0.9718 |
2.27 |
19 |
0.9911 |
0.52 |
|
3 |
0.9577 |
3.67 |
20 |
0.9904 |
0.55 |
|
4 |
0.9436 |
5.15 |
21 |
0.9898 |
0.58 |
|
5 |
0.9103 |
10.68 |
22 |
0.9682 |
2.40 |
|
6 |
0.9069 |
11.03 |
23 |
0.9615 |
2.66 |
|
7 |
0.9020 |
11.20 |
24 |
0.9582 |
2.79 |
|
8 |
0.8957 |
11.53 |
25 |
0.9068 |
11.13 |
|
9 |
0.8898 |
11.83 |
26 |
0.9021 |
11.75 |
|
10 |
0.8889 |
11.86 |
27 |
0.8906 |
12.42 |
|
11 |
0.8874 |
11.92 |
28 |
0.8824 |
12.91 |
|
12 |
0.8813 |
12.26 |
29 |
0.8788 |
13.08 |
|
13 |
0.8791 |
12.43 |
30 |
0.8747 |
13.35 |
|
14 |
0.8777 |
12.52 |
31 |
0.8738 |
13.42 |
|
15 |
0.8763 |
12.60 |
32 |
0.8735 |
13.44 |
|
16 |
0.8743 |
12.75 |
The DPSO algorithm is applied in this system for placement of capacitor and distributed generation for improving voltage profile and reducing loss and THD. In table 6 the locations and sizes of capacitors and Distributed generations after running of the algorithm are given. In table 7, rms voltages and THD of all buses after installation of capacitor and DG are demonstrated.
In this scenario distributed generations don’t use any harmonic controlling system, but as it is observed in table 7, installation of these stuffs result decreasing of THD. The reason is, installation of capacitors and distributed generations don’t have any effect on the amplitude of individual harmonics, just increase the amplitude of fundamental harmonic and result decreasing of THD. In a light harmonic polluted system this method is so useful for improving power quality.
As observed in table 6, the algorithm set two large DGs on the buses 5 and 26 which two six pulse converters as powerful harmonic sources are on these busses. THD of the system is decreased by increasing the fundamental harmonic of buses. As observed in table 7, still THD of some buses are more than the acceptable range of defined by IEEE-519 standard. Increasing of fundamental harmonic can't be continued to any level because one of the main constraints is voltage level, so for reducing THD, any more, by this method (increasing the amplitude of fundamental harmonic) voltage level will exceed the upper boundary (1.05). The algorithm doesn’t let this happen because the weight index of voltage is greater than the weight index of THD. In table 8 and Fig.5 and 6 the results of two cases (before installation and after installation) are compared.
Table 6. the locations of capacitors and DGs with proposed method
Table 8. comparison results
|
Before installation |
After installation |
|
|
P (kw) |
587 |
324 |
|
THD (%) |
13.44 |
6.15 |
|
V (pu) |
1 |
1.03 |
|
V (pu) |
0.87 |
0.99 |
|
Bus |
Capacitor (KVAR) |
DG (KW) |
Bus |
Capacitor (KVAR) |
DG (KW) |
|
0 |
- |
- |
17 |
- |
- |
|
1 |
- |
- |
18 |
- |
- |
|
2 |
1200 |
- |
19 |
- |
- |
|
3 |
- |
- |
20 |
- |
- |
|
4 |
- |
- |
21 |
- |
- |
|
5 |
- |
3000 |
22 |
- |
- |
|
6 |
- |
- |
23 |
- |
- |
|
7 |
- |
- |
24 |
- |
- |
|
8 |
2400 |
- |
25 |
- |
- |
|
9 |
- |
- |
26 |
- |
3000 |
|
10 |
- |
- |
27 |
- |
- |
|
11 |
- |
- |
28 |
2700 |
- |
|
12 |
- |
- |
29 |
- |
- |
|
13 |
2700 |
- |
30 |
- |
- |
|
14 |
- |
- |
31 |
- |
- |
|
15 |
3300 |
- |
32 |
3600 |
- |
|
16 |
- |
- |
Table 7. bus voltage and THD after installation of capacitor and DG
|
Bus number |
V |
THD |
Bus number |
V |
THD THD |
|
0 |
1 |
- |
17 |
1.0132 |
5.4777 |
|
1 |
1.0005 |
0.18973 |
18 |
0.99997 |
0.21106 |
|
2 |
1.0045 |
1.1678 |
19 |
0.99641 |
0.35196 |
|
3 |
1.0103 |
1.8094 |
20 |
0.99571 |
0.3852 |
|
4 |
1.014 |
2.5589 |
21 |
0.99507 |
0.41778 |
|
5 |
1.0211 |
5.2551 |
22 |
1.001 |
1.2834 |
|
6 |
1.0302 |
4.6682 |
23 |
0.99445 |
1.5237 |
|
7 |
1.0387 |
4.5138 |
24 |
0.99119 |
1.6443 |
|
8 |
1.033 |
4.7119 |
25 |
1.0213 |
5.4831 |
|
9 |
1.0278 |
4.8969 |
26 |
1.0218 |
5.7991 |
|
10 |
1.027 |
4.9144 |
27 |
1.0306 |
5.5281 |
|
11 |
1.0256 |
4.9449 |
28 |
1.0232 |
5.8392 |
|
12 |
1.0201 |
5.1552 |
29 |
1.0199 |
5.9478 |
|
13 |
1.0181 |
5.2608 |
30 |
1.0162 |
6.1066 |
|
14 |
1.0168 |
5.3137 |
31 |
1.0154 |
6.1449 |
|
15 |
1.0156 |
5.3593 |
32 |
1.0151 |
6.1586 |
|
16 |
1.0138 |
5.4563 |
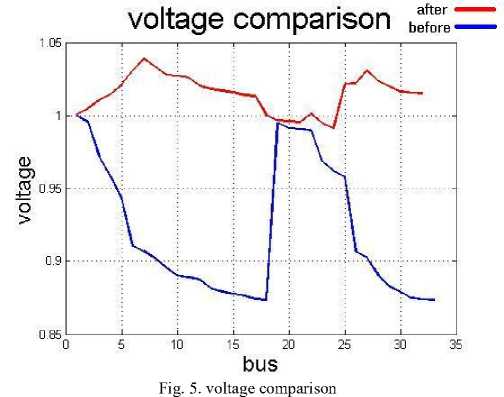
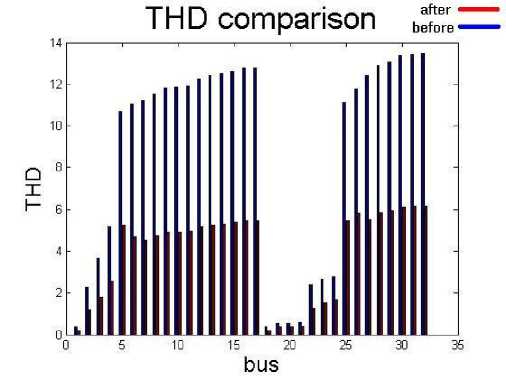
Fig. 6. THD comparison
-
5.2 Scenario 2:
This scenario is like the first scenario but in this scenario distributed generations are armed with harmonic injection system. The rms voltages and THD of all buses for the base case are the same as the first scenario (table5). In table 9 the locations and sizes of capacitors and Distributed generations after running of the algorithm are given. In table 10, rms voltages and THD of all buses after installation of capacitor and DG are demonstrated.
TABLE 9. the locations of capacitors and DGs with proposed method
|
Bus |
Capacitor (KVAR) |
DG (KW) |
Bus |
Capacitor (KVAR) |
DG (KW) |
|
0 |
- |
- |
17 |
- |
- |
|
1 |
- |
- |
18 |
- |
- |
|
2 |
- |
- |
19 |
- |
- |
|
3 |
1200 |
- |
20 |
- |
- |
|
4 |
- |
- |
21 |
- |
- |
|
5 |
- |
3000 |
22 |
- |
- |
|
6 |
1200 |
- |
23 |
300 |
- |
|
7 |
- |
- |
24 |
- |
- |
|
8 |
- |
- |
25 |
- |
- |
|
9 |
- |
- |
26 |
- |
800 |
|
10 |
- |
- |
27 |
- |
- |
|
11 |
- |
- |
28 |
- |
- |
|
12 |
- |
- |
29 |
- |
- |
|
13 |
- |
- |
30 |
- |
- |
|
14 |
2700 |
- |
31 |
1200 |
- |
|
15 |
- |
- |
32 |
- |
- |
|
16 |
- |
- |
Table 10. bus voltage and THD after installation of capacitor and DG
|
Bus number |
V |
THD |
Bus number |
V |
THD THD |
|
0 |
1 |
- |
17 |
0.994749 |
2.264492 |
|
1 |
1.000106 |
0.06176 |
18 |
0.999579 |
0.080894 |
|
2 |
1.002447 |
0.356496 |
19 |
0.996013 |
0.218172 |
|
3 |
1.006762 |
0.514209 |
20 |
0.995311 |
0.251373 |
|
4 |
1.010194 |
0.643469 |
21 |
0.994675 |
0.283997 |
|
5 |
1.018787 |
1.105631 |
22 |
0.999515 |
0.453077 |
|
6 |
1.020674 |
1.355118 |
23 |
0.994321 |
0.663298 |
|
7 |
1.016424 |
1.417705 |
24 |
0.991068 |
0.769031 |
|
8 |
1.011336 |
1.58226 |
25 |
1.022891 |
1.125548 |
|
9 |
1.00667 |
1.737671 |
26 |
1.028765 |
1.151569 |
|
10 |
1.005939 |
1.750403 |
27 |
1.020071 |
1.407597 |
|
11 |
1.004675 |
1.773063 |
28 |
1.013881 |
1.603993 |
|
12 |
1.000132 |
1.95855 |
29 |
1.01112 |
1.666835 |
|
13 |
0.998716 |
2.058011 |
30 |
1.009118 |
1.804092 |
|
14 |
0.997911 |
2.110823 |
31 |
1.008957 |
1.835133 |
|
15 |
0.997167 |
2.154567 |
32 |
1.0087 |
1.847445 |
|
16 |
0.995306 |
2.246032 |
As observed before, in the first scenario, installation of these devices couldn’t reduce THD below the maximum allowable of THD, defined by standard IEEE-519. But in this scenario THD of all buses are less than %5. The controlling systems of distributed generations by harmonic injection not only increase the amplitude of fundamental harmonic of buses but also decrease the amplitude of other harmonics of buses. This result THD of the system decrease below the 5% before the voltage of the system exceeds the 1.05%.
In table 11 and Fig.7 and Fig.8 the results of two cases (before installation and after installation) are compared.
Table 11. comparison results
|
Before installation |
after installation |
|
|
P (kw) |
587 |
301 |
|
THD (%) |
13.44 |
2.26 |
|
V (pu) |
1 |
1.02 |
|
V (pu) |
0.87 |
0.99 |
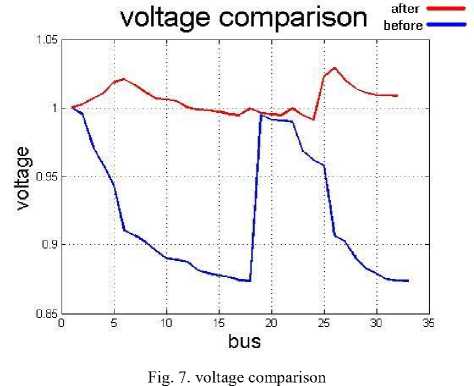
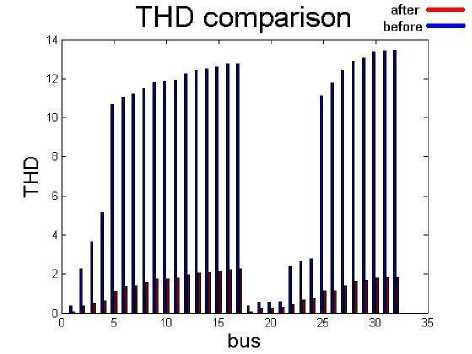
Fig. 8. THD comparison
-
VI. Conclusion
In this paper a modified version of PSO algorithm (DPSO) which is suitable for discrete problems is applied for optimal placing and sizing of capacitor and Power-Electronic Interfaced Distributed Generation in distribution system. In this paper harmonic injection controlling system is used for DGs for improving system's power quality. For evaluating this controlling system and objective function, the IEEE 33-bus test system is modified and employed. This paper contains two scenarios. Simulations show that in a light harmonic pollution, installation of capacitors and DGs can reduce total harmonic distortion (THD) in the system to an acceptable range by increasing the amplitude of fundamental harmonic. But in a heavy pollution they can't reduce harmonic to acceptable range before exceeding the bus voltages over upper bounds of acceptable range defined by standards. In this situation use of such converter for reducing harmonic is so effective. Simulations show the usefulness of these electronic interfaces.
References Optimal Placement and Sizing of Capacitor and Power-Electronic Interfaced Distributed Generation in Heavy Harmonic Polluted Systems
- K. Nara, Y. Hayashi, K. Ikeda, T. Ashizawa," Application of tabu search to optimal placement of distributed generators", IEEE PES Winter Meeting, vol. 2, 2001, pp. 918–923.
- H.L. Willis," Analytical methods and rules of thumb for modeling DG distribution interaction",IEEE PES Summer Meeting, vol. 3, Seattle,WA, Jul 2000.
- N. Acharya, P. Mahat, N. Mithulananthan, "An analytical approach for DG allocation in primary distribution network, Int. J. Electr. Power Energy Syst. 2006, PP.669-678.
- K.H. Kim, Y.J. Lee, S.B. Rhee, S.K. Lee, S.-K. You, "Dispersed generator placement using fuzzy-GA in distribution systems", in: IEEE PES Summer Meeting, vol. 3 July, 2002, pp. 1148–1153.
- Y.A. Katsigiannis, P.S. Georgilakis," Optimal sizing of small isolated hybrid power systems using tabu search", Journal of Optoelectronics and Advanced Materials 10 (5) (2008) 1241–1245.
- J.O. Kim, S.W. Nam, S.K. Park, C. Singh, "Dispersed generation planning using improved Hereford Ranch algorithm", Electr. Power Syst. 1998.
- J. Kennedy, R. Eberhart, "Particle swarm optimization", IEEE . Conf. Neural Networks, Perth, Australia, November 1995, pp. 1942–1948.
- K.E. Parsopoulos, M.N. Vrahatis," On the computation of all minimizers through particle swarm optimization, IEEE Trans. Evolut. Comput,2004,PP.211-224.
- X. Yu, X. Xiong, Y. Wu," A PSO-based approach to optimal capacitor placement with harmonic distortion consideration", Electr. Power Syst. 2004,227-233.
- R.A. Krohling, L.S. Coelho," Co-evolutionary particle swarm optimization using Gaussian distribution for solving constrained optimization problems" IEEE Trans. Syst,2006,PP. 1407–1416.
- U. Baumgartner, C. Magele, W. Renhart, "Pareto optimality and particle swarm optimization", IEEE Trans. 2004,PP.1172–1175.
- ”Modeling and Simulation of the Propagation of Harmonics in Electric Power Network Part I: Concepts, Models and Simulation Techniques,” Task Force on Harmonics Modeling and Simulation, IEEE Trans. on PWRD, Vol. 11, No. 1, Jan. 1996 pp. 452-465.
- H.Patel,W.Agarwal," Control of a Stand-Alone Inverter-Based Distributed Generation Source for Voltage Regulation and Harmonic Compensation",IEEE,trans.on power delivery,2008,pp 1113-1120
- L.F. Ochoa, A. Padilha-Feltrin, G.P. Harrison, "Evaluating distributed generation impacts with a multiobjective index", IEEE Transactions on Power Delivery 2006,pp.1452-1458.
- J. Kennedy and R. C. Eberhart, “A Discrete Binary Version of the Particle Swarm Algorithm Proc. of the conference on Systems, Man, 1997, pp.4104-4109.
- S.K. Goswami, S.K. Basu, A new algorithm for the reconfiguration of distribution feeders for loss minimization, IEEE Trans,1992,1484-1491.
- Abou-Ghazala,A.,"optimal capacitor placement in Distribution Systems Feeding non linear loads",IEEE Bolgona Power Teach conference,2003.
