Optimal sitting and sizing of distributed generation units in an Indian practical distribution system using bird swarm algorithm

Author: Sabarinath.G., T.Gowri Manohar
Journal: International Journal of Intelligent Systems and Applications @ijisa
Article in issue: 10 vol.11, 2019.
Free access
Indian practical rural distribution systems are very long and spread over a wide range of area. The nodes far away from the distribution substation are suffering from low voltage. In India, total distribution system losses are around 20% to 25%. From the past few years, penetration of distributed generation (DG) in to the distribution network/system is increasing expeditiously. DG allocation with appropriate location and size can provide numerous benefits to the distribution companies as well as to the society. In this regard, a new technique called combined sensitivity index (CSI), to find the optimal DG unit location, based on voltage sensitivity and network load magnitude is proposed. To assess the effectiveness of the proposed technique, it is tested on Indian practical 52-bus rural distribution system. The results obtained with the proposed CSI technique is compared with the results obtained with the combined power loss sensitivity (CPLS) technique. Here, the optimal DG unit size is calculated using Bird Swarm Algorithm (BSA). The results show that the proposed CSI technique performs better in minimizing power losses and voltage profile augmentation when compared to existing CPLS technique.
Bird swarm algorithm, Combined power loss sensitivity, Combined sensitivity index, Distributed generation, Distribution system, power loss, voltage deviation
Short address: https://sciup.org/15016630
IDR: 15016630 | DOI: 10.5815/ijisa.2019.10.06
Text of the scientific article Optimal sitting and sizing of distributed generation units in an Indian practical distribution system using bird swarm algorithm
Published Online October 2019 in MECS
Electrical energy distribution systems/networks are generally operated in radial configuration. Due to high resistance (R) / reactance (X) ratio [1], distribution networks cause a poor voltage regulation and considerable amount of power losses. And also as compared to transmission system, the distribution system (DS) is more complex in structure and is having more power loss due to low voltage and high current operating conditions. Major part of the load on DS is inductive in nature [2] and causes more power loss and poor voltage regulation. In the previous literature it is recorded that around 13% [3] of the total power production is lost in the DS as line losses. According to Indian records, distribution losses are around 21% [4]. From the past several years, power systems are transforming from centralized power generating state with power plants connected to the transmission system to the decentralized power generating state [5], with small power generating units directly connected to distribution systems. Minimization of such a high power loss and voltage regulation plays a vital role in distribution system planning, design and expansion [6]. Hence, it is essential to look towards the techniques that minimize the above drawbacks. Distributed / dispersed / decentralized generation [7] placement [1, 2, 4], network feeder re-configuration [3, 8-11], capacitor placement [12, 13] and load balancing [14] are the major techniques used for the power loss minimization and enhancement of system voltage. From the past couple of years, renewable energy based DG placement is being extensively used as it provides many technical, financial and ecological benefits [2]. DG technologies are broadly classified [15] into:
-
■ Renewable energy based DGs comprise of small hydro, solar photovoltaic, wind, biomass, geothermal and so on.
-
■ Fossil fuel/non-renewable energy based DGs comprise internal combustion engine, diesel engine, fuel cells and so on.
Another way of classifying DG technologies [16]:
Type-1 DG: It can produce active power but not reactive power. (Solar PV)
Type-2 DG: It can produce active as well as reactive power. (Synchronous generator)
Type-3 DG: It can produce active power and extracts reactive power. (Induction generator)
Type-4 DG: It can produce only reactive power. (Capacitor)
The remaining sections of this paper are arranged as follows: Section II explains related work. Section III presents problem formulation and system constraints. Section IV and V discuss about optimal power factor and proposed optimal DG location methods. Finally, sections VI and VII explain BSA and experimental results, respectively.
II. Related Work
The placement of DG has a significant effect on distribution network performance. Unsuitable position of DG may cause increased capital investment, decreased performance of system. On the other hand the appropriate placement helps in minimization of network loss and improvement of system voltage profile. There are numerous analytical and optimization approaches utilized in the literature. Majority of analytical and optimization approaches are employed to find the optimal location and size of DG respectively. In [17-19] analytical approaches based on power loss sensitivity and power stability index have been proposed to find the optimal location and sizing of DGs in radial distribution systems. Various scientists and researchers have been introduced several meta-heuristic based optimization algorithms for solving optimal DG allocation problem. In [20] authors were employed three meta-heuristic algorithms including imperialist competitive algorithm (ICA) [20], genetic algorithm (GA) [20] and particle swarm optimization algorithm (PSO) [20], to solve optimal DG allocation problem. In [20] authors reported that PSO performed better than ICA and GA. PSO is used [21] to solve multiobjective problem including maximization of network loss, minimization of initial investment on DG, voltage
stability improvement and greenhouse emissions minimization considering time varying load. Multi objective chaotic symbiotic organisms search algorithm [22], whale optimization algorithm [23], flower pollination algorithm [24], improved multi-objective harmony search algorithm [25], grey wolf optimization algorithm [26] were employed.
-
A. Problem Formulation
The main motive of this problem is to diminish the network power loss. The sum of total network loss is considered as fitness function and is calculated as
nb
P totalloss min £ P loss ( m , m + 1) (1)
m = 1
Where, nb=total number of nodes and Pios s( m , m + 1) =Real loss between mth node and (m+1)th node
B. Power Flow Constraints
The Real power eq. (2) and reactive power eq. (3) flow in each branch and end bus voltage eq. (4) are determined as follows [27]:
22 mm
P m +1 P m + P DG P L , m +1 R m , m +1 X . T_ .7
, , | V m |2
Q m + 1 = Q m + Q dG
- Q L , m + 1
X m , m + 1
x ( p m + Q m )
| V m |2
| V m + 1 |2 = | V m |2 — 2( R m , m + 1 X P m + X m , m + 1 X Q m ) +
( R m , m + 1 + X m
( p m2 + Q m )
| V m |2
C. Voltage Limits
The magnitude of voltages of all buses should lie within the pre-specified range and is represented as
min max
V j - V j - V j
Where V™ = 0.9 p.u and V ™x = 1.05 p.u
IV. Optimal Power Factor
A fast approach [28] is considered to select the optimal power factor (P.F). Consider a simple two bus radial DS in Fig.1. The conceivable least power loss can be accomplished when the P.F of DG (PF DG ) is selected to be equal to that of total system connected load power
factor (PFload). That can be represented by
PF DG = PF load (6)
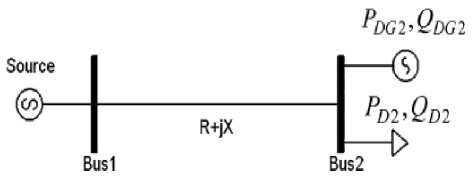
Fig.1. Simple two bus RDS with DG
The connected load P.F of the system (PF load ) is given by
PF load = (7)
-
V P 2+ Q L
The DG P.F is given by
PF DG = /2 DG 2 (8)
VP DG + Q DG
Where
PL and PDG are active power of load and DG.
Q L and Q DG are reactive power of load and DG.
-
V. Optimal DG Placement Methods
These approaches are employed to find out the optimal nodes to place DG units and helps in minimization of search space while executing the optimization program.
-
A. Combined Power Loss Sensitivity (CPLS)
Total network losses depend not only on reactive power injection but also on real power injection. Hence, CPLS [19] is being planned by in view of both real, reactive power injections and the procedure is follows as below:
CPLS corresponding to active/real power injection is given by dKVAioss = dKWioss + 5KVAross dKWi dKWi J dKWi dKVAioss = 2* KWi * R(j) + • 2* KWi * X(j)
5 kw v 2 J v 2
CPLS corresponding to reactive power injection is dKVAioss = 5KWioss + ■ dKVArioss 5KVAr dKVAr J dKVAr
5 KVA ioss _ 2 * KVAr , * R( j ) . 2* KVAr- * X ( j )
5 KVAr i V 2 + j V 2 l )
|
Combined Power Loss Sensitivity |
|
|
d KW ioss 9 KVAr ioss |
|
|
d KWi d KWf |
|
|
= |
ii (13) |
|
d KW ioss 8 KVAr ioss 2 |
|
|
d KVAr i d KVAr i |
|
Where, R(j) and X(j) are resistance and reactance of line ‘ j ’, respectively. KWloss and KVArloss are active and reactive power loss, respectively. KW i and KVAr i are active and reactive power injection, respectively, and V i is voltage magnitude at bus ‘ i ’.
Top most sensitive buses and normalized voltage magnitudes under 1.01 are selected to place DG. The normalized bus voltages are calculated as below
Normaiized , V ( n ) = V ( n )/0.95 (14)
-
B. Combined Sensitivity Index
Proposed CSI [29] is employed to locate the most suitable nodes/buses to incorporate the DG units on an
Indian practical 52-bus RDN. It mainly depends on
-
• Voltage sensitivity
-
• Apparent power of a connected load
CSI (Sb) is mathematically modeled as follows nb
k = 2
for b=2,3,4,……nb
Note: Node ‘1’ is not considered because it is substation node or reference node and nb = maximum number of nodes or buses.
The maximum change in voltage magnitude ( A Vb max ) after the placement of DG unit is given as follows:
max act base
A Vb = max| Vk , b - V k, b | (16)
Here, variables Vk a b ct and Vk b b ase are voltages at node ‘ b’ after and before placement of DG at node ‘k’, respectively.
The KVA magnitude of connected load at bus ‘ k ’ is calculated as follows:
KVA k = V ( PL k )2 + ( QL k )2 (17)
Here, PL and QL are active power magnitude and reactive power magnitude of connected load at node ‘ k’ .
Ranking of buses in each feeder is obtained using eq. (15). The value of Sb is calculated at each bus (except reference bus) by injecting active power of 10%, 20% and 30% of total active power. Bus with highest Sb value should be selected as candidate bus to place DG unit.
-
VI. Bird Swarm Algorithm
In this work, bird swarm algorithm (BSA) [30] is employed to determine the optimal DG capacity/size. BSA is a new optimization technique developed by authors in 2015. BSA is developed from the intelligence observed from the birds in swarm during communication and social behavior. In general, most of the birds exhibit three kinds of behaviors like foraging, vigilance and flight behaviors.
-
A. Foraging Behavior
All birds in the swarm quests for food based on its previous knowledge and swarms experience. These actions can be mathematically expressed as below:
the swarm. s is a small number to eliminate zerodivision error and mean n represents nth bird average position.
-
C. Flight Behavior
While searching food the birds move from one location to a different location due to predation threat or any other reason and once again at the arrived site they would forage for food. Some of the birds in the swarm called producers would quest for food patches while the rest of the swarm called scroungers try to forage the food patches identified by the producers. The mathematical representation of producer and scrounger behavior may be as follows:
x m + n = x m , n + randn (0,1) x X‘ m , „ (22)
x m + n = x m , n + ( x q , n - X m , n ) x FL x rand (0,1) (23)
Here, randn(0,1) represents Gaussian distributed random value with 0 and 1, respectively as mean and standard deviation and FL represents the following factor. The flow chart of the proposed BSA is shown in Fig. 2.
x^ + 1 = Xrn ,' (Pm и- Xm J x C x rand(0,1) + m , n m , n m , n m , n
(g n - X m , n ) X S X rand (0,1)
In the above eq. (18), rand(0,1) denotes a randomly generated number between (0,1) and n [1,2,….,D]. S and C are respectively named as social accelerated and cognitive accelerated coefficients and both are positive numbers. Pm,n is the previous best position of mth bird and gn is the previous best position of a swarm.
B. Vigilance Behavior
Every bird in the swarm tries and competes with other birds in the swarm to get a position in the middle of the swarm to safeguard themselves from the predators. Hence, each bird in the swarm would not move continuously towards the center. The mathematical representation of these motions is as follows:
x‘m+1 = Xt, „ + A1(mean„ - Xt, „) x rand (0,1) + m,n m,n nm
A2(Pqn - xm,n) X rand(-1,1)
( PFit™
A1 = a1 x exp I--i-tm— x N I
I sumFit + s I
A 2 = a 2 x exp
PFit m - PFit q ^^ | PFit q - PFit m I +s
N x PFit )
q_ sumFit + s
I
Where q (q * m) is a randomly generated positive number between 1 and N . a1 and a2 are positive numbers in [0 2]. PFitm represents the mth bird’s best fitness value. sumFit denotes sum of the best fitness of all the birds in
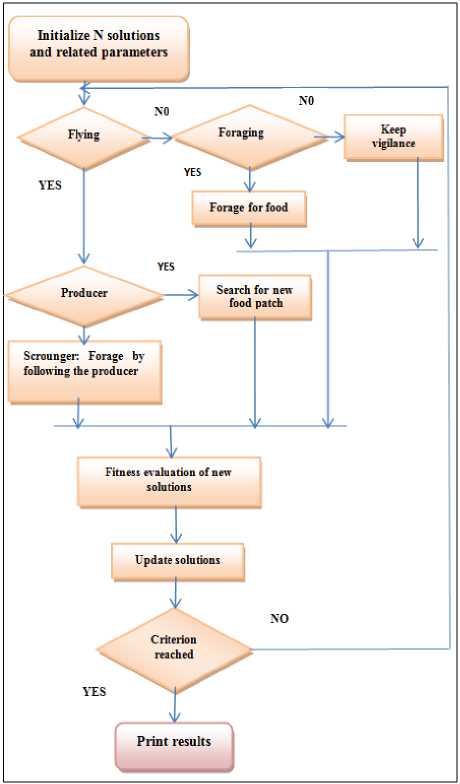
Fig.2. Flowchart of BSA
-
D. Implementation of BSA
The complete algorithm of the proposed method is as follows:
STEP: 1 Load line and load data of an Indian 52-bus distribution system to run power flow program.
STEP: 2 Identify the most suitable node/bus in each feeder using the CPLS and CSI approaches.
STEP: 3 Initialize population and other BSA parameters.
STEP: 4 Generate birds (DG sizes) using eq. (24)
DGSiZe = ( DG max - DG mJ* rand () + D, . (24)
STEP: 5 Calculate the power loss of 52-bus distribution system for generated DG sizes
STEP: 6 Identify DG size with minimum power loss
STEP: 7 Update DG sizes using eq. (18) - eq. (23)
STEP: 8 Calculate power losses for updated DG sizes
STEP: 9 Update current best DG size if the power loss obtained in step 8 is less than power loss obtained in step 5 otherwise moves to step 7.
STEP: 10 Stop if the criterion is satisfied
-
VII. Experimental Results
The Indian practical radial distribution system portrayed in [31] is considered for evaluation of proposed technique. The line and load information [32] about this considered test system is presented in appendix. This test system consists of 3 main feeders, 52 buses and 51 branches feeding a total network load of (4184+j2025) KVA. The power factor of connected load of this test system is 0.9 lagging. The base KV and KVA for this considered test system are considered as 11 and 1000, respectively. The maximum and minimum bus voltage magnitude limits for the given test system are 1.05p.u and 0.9 p.u., respectively. For Indian 52-bus practical distribution system without integration of DG unit, total active and reactive losses are (887.19+j381.69) KVA. Total active and reactive power injection from the substation is (5071.19+j2406.69) KVA. The vital objective of this work is minimization of network loss and total load voltage deviation. The maximum number of DG units installed for this system is considered to be equal to number of feeders i.e. 3. The simulation programed of this proposed BSA is developed in MATLAB R2014a environment. During simulation, the following BSA parameters are considered: number of birds/population, N=30; maximum iterations=50; bird’s flight behavior frequency, FQ=10; constants, a1=a2=1; C=S=1.5.
Table 1. Specifications of Indian practical 52-bus RDN
|
Base KVA |
Base KV |
Connected load |
Power loss |
||
|
KW |
KVAr |
KW |
KVAr |
||
|
1000 |
11 |
4184 |
2025 |
887.19 |
381.69 |
While simulating the given test system, two dissimilar scenarios and three cases in each scenario are considered.
-
• Scenario-1: DG locations are determined with CPLS analysis.
-
• Scenario-2: DG locations are determined with CSI analysis.
In each scenario the following three case studies are analyzed.
-
V Case-1: Three DG units injecting active power only i.e. operating at Unity power factor, for instance, fuel cells, solar photovoltaic.
-
V Case-2: Three DG units injecting both active and reactive power and operating at 0.95 power factor, for instance, synchronous generator.
-
V Case-3: Three DG units injecting both active and reactive power and operating at 0.9 power factor (Optimal power factor).
-
A. Scenario-1
In scenario-1, bus locations in each feeder to incorporate DG units are determined using CPLS analysis. CPLS values and normalized voltages of all buses are determined using eq. (13), (14) and are graphically presented in Fig. 3 and Fig. 4, respectively. Now, the buses/nodes are arranged in descending order based on CPLS value. Top 5 sensitive nodes with its normalized voltages less than 1.01 are recorded in Table 2. The top ranked nodes i.e. 18, 23 and 44 are picked first for DG unit placement.
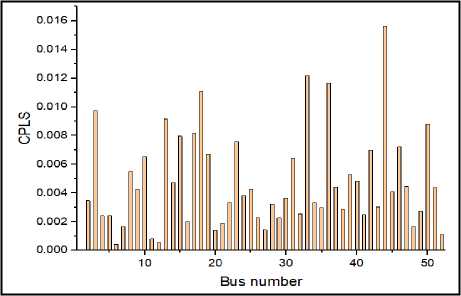
Fig.3. CPLS profile of test system
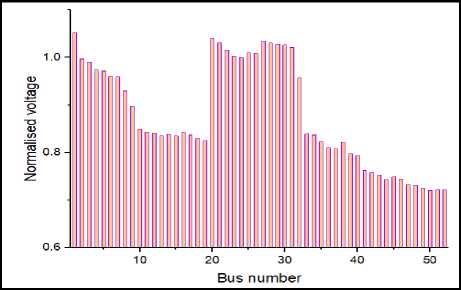
Fig.4. Normalized voltage profile of test system
Table 2. Priority list of sensitive nodes
|
Rank of bus |
Bus number |
||
|
Feeder-1 |
Feeder-2 |
Feeder-3 |
|
|
1 |
18 |
23 |
44 |
|
2 |
3 |
24 |
33 |
|
3 |
13 |
26 |
36 |
|
4 |
17 |
-- |
50 |
|
5 |
15 |
-- |
46 |
Case-1: In case-1, three type-1 DG units operating at unity P.F are installed at nodes 18, 23 and 44. The results achieved in this case are provided in Table 3. After placing three DG units of capacities 752.42KVA (18), 457.53KVA (23) and 1054.12KVA (44), active power losses (ΣKW loss) are reduced from 887.19 KW to 310.62KW and reactive power losses (ΣKVAr loss) from 381.69KVAr to 133.81KVAr. Similarly, the active and reactive power supplied by substation is reduced from (5071.19+j2406.69) KVA to (2230.92+j2158.81) KVA.
Table 3. Optimization results of scenario-1
|
particulars |
Base case |
Case-1 |
Case-2 |
Case-3 |
|
ΣKW loss |
887.194 |
310.62 |
219.67 |
211.31 |
|
ΣKVAr loss |
381.69 |
133.81 |
94.51 |
90.91 |
|
DG location and size (KVA) |
----- |
752.42 |
878.54 |
875.74 |
|
457.53 |
452.29 |
466.62 |
||
|
1054.1 |
1147.8 |
1162.25 |
||
|
|Vmin| (p.u) |
0.6844 |
0.87093 |
0.90033 |
0.90313 |
|
Σ|Vdevi| |
8.5796 |
3.2649 |
2.2850 |
2.2278 |
Fig. 5 shows the voltage profile of test system. From Fig. 5 it is very clear that there is a considerable improvement in voltage profile from base case to case-1. In this case the minimum voltage level (|Vmin|) is improved from 0.6844p.u to 0.87093p.u and total load voltage deviation (Σ|Vdevi|) is reduced from 8.5796 to 3.2649.
Case-2: In case-2, three type-2 DG units injecting both active and reactive power at 0.95 P.F are placed at nodes 18, 23 and 24. The optimal results obtained with this case are recorded in Table 3. By installing three DG units with its optimal capacities of 878.54KVA (18), 452.29KVA (23) and 1147.85KVA (44), the active losses are minimized to 219.67KW and reactive losses to 94.51KVAr. In this case the power injected from substation is minimized from (5071.19+j2406.69) KVA to (2075.66+j1354.39) KVA. The voltage profile of this case is portrayed in Fig. 5. From Fig. 5 it is clear that the voltage profile is significantly improved when compared to above two cases i.e. base case and case-1. In this case, |Vmin| is improved from 0.6844p.u to 0.9003p.u and Σ|Vdevi| is reduced from 8.5796 to 2.285. From Fig. 2, it is also noticed that all nodes of test system are within the acceptable voltage limit i.e. in between 0.9p.u and 1.05p.u.
Case-3: Three type-2 DG units injecting both active and reactive power at 0.9 P.F (optimal P.F) are installed at nodes 18, 23 and 24 of Indian practical 52-bus urban distribution system. The obtained optimal numerical results are inserted in Table 3. The optimal size of DG units at nodes 18, 23 and 24 are found to be 875.74KVA (18), 466.62KVA (23) and 1162.25KVA (44), respectively. Case-3 of scenario-1 yields reduced active and reactive power loss of 211.KW and 90.91KVAr, respectively. The value of |Vmin| is improved from 0.6844p.u to 0.90313p.u. Total load voltage deviation is reduced to 8.5796 to 2.2278. From Fig. 5 it is clear that as compared to all cases, case-3 exhibits better voltage profile. This is because of increased reactive power injection from the DG units.
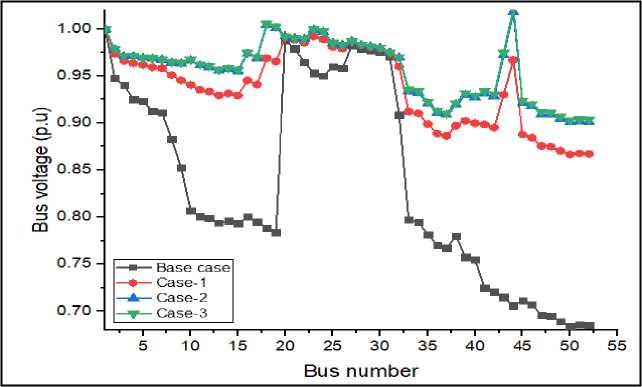
Fig.5. Voltage profile of test system with scenario-1
-
B. Scenario-2
In scenario-2, the locations of DG units are first finalized using the proposed CSI. The CSI values for DG power injection of 10%, 20% and 30% of total active power load are graphically presented in Fig. 6. The top 5 ranked buses in each feeder concerning CSI are recorded in Table 4. From Table 4 nodes 19, 24 and 50 are selected to incorporate DG units in this scenario.
total load voltage deviation (Σ|Vdevi|) is reduced from 8.5796 to 3.096.
Table 4. Ranking of nodes using combined sensitivity index
|
Rank of bus |
Feeder-1 |
Feeder-2 |
Feeder-3 |
||||||
|
DG power injection (% of TRPL) |
DG power injection (% of TRPL) |
DG power injection (% of TRPL) |
|||||||
|
10 |
20 |
30 |
10 |
20 |
30 |
10 |
20 |
30 |
|
|
1 |
19 |
19 |
19 |
24 |
24 |
24 |
50 |
50 |
50 |
|
2 |
18 |
18 |
18 |
26 |
26 |
26 |
52 |
52 |
52 |
|
3 |
17 |
17 |
17 |
23 |
23 |
23 |
51 |
51 |
51 |
|
4 |
15 |
15 |
15 |
31 |
31 |
31 |
49 |
49 |
49 |
|
5 |
14 |
14 |
14 |
25 |
25 |
25 |
48 |
44 |
48 |
Case-1: In case-1 of scenario-2, three type-1 DG units injecting active power at unity P.F are installed at nodes 19, 24 and 50. The optimized numerical results attained in this case are provided in Table 5. After placing three DG units of capacities 694.01KVA (19), 367.41KVA (24) and 1060.59KVA (50), active power losses (ΣKW loss) are reduced from 887.19 KW to 293.78KW and reactive power losses (ΣKVAr loss) from 381.69KVAr to 126.39KVAr. Similarly, the active and reactive power supplied by substation is reduced from (5071.19+j2406.69) KVA to (2355.78+j2151.39) KVA. Fig. 7 shows the voltage profile of test system with scenario-2. From Fig. 7, it is very clear that there is a considerable improvement in voltage profile from base case to case-1. In this case the minimum voltage level (|Vmin|) is improved from 0.6844p.u to 0.89254p.u and
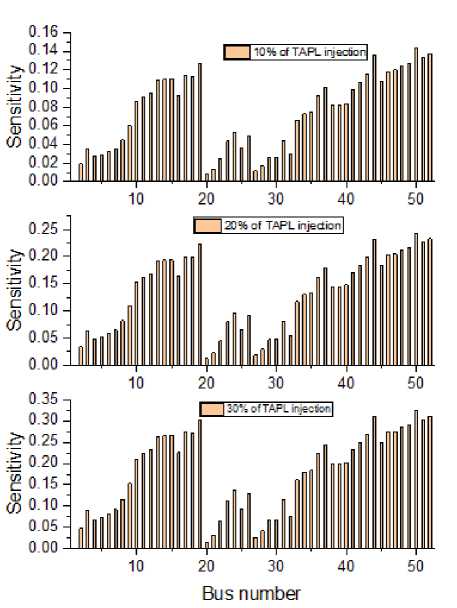
Fig.6. Combined sensitivity index of test system
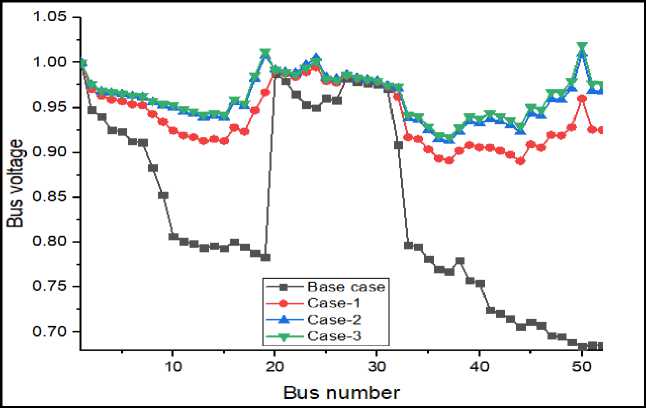
Fig.7. Voltage profile of test system with scenario-2
Case-2: In case-2 of scenario-2, three type-2 DG units injecting both active and reactive powers at 0.95 P.F are installed at nodes 19, 24 and 50. The optimal numerical results obtained with this case are recorded in Table 5. By installing three DG units with its optimal capacities of 771.36KVA (19), 388.73KVA (24) and 1151.2KVA (50), the active losses are minimized to 202.55KW and reactive losses to 87.14KVAr. In this case, the power injected from substation is minimized from (5071.19+j2406.69) KVA to (2190.83+j1390.56) KVA.
The voltage profile of this case is portrayed in Fig.7. From Fig.7 it is clear that the voltage profile is significantly improved when compared to above two cases i.e. base case and case-1. In this case, |Vmin| is improved from 0.6844p.u to 0.91225p.u and Σ|Vdevi| is reduced from 8.5796 to 2.1536. From Fig.7, it is also noticed that all nodes of test system are within the acceptable voltage limit i.e. in between 0.9p.u and 1.05p.u.
Table 5. Optimization results of scenario-2
|
Particulars |
Base case |
Case-1 |
Case-2 |
Case-3 |
|
ΣKW loss |
887.194 |
293.78 |
202.55 |
194.04 |
|
ΣKVAr loss |
381.69 |
126.39 |
87.14 |
83.48 |
|
DG location and size (KVA) |
----- |
694.01 |
771.36 |
781.07 |
|
367.41 |
388.73 |
402.91 |
||
|
1060.59 |
1151.20 |
1180.79 |
||
|
|Vmin| (p.u) |
0.6844 |
0.89254 |
0.91225 |
0.91550 |
|
Σ|Vdevi| |
8.5796 |
3.0960 |
2.1536 |
2.0391 |
Case-3: Three type-2 DG units injecting both active and reactive powers at 0.9 P.F (optimal P.F) are installed at nodes 19, 24 and 55 of Indian practical 52-bus rural distribution system. The obtained optimal numerical results are inserted in Table 5. The optimal size of DG units at nodes 19, 24 and 50 are found to be 781.07KVA (19), 402.91KVA (24) and 1180.79KVA (50), respectively. Case-3 of scenario-2 yields reduced active and reactive power loss of 194.04KW and 83.48KVAr, respectively. The value of |Vmin| is improved from 0.6844p.u to 0.9155p.u. Total load voltage deviation is reduced to 8.5796 to 2.0391. From Fig. 7 it is clear that as compared to all cases of scenario-2, case-3 exhibits better voltage profile. This is because of increased reactive power injection from the DG units.
Fig. 8 shows the convergence curves of a proposed BSA for solving the optimal DG allocation problem. From Fig. 8, it is clear that BSA has good convergence speed.
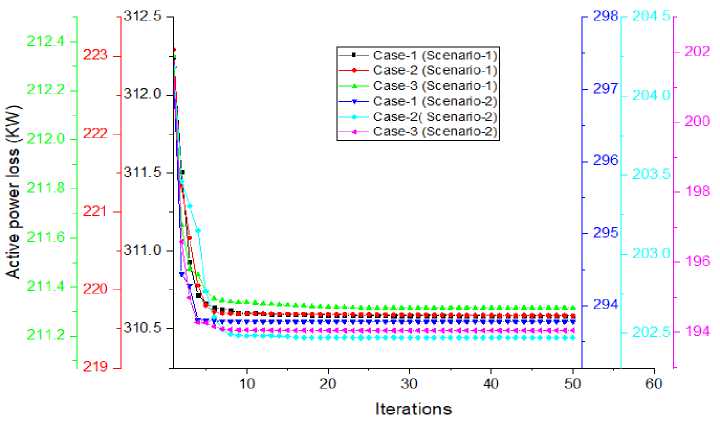
Fig.8. Convergence curves of proposed BSA
-
VIII. Conclusions
In this work, an optimal DG allocation problem on Indian practical 52-bus radial distribution system was solved. Here, CPLS and CSI were used to determine the DG locations. A new algorithm called bird swarm algorithm (BSA) was used to calculate the optimal DG size. The results obtained with CPLS and CSI methods are compared. From the results it is observed/concluded that, the least values of power loss and total voltage deviation are achieved with minimum DG size in scenario-2. The results achieved with scenario-2 are as follows: Total active power loss reduction of 66.88%, 77.16% and 78.12% were achieved in Case 1, 2 and 3, respectively. Total voltage deviation reduction of 63.91%, 74.89% and 76.23% were achieve with case 1, 2 and 3, respectively.
Appendix
Specifications of an Indian practical 52-bus RDS
|
S. No. |
From bus |
To bus |
R (p.u) |
X (p.u) |
P (KW) |
Q (KVAr) |
|
1 |
1 |
2 |
0.0258 |
0.01110 |
81 |
39 |
|
2 |
2 |
3 |
0.0430 |
0.01850 |
135 |
65 |
|
3 |
2 |
4 |
0.0129 |
0.00555 |
108 |
52 |
|
4 |
4 |
5 |
0.0129 |
0.00555 |
108 |
52 |
|
5 |
4 |
6 |
0.0086 |
0.00370 |
27 |
13 |
|
6 |
6 |
7 |
0.0172 |
0.00740 |
54 |
26 |
|
7 |
6 |
8 |
0.0215 |
0.00925 |
135 |
65 |
|
8 |
8 |
9 |
0.0258 |
0.01110 |
81 |
39 |
|
9 |
9 |
10 |
0.0430 |
0.01850 |
67 |
32 |
|
10 |
10 |
11 |
0.0129 |
0.00555 |
27 |
13 |
|
11 |
11 |
12 |
0.0086 |
0.00370 |
27 |
13 |
|
12 |
11 |
13 |
0.0430 |
0.01850 |
108 |
52 |
|
13 |
12 |
14 |
0.0301 |
0.01295 |
54 |
26 |
|
14 |
12 |
15 |
0.0344 |
0.01480 |
94 |
45 |
|
15 |
10 |
16 |
0.0129 |
0.00555 |
67 |
33 |
|
16 |
16 |
17 |
0.0516 |
0.02220 |
67 |
33 |
|
17 |
16 |
18 |
0.0430 |
0.01850 |
108 |
52 |
|
18 |
18 |
19 |
0.0344 |
0.01480 |
81 |
39 |
|
19 |
1 |
20 |
0.0086 |
0.00370 |
108 |
52 |
|
20 |
20 |
21 |
0.0129 |
0.00555 |
94 |
46 |
|
21 |
21 |
22 |
0.0258 |
0.01110 |
81 |
39 |
|
22 |
22 |
23 |
0.0430 |
0.01850 |
108 |
52 |
|
23 |
23 |
24 |
0.0215 |
0.00925 |
108 |
52 |
|
24 |
22 |
25 |
0.0258 |
0.01110 |
102 |
50 |
|
25 |
25 |
26 |
0.0344 |
0.01480 |
41 |
20 |
|
26 |
20 |
27 |
0.0086 |
0.00370 |
108 |
52 |
|
27 |
27 |
28 |
0.0129 |
0.00555 |
162 |
79 |
|
28 |
28 |
29 |
0.0215 |
0.00925 |
68 |
33 |
|
29 |
27 |
30 |
0.0344 |
0.01480 |
68 |
33 |
|
30 |
30 |
31 |
0.0430 |
0.01850 |
95 |
46 |
|
31 |
1 |
32 |
0.0344 |
0.01480 |
41 |
20 |
|
32 |
32 |
33 |
0.0430 |
0.01850 |
121 |
59 |
|
33 |
33 |
34 |
0.0344 |
0.01480 |
41 |
20 |
|
34 |
33 |
35 |
0.0301 |
0.01295 |
41 |
20 |
|
35 |
35 |
36 |
0.0344 |
0.01480 |
135 |
66 |
|
36 |
36 |
37 |
0.0215 |
0.00925 |
81 |
40 |
|
37 |
35 |
38 |
0.0172 |
0.00740 |
68 |
33 |
|
38 |
33 |
39 |
0.0215 |
0.00925 |
95 |
46 |
|
39 |
39 |
40 |
0.0172 |
0.00740 |
108 |
52 |
|
40 |
39 |
41 |
0.0215 |
0.00925 |
41 |
20 |
|
41 |
41 |
42 |
0.0258 |
0.01110 |
95 |
46 |
|
42 |
41 |
43 |
0.0387 |
0.01665 |
27 |
13 |
|
43 |
43 |
44 |
0.0430 |
0.01850 |
122 |
59 |
|
44 |
41 |
45 |
0.0129 |
0.00555 |
108 |
52 |
|
45 |
45 |
46 |
0.0301 |
0.01295 |
81 |
39 |
|
46 |
45 |
47 |
0.0215 |
0.00925 |
68 |
33 |
|
47 |
47 |
48 |
0.0129 |
0.00555 |
41 |
20 |
|
48 |
47 |
49 |
0.0129 |
0.00555 |
68 |
33 |
|
49 |
49 |
50 |
0.0344 |
0.01480 |
81 |
39 |
|
50 |
49 |
51 |
0.0129 |
0.00555 |
108 |
52 |
|
51 |
51 |
52 |
0.0086 |
0.00370 |
41 |
20 |
References Optimal sitting and sizing of distributed generation units in an Indian practical distribution system using bird swarm algorithm
- D. B. Prakash and C. Lakshminarayana, “Multiple DG placements in radial distribution system for multi objectives using Whale Optimization Algorithm,” Alexandria Eng. J., vol. 57, no. 4, pp. 2797–2806, 2018.
- R. Viral and D. K. Khatod, “Optimal planning of distributed generation systems in distribution system: A review,” Renew. Sustain. Energy Rev., vol. 16, no. 7, pp. 5146–5165, 2012.
- Y. H. Song, G.S.Wang, A.T.Johns, and P.Y.Wang, “Distribution network reconfiguration for loss reduction using fuzzy controlled evolutionary programming,” no. 1, pp. 345–350, 1997.
- S. Nawaz and A. Tandon, “Power loss minimisation of rural feeder of Jaipur city by renewable-based DG technologies,” Aust. J. Electr. Electron. Eng., vol. 3, no. 1, pp. 1–8, 2018.
- F. Blaabjerg, Y. Yang, D. Yang, and X. Wang, “Distributed Power-Generation Systems and Protection,” Proc. IEEE, vol. 105, no. 7, pp. 1311–1331, 2017.
- K. Seethalekshmi, U. C. Trivedi, and M. Ramamoorty, “Technical Loss Evaluation in Distribution Feeders,” no. 760, pp. 673–675, 2002.
- M. Geidl, “Protection of Power Systems with Distributed Generation : State of the Art,” Technology, Vol.5, no. 2, pp. 1-33, 2005.
- C. F. Chang, “Reconfiguration and capacitor placement for loss reduction of distribution systems by ant colony search algorithm,” IEEE Trans. Power Syst., vol. 23, no. 4, pp. 1747–1755, 2008.
- E. O. Santos and J. S. B. Martins, “Distribution Power Network Reconfiguration in the Smart Grid.” In proceedings of the International seminar on polacies, Incentives, Technology and Regulation of smart grids,pp.1-13, 2017.
- M. T. M. Emmerich, K. Yang, J. Wang, T. Bäck, and R. Li, “Power Distribution Network Reconfiguration by Evolutionary Integer Programming,” Springer International journal, pp. 11–23, 2014.
- M. S. Mazliham, B. Abu Bakar, M. J. Tahir, and M. Alam, “Distribution System Power Losses Minimization Using Network Reconfiguration,” Int. J. Integr. Eng., vol. 10, no. 7, pp. 1–9, 2018.
- K. R. Devabalaji, A. M. Imran, T. Yuvaraj, and K. Ravi, “Power Loss Minimization in Radial Distribution System,”In proceedings of the 2015 Int. Conf. Alt. Energy in developing countries and emerging economies, pp.917-923, 2015.
- D. B. Prakash and C. Lakshminarayana, “Optimal siting of capacitors in radial distribution network using Whale Optimization Algorithm,” Alexandria Eng. J., vol. 56, no. 4, pp. 499–509, 2017.
- P. Taylor, P. V Prasad, S. Sivanagaraju, and N. Sreenivasulu, “Electric Power Components and Systems Network Reconfiguration for Load Balancing in Radial Distribution Systems Using Genetic Algorithm Network Reconfiguration for Load Balancing in Radial Distribution Systems Using Genetic Algorithm,” Electric power comp. and sys, pp. 37–41,2013.
- G. Sabarinath, T.G,Manohar,“Optimal Sitting And Sizing Of Renewable Energy Resources For Power Loss Reduction In Radial Distribution Systems Using Whale Optimization Algorithm,” 2018 Int. Conf. Emerg. Trends Innov. Eng. Technol. Res., pp. 1–5, 2018.
- S. Kansal, V. Kumar, and B. Tyagi, “Electrical Power and Energy Systems Hybrid approach for optimal placement of multiple DGs of multiple types in distribution networks,” Int. J. Electr. POWER ENERGY Syst., vol. 75, pp. 226–235, 2016.
- T. Rambabu, P. Venkata Prasad, “Optimal placement and sizing of DG based on power stability index in radial distribution system,” Proceedings in 2014 Int. Conf. Smart Electric Grid (ISEG), pp. 1–5, 2014.
- Rajkumar Viral and D.K. Khatod, “An analytical approach for sizing and siting of DGs in balanced radial distribution networks for loss minimization, ”Electr. Power Energy Syst, Vol. 67, pp.191–201, 2015.
- V.V.S.N. Murty and Ashwani Kumar, “Optimal placement of DG in radial distribution systems based on new voltage stability index under load growth, ”Electr. Power Energy Syst., Vol.69, pp. 246–256, 2015.
- H. Hassanzadehfard and A. Jalilian, “A novel objective function for optimal DG allocation in distribution systems using meta- heuristic algorithms,” Int. J. Green Energy, vol. 13, no. 15, pp. 1624–1634, 2016.
- H. Hassanzadehfard and A. Jalilian, “Optimal sizing and siting of renewable energy resources in distribution systems considering time varying electrical / heating / cooling loads using PSO algorithm,” Int. J. Green Energy, vol. 3, no. 2, pp. 1–16, 2018.
- S. Saha, “A novel multiobjective chaotic symbiotic organisms search algorithm to solve optimal DG allocation problem in radial distribution system,” Applied Soft Computing, pp. 1–25, 2019.
- M. N. Morshidi, I. Musirin, S. R. A. Rahim, M. R. Adzman, and M. H. Hussain, “Whale optimization algorithm based technique for distributed generation installation in distribution system,” Bull. Electr. Eng. Informatics, vol. 7, no. 3, pp. 442–449, 2018.
- E. S. Oda, A. A. Abdelsalam, M. N. Abdel-Wahab, and M. M. El-Saadawi, “Distributed generations planning using flower pollination algorithm for enhancing distribution system voltage stability,” Ain Shams Eng. J., vol. 8, no. 4, pp. 593–603, 2017.
- W. Sheng, K. Liu, Y. Li, Y. Liu, and X. Meng, “Improved Multiobjective Harmony Search Algorithm with Application to Placement and Sizing of Distributed Generation,” Mathematicl problems in engineering, vol. 2014,pp.1-8, 2014.
- U. Sultana, A. B. Khairuddin, A. S. Mokhtar, N. Zareen, and B. Sultana, “Grey wolf optimizer based placement and sizing of multiple distributed generation in the distribution system,” Energy, vol. 111, pp. 525–536, 2016.
- M. H. Haque, “Efficient load flow method for distribution systems with radial or mesh configuration,” IEE Proc. - Gener. Transm. Distrib., vol. 143, no. 1, pp.1- 33, 2002.
- D. Q. Hung, N. Mithulananthan, and R. C. Bansal, “Analytical expressions for DG allocation in primary distribution networks,” IEEE Trans. Energy Convers., vol. 25, no. 3, pp. 814–820, 2010.
- S. R. Gampa and D. Das, “Electrical Power and Energy Systems Optimum placement and sizing of DGs considering average hourly variations of load,” Int. J. Electr. Power Energy Syst., vol. 66, pp. 25–40, 2015.
- X. B. Meng, X. Z. Gao, L. Lu, Y. Liu, and H. Zhang, “A new bio-inspired optimisation algorithm: Bird Swarm Algorithm,” J. Exp. Theor. Artif. Intell., vol. 28, no. 4, pp. 673–687, 2016.
- P.Kayal, S. Chanda, C.K.Chanda “Determination of Voltage Stabilityin Distribution Network Using ANN Technique,” Int. Jour. on Elec. Eng. and Inf., Vol.4,no.2,pp.347-360, 2015.
- D. Thukaram, S. Member, H. P. Khincha, S. Member, H. P. Vijaynarasimha, and S. Member, “Artificial Neural Network and Support Vector Machine Approach for Locating Faults in Radial Distribution Systems,” IEEE Trans. on power Del., vol. 20, no. 2, pp. 710–721, 2005.
