Optimization of Fault Learning in Medical Devices

Author: V. Kakulapati
Journal: International Journal of Intelligent Systems and Applications @ijisa
Article in issue: 6 vol.14, 2022.
Free access
A relatively effective training system and advancements in data science demonstrate their evolutionary algorithm power to discover defects and abnormalities in the specified learning process. This work employs a fast and precise fault modelling environment to enhance genetic input implantable devices defect diagnostics. We offer a genetic data technique that incorporates phylogenetic analysis operations and faulty efficiency analysis. This study contributes to fault training in three different ways: 1) it exposes communicative training categories of information formulating adhesion, 2) it introduces a hierarchical system dissemination processing principles to design the fault aggregative, and 3) it indicates forecasting the genetic data sector that corresponds to complicated fault training. The proposed algorithm analyses methods that combine automatically generated fault detection development with massive data testing by non-repetitive fault instances. Analyzing data from validation challenges, infrastructure blowouts, and failure uncertainty make our algorithm more productive in the health sector.
Physician, Predicting, Genetic Algorithm, Machine Learning, Fault, Diagnosis, Knowledge, Discovery, Relative
Short address: https://sciup.org/15018977
IDR: 15018977 | DOI: 10.5815/ijisa.2022.06.04
Text of the scientific article Optimization of Fault Learning in Medical Devices
Published Online on December 8, 2022 by MECS Press
There is a contradiction between the desired progress of technology and the time required to provide a medically practically identical system. A prolonged assessment and incorporation process is typically needed to provide the requisite reliability. The issue is that flaws are frequently discovered at this late stage of construction. The earliest explicit artifacts in industrialization approaches are generally at the stage of learning, whereas the configuration and construction stage depend on unstructured papers. Faults are frequently discovered during the creation of these structured artifacts. There is a contradiction between technology's desired progress and the time required to provide a medically identical system. A prolonged assessment and incorporation process is typically needed to provide the requisite reliability [1]. The issue is that flaws are frequently discovered at this late stage of construction. The earliest explicit artifacts in industrialization approaches are generally at the stage of learning, whereas the configuration and construction stage depend on unstructured papers. Defects are frequently discovered during the creation of these technical artifacts.
The detection method in manufacturing methodology is a difficult task requiring meaningful and quick decisionmaking methods in stochastic geometry, densely connected data, substantial resources, and complicated interplay among indications and problems. Defect recognition is discovering which problem happened, specifically, the root(s) of the out-of-control behavior. Processing fault-tolerant entails assessing the farm's present state based on the sensor inputs and efficient processing.
Prevalence of numerous illnesses. Healthcare inequities are emerging across areas. Significantly raise hospital expenses. These are among the difficulties confronting the contemporary world. It is critical to offer healthcare facilities adapted to every patient, ensure appropriate care coordination, and establish efficient economic patient care to address problems and preserve and promote Wellness. Healthcare technological improvements merely will not be enough to achieve these objectives. It is necessary to integrate sophisticated technology and social facilities methods, digitize data on people’s emotions and the status of items, and innovate using AI, data science, and automation systems.
A defect in therapeutic diagnostics might result in dangerous scenarios. If only one device is employed, and it fails to noise and vibration, the methods are complicated, and risks may develop. Consequently, N-modular robustness or N-version engineering is employed in conjunction with the registration approach to disguise the defects in the defective context. In survival devices, numerous subsystems with a member are utilized in various design patterns [2].
Several computational techniques have evolved in recent times, making it easier to solve the earlier complicated scalability issue. Among these methods are genetic algorithms, heuristic searches, and metaheuristics. An algorithm is proposed, and particle swarm optimization (PSO) methods have emerged as promising ways to assess objective functions. Because of their adaptability and capability to optimize in complicated mathematical domains, these methods are prominent among researchers as modeling methods. The fundamental challenge in executing GA and PSO approaches is identifying a suitable fitness function. Both techniques are inspirational and have been demonstrated to be excellent answers to efficiency challenges. Despite their well-known usefulness, the associated algorithms are not a cure-all. For some issues, the GA technique outperforms the PSO methodology, whereas, for others, the last method outperforms the former [3-6]. Throughout the examination of evolutionary algorithms, the observed predictive methods, such as PSO, have enormous promise and, in certain circumstances, superiority. The second prevalent technique, the GA, is well-established, versatile, simple to program, and less expensive. Hence it is widely utilized and provides an alternate way for information-processing methodologies. Due to the benefits described above, we decided to employ the GA in the ongoing investigation.
IoT devices [7] overcome miscommunications among patients and clinicians. Clinicians use information from sensors to monitor their individuals' medical conditions. The patients can sign up for a telehealth assessment via online broadcasts provided via online healthcare monitoring. As a consequence, clinicians use data to treat serious medical problems. Medical technology linked with IoT will assist clinicians in diagnosing issues. For instance, if a victim has symptoms of increased blood pressure in a distant area, an alarm is sent to a physician, and an urgent response is dispatched by the medical professional for support.
Motivation:
Integrated technology is primarily used in diagnostic equipment. The diagnostic devices must be free of defects since the health care system is very crucial. As a result, device manufacturers thoroughly test and validate the integrated programming. They use a variety of fault diagnosis approaches, including data analysis, defect localization, software testing, analytics, and prototype validation [8]. In the context of healthcare, the effects of software failures are severe. Medical device software flaws may result in fatalities or serious injuries and must be promptly fixed. Different techniques for avoiding and detecting defects are used to classify system failures according to their symptoms and problems. The type of fault can be used to come up with a way to prevent and find faults before the system is put into use.
For the goal of feature selection, we used the genetic algorithm. We had to choose the features independently since the Level-based Regression models and Tree-based method both extracted features. The extracted characteristics of the Level-based Regression model and Tree-based method were chosen individually using the genetic algorithm, one at a time. Following that, a hybrid analysis using a tree-based technique was performed on the chosen characteristics. The last phase was utilizing machine learning classifiers to categorize our photographs into four groups. Following the processes of feature extraction and feature selection, we generated classification results using machine learning classifiers to evaluate the effectiveness of our model.
Our proposed system:
• A novel optimized tree-based algorithm used for feature selection
• Better accuracy with the help of the proposed technique
2. Related Work2.1. Fault Diagnosis in Medical Devices
The remaining paper is organized as follows: Section 2 summarizes earlier literature on diagnosing and understanding the faults in diagnostic instruments. Section 3 elaborates on the methodology and its training procedures, together with the framework, and explores experiment analysis in section 4. Section 5 explores our proposed system assessment methods. Section 7 concludes and followed future updates.
Monitoring equipment suspected of malfunctioning by therapeutic customers is often referred to a clinic's health informatics service for diagnostics and repair by competent healthcare technicians. While restoring the gadget to operation, servicing documents are done basically. Observations are inaccurate due to the constraints, resulting in erroneous diagnostics, false reports, and inaccurate supervision. As a result, defect identification is critical before the therapeutic screening test procedures to help the correctness and consistency of data sources [9]. Using a Kernel trick, they estimated the probability of the gap between a sensing element and the average of input samples. A data instance is deemed defective if the estimated proximity has a minimal possibility. Another method was predicting a Gaussian distribution [10, 11] method to evaluate the likelihood of failure for node mobility input. Nevertheless, quantitative forecasting techniques may execute that whenever the incorrect observations are determinant factors with a lower probability.
Furthermore, the learning data comprise errors that disturb the measured values for specific evaluation metrics. Attempted linear regression is utilized to estimate the reading of a sensor, such as HR, based on the readings of its neighbor sensors. Reading is considered faulty if its discrepancy from the predicted value exceeds a certain threshold. On the other hand, vital human signs should not have regular connections and determine which measurement is incorrect. Microcontroller data can be sent to clinicians via Wi-Fi, giving additional observation of health parameters. The doctor may analyze the data supplied by the device. It is up to the patient to assess themselves and determine their level of exercise without the assistance of a human being. The Map Reduce method is utilized in this chapter to determine the patient's health state. The controller is linked to a signal that alerts the attendee if the sensor output data differs from what the controller expects. Alerts are delivered to the doctor through IoT devices that may offer immediate provisional medicine to the ill person in an emergency. Using minimal power, a simple setup, and excellent performance and responsiveness, the system increases the use of medical equipment.
Interpretations for consumers perceiving technologies [12, 13] are broken, including equipment layouts that fail to accommodate customer requirements, behavior and performance, environmental influences, and transient defects. A functionality design issue in a piece of medical equipment was discovered [14] during an inquiry describing the sequence. According to an event at a clinic, an injection device produced a medicine dosage in half the cases expected.
Hereunder are summaries of the thirteen primary indications [15]:
• Actions: the device works due to a particular method's result.
• The operation is mechanical, such as cantilever movements.
• Facts: a result of records, typically deterioration or lack of training dataset.
• View: the graphic representation of facts, words, or graphics displayed in different forms.
• Performance: a particular computation or operation, such as a programming configuration in a single region.
• Public: insufficient data to classify.
• Source: the first feedback (transcribed, sampling, acquired from technology, data, document, or record, for example) onto which specific action is done.
• Performance is the outcome of an operation, particularly performance used by the following method.
• Effectiveness: According to customer feedback, "performance indicators were not reached.
• Reaction: things that shouldn't have occurred, such as subsequently leading more than the
• Permissible quantity, reflected in particular equipment operation, has occurred.
• Several operations fall under the broad category of "operation," each incorporating more than one aspect, such as circulation, ventilation, and prescription.
• Hardware And networks: the entire network
• Scheduling: The scheduling of the device or performance of the equipment.
• The customer provides manuals and other instructions for the professional.
3. Methodology
The method uses a confusion matrix, which shows the performance of the relevant algorithms. The confusion matrix for the proposed method is presented in Table
GA is an evolutionary systematic randomized worldwide and immediate technique commonly reflecting the actual biology evolutionary processes; in effect, it is a practical, simultaneous, and universal search technique. In the construction of various GA’s, fundamental analysis is performed utilizing GA elements, which are as follows:
-
• Solution Representation : A data set is considered for analysis; relevant data quantity is selected to represent a solution to a specific real-time problem.
-
• Initial Population : The relevant data quantity considered takes a random initial population, a genetic space in the analyzed data set.
-
• Fitness Function : a solution for the data set considered for analysis, fitness function is selected.
-
• Selection Process for Chromosomes and Encoding : Generate a new population called data genes. A chromosome selection process is performed and is the basic building block of GAs.
Generic Operators : Create new chromosomes with a generic operator such as crossover and mutation applied to selected chromosomes. Genetic Operations are
-
• Reproduction or Selection Process : The best fit individual data with a higher contribution rate is selected in the selection process. The best fit can act as a parent and further propagate descendants of the next generation.
-
• Crossover : The procedure of producing a new pair of genomes by exchanging parts of the genes on two chromosomes that have been chosen because of their high levels of fitness. It makes it easier for the evolutionary process to go toward promising areas of the solution space. This is the most critical genetic modification that may be made to the GA. An entirely new organism is produced when the crossover method swaps the genomes of two separate people who were both picked from the same place.
-
• Mutation: is the unpredictability of the significance of a genome, which, in the past, was utilized to offer the possibility of producing fresh persons for each subsequent stage.
• A learning methodology or approach to accomplish data categorization with high accuracies, such as a decision tree algorithm. The learning method provides an explicit description of the data patterns to acquire the necessary knowledge for accurate data categorization. If the data being utilized is incomplete and inconsistent, then the learning algorithm being employed has failed in terms of its accuracy in categorization.
• This function estimates the time necessary to represent the data pattern and attributes and classify relevant and irrelevant characteristics; this information defines the time required to search and the availability of data. 2. The data classification function. Data must be available for the appropriate period to accurately estimate the learning curve for a classification function.
• Numerous data features must be collected throughout the learning phase to construct an accurate algorithm. This data is adequately considered. Consider all the data used in the learning process to enhance categorization.
• Complex and private qualities must be present for data mining to work; the data mined from these data sets contains important and informative attributes. There must be careful planning for the algorithm that learns different forms of data so that it can focus on helpful information acquired from sample data sets.
3.1. Genetic Data Algorithm
3.2. Feature Selection
4. Experiment Results
The data feature learning problem given during the design of the Genetic Data Algorithm has already been described. Feature learning is a complex problem since it involves sifting through a large amount of data to find relevant patterns. An adaptive propagation planning approach has been proposed to improve the accuracy of data feature structures, computations, predictions, and genetic data feature diagnostics. In this way, we may improve the instruction algorithm.
Predicting : In forecasting, the calculated sentence is properly analyzed for supervised learning models to identify the end issue by correlating complicated feature learning. Throughout Classification analyses, results forecasting utilizes a target variable to produce a latency value. The latency value is used to anticipate actual latency in comparing the classification algorithm with genuine latency to enhance upcoming consistent latency values. Prospective latency values are used to learn later actual values. Although during the optimization method, the exact value for training and learning instance operations is evaluated, and the optimal solution is determined.
It is common practice in engineering and research to employ genetic algorithms for multivariate parameter estimation. This technique has solved many problems, including electricity distribution, biochemical networks, and time management. Interesting about this application is the ability of a genetic algorithm approach to generate natural laws from observed data without any prior knowledge of physics or geometry [16-19]. By "genetic algorithm," we mean a method's operators that mimic the natural selection processes that have led to biological evolution. For a genetic algorithm to "evolve" from generation to generation, it must "mate" and "mutate" a limited number of candidate models, which it does so by applying operators that "mutate" and "mate" the current generation's candidate models.
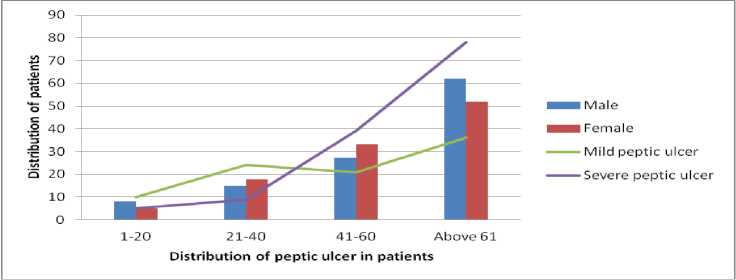
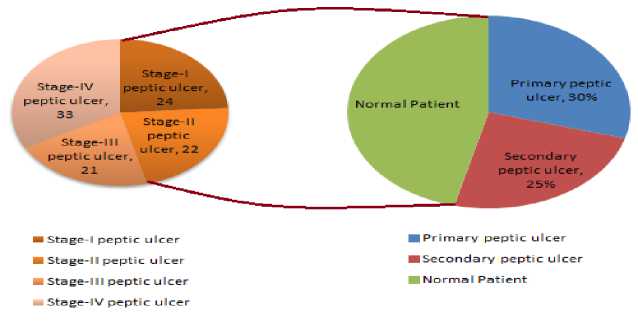
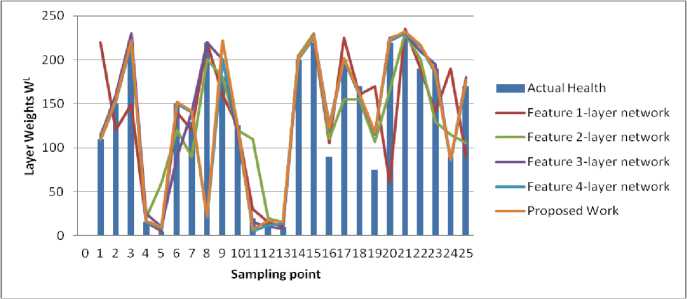
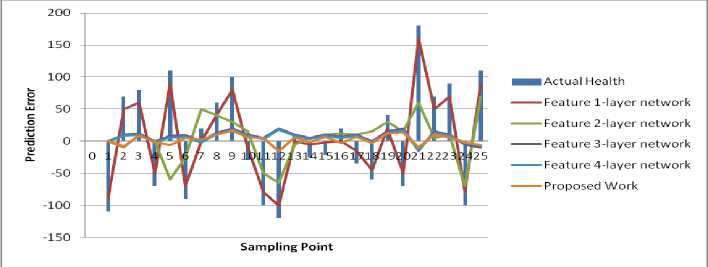
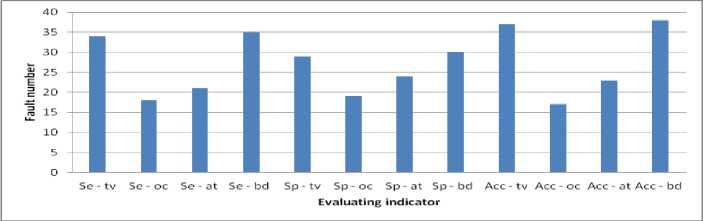
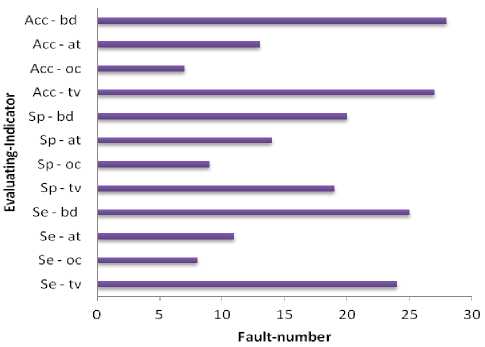
Suppose a collection of Ds instances si, i=0, 1, Ds, and conditions that choose the data that is needed as CDs=(mini Dataset used When implementing a GA from MATLAB R2006b, the gasohol was employed. Ulcer and non-ulcer pictures from Endoatlas [20] and GastroLab database [21], as well as real-time Wireless Capsule Endoscopy (WCE) frames with and without ulcers, were utilized in the tests. Figure 1 exhibits WCE photos with ulcers of various sorts, both from a database and in real-time, and a selection of these photographs. (a) (b) (c) Fig.1. Images with ulcer (a) Jejunal ulcer, (b) Ileal ulcer, and (c) Duodenal ulcer Analyzed datasets were separated into two categories: training and testing. We utilized 60% of the dataset for training and 40% for testing in this research, according to Table 2. Our training and testing datasets have an equal amount of pictures of ulcers and non-ulcers, resulting in a well-rounded dataset. Table 1. Datasets used to do analysis. Dataset Training dataset Testing dataset Nonulcer vs. ulcer images in the training Nonulcer vs. ulcer images in testing Sample1 896 768 448:448 384:384 Sample2 628 542 314:314 271:271 Sample3 498 368 249:249 184:184 The previous work is shown in Table 2 below. Table 2. Previous work Techniques with Dataset. Techniques/Methods Disease Dataset Accuracy VGG16 and SVM [22] Ulcer and Bleeding 6000 Images 98.4% CNN [23] Ulcer 17640 Images 96.7% ResNet and LSTM [24] Ulcer and Crohn’s 52,471 Frames 97.05% SVM and MLP [25] Ulcer 2333 Images 94.07% Performance Metrics: This is done by calculating performance indicators such as recall and precision and an F1-Score to verify the performance. Correctly anticipated positivity is known as a "True Positive" (ulcer). False Negative (FN) is the opposite of True Negative (TN) (non-ulcer). A false positive (FP) is when a patient's test results were wrongly reported as positive (for an ulcer). A patient's biopsy may return negative if a False Negative (FN) diagnosis is made. Using Eq. (1)–(8), the following metrics are calculated: recall, precision, F1-Score, Accuracy, Sensitivity, and Specificity. The method's precision may be determined by using the accuracy score imported from supervised learning The precision with which the effectiveness is evaluated (TP + TN) / (TP + TN + FP + FN) = Effectiveness One of the most critical aspects of the suggested approach is choosing acceptable data for determining the evolutionary method's parameters. Parameters, operators, instance variables, ring and element sizes, and conditional patterns make up the data for this approach. The optimization process method discovers all aspects contributing to software vulnerabilities, using this dataset to modify the populace formed at every step. Recall = TP / (TP + FN)(1) Precision = TP/ (TP + FP)(2) F- Score = 2* TP / (2* TP + FP + FN)(3) Accuracy = (TP + TN) / (TP + TN + FP + FN)(4) Sensitiity = TP / (TP + FN)(5) Specificity = 1 – { (FP / (FP + TN) }(6) The correlation coefficient is defined between the predicted and actual/observed values. RMSE = √ ∑N(yi – ŷi)2 i=1 MAE = ∑N │yi – ŷi│ i=1 N is the number of non-missing data points, Yi is the observed value, and y^ is the projected value. Medical Breath Analyzer for the Peptic Ulcer on the Internet of Things The Purpose of the Study. This study conducts a systematic literature review to examine the causes of Peptic Ulcers and the differences between various preventative measures for patients based on theoretical conclusions from preventive medicine and lessons learned from significant data integration research. Sources of Information. The majority of the data in this study comes from a city's Local General Hospital. In the hospital, we performed a survey of patients of various ages and gathered important data. A Breath Device Experiment to Study the Peptic Ulcer Patients with Peptic Ulcers: Distribution. We analyzed the demographics of 100 individuals with Peptic ulcers and grouped them into gender and age categories. Figure 2 depicts the detailed statistics. Fig.2. Distribution of peptic ulcers in patients. A look at the data reveals evident disparities between individuals with Peptic ulcers. Peptic Ulcer affects a small number of people under the age of 35 in the study group; however, the percentage among those over 35 is significantly higher. Peptic Ulcer affects the elderly at a higher rate than any other age group, with persons over 60 accounting for more than half of those afflicted. Internet of Things in Healthcare: What Is It? We can do automated tests to see whether the Breath gadget may help avoid Peptic Ulcers. We compare the manual breath device to the Internet of Things medical equipment. To increase the relative prevention impact, Figure 3 shows the detailed data. Fig.3. Peptic ulcer Stages in Normal patient contrast. The chart shows that using a breath device may cut gastric orders by approximately 60 percent and peptic ulcers by about 40 percent. It is estimated that adopting IoT may boost the breath device's efficiency by around 27% compared to the already used approaches. Peptic ulcers may be prevented by using breathing medical devices in the logistics network. Table 3 shows that it gathers environmental data, device parameters, and air path factors contributing to device failure. Table 3. Breathe device data collection. Requirements Mainly for Collective Module Environmental data modules. Modules for power, air, and temperature, as well as data gathering using humidity sensors. The antibiotics acquisition module collects stress-induced channels of independent smoking rate. Collection of device factors. Input voltage and current of breath device, air oxygen module and exhale/inhale module. Upper and Lower extremities module on the lining of the oesophagus, stomach, or small intestine. Airpath collection. Internal abdominal pain, excessive air-oxygen mixture flow, chest or upper-abdomen gas pressure, concentration, and humidity monitoring. Digestive tract module for stomach acid damage. Equipment Health and Fault Diagnosis for Medical Breathing Devices. We use the four feature-layer network medical device signals with the corresponding characteristics as input to the network. We also predict medical breath device equipment health as the network's prediction output. We select 100 groups of sampling data and use 80 percent as training data and 20 percent as test data. Single-layer network model based on suggested neural networks is used in feature learning as an input parameter. The select range features a 1-layer network as model 1. Using the feature 1-layer network model based on the suggested neural network, as model 2, pick range feature 2-layer network. Using the suggested neural network feature 2-layer model, pick range feature 3-layer network as model 3 for the input parameter. Select range feature 4-layer network model 4 as the input parameter for the feature 3-layer model based on the suggested neural network. When input parameters are combined with the hybrid network model based on the proposed neural network, the four models for the health degree of medical breath device equipment are shown in Figure 4. According to Figure 4, when comparing the anticipated health of medical breath device equipment to the actual health of medical breath device equipment at various sample points, the predicted health value is almost identical to the actual health value. The most significant discrepancy exists for medical breath device equipment between the projected and actual health degree values in model 1. When it came to predicting the health of medical equipment, the second model was less accurate than the first model. Predicted medical breath device equipment values in model 3 are generally compatible with absolute medical breath device equipment values. However, the health degree values of specific medical breath device equipment are more significant than actual medical values for breath device health degrees. Medical values for breath device health degrees may be improved using a hybrid network model based on the suggested neural network as an input parameter. The projected values for breath device health degrees are almost identical to the actual values for breath device health degrees. The four models' prediction mistakes are analyzed and assessed to understand how they affect the prediction. Differences in projected and actual levels of health are known as prediction errors. E. E > 0 denotes an early prognosis of health status, while E 0 denotes a prediction of health status that occurred too late. Figure 5 shows the four models' respective error bars for their predictions. Fig.4. Comparison of health device layer weights with the predicted sample points of four feature-layer network models. Fig.5. Comparison of four feature-layer network models for health device layer prediction errors We used the Tree-based approach, which collects independent samples in two phases, followed by Level-based Regression, to identify features for the peptic ulcer study. The Tree-based approach was used to partition the collection of three sample characteristics into subsets and identify the essential features in each subset. Once these feature groups were combined, we used tree-level analysis to identify all the characteristics. After that, we utilized Level-based Regression to extract important ulcer characteristics for the model-building process. These properties are presented in Table 4 and reveal that all studied learning algorithms produce solid peptic ulcer predictions with little variations in performance. Table 4. Table summarising regression performance metrics for each of the three learning models that have been applied. RMSE, MAE, and Pearson's correlation Learning models Correlation RMSE MAE Accuracy Random Forest 80.83 8.79 6.78 97.21 Multilayer perceptron (MLP) 69.42 10.28 7.45 97.69 Linear Model 68.24 9.29 7.32 91.81 Proposed Work 80.95 8.82 6.92 98.52 The neural network was built using a training set of 80 Breath Device (bd) failures in this research. A comparison of the neural network's ability to detect the defect mode of medical breath device equipment is made once the neural network training is completed. An abnormal volume (TV) fault may be detected by the proposed medical breath device fault detection technology based on a rough set and neural network algorithm in the training set for the breath device equipment fault. This can be shown in Figure 6. When the neural network method used in the research to identify medical breath device faults is applied to the training set, it can be deduced that 92.5 percent accuracy and 89.26% sensitivity are achieved, and the training set was found to be accurate at 91.34% of the time. The preliminary set hybrid neural network was used to evaluate 70 breath devices after training. 32 breath devices with abnormal volume, 12 breath devices with abnormal oxygen concentration (OC), and 26 breath devices with abnormal air tightness were included in the test set for comparison (at). It is compared to the application impact of the proposed hybrid neural network after training. An example of a trained neural network using a raw set to detect equipment failure in a medical breath device is seen in Figure 7. Medical breath device defect identification after training has an overall recognition sensitivity of 81.52%, specificity of 84.21, and accuracy of 86.52 percent for rough set and hybrid neural network-based methods, respectively. fig.6. compares the outcomes of breath device defect by pattern detection using a simple set against a neural network in a training set. Fig.7. Test set comparison of breath device defect by pattern identification outcomes based on rough set and neural network. Using the current state-of-the-art approaches, we compared our results to our findings. According to our findings, the suggested hybrid method improved the outcomes significantly. Table 5 provides a side-by-by-side comparison. Table 5. An evaluation of the proposed method's performance compared to current best practices. Techniques/Methods Disease Dataset Accuracy CNN Ulcer 17,640 Images 96.7% DCNN [26] Gastric Cancer 763 Images 96% VGG16 and SVM Ulcer 6000 Image 98.4% Inception V3 and SVM [27] Bleeding 2352 Images 97.71% Proposed - Tree-Level and GA Ulcer and Cancer 3700 Images 98.6% Table 6 shows that when the number of training datasets rises, the performance also improves. Table 6. Comparison of various ratios of training and testing dataset’s accuracy, precision, recall, F1 score, sensitivity, and specificity Dataset Accuracy % Precision % Recall % F1-score % Sensitivity % Specificity % Sample1 95.57 96.7 96.0 96.6 96.4 96.7 Sample2 93.0 93.0 89.7 91.3 89.4 93.0 Sample3 90.0 91.1 89.02 90.0 89.0 91.0 Discussion and Analysis of Security Issues We intend to lower the processing cost of sensors and the amount of data they must broadcast to extend their useful lives. Table 7 shows that this work's calculation cost of sensor node authentication messages is relatively cheap. Table 8 shows that the sent message bits are also smaller, with BUi being the breath device user I, GWi being the Gateway j, and SNk being the Kth sensor device node. H and ECC stand for the hash function execution time and the ECC dot product, respectively. Table 9 shows a comparison of security performance. Table 7. Computation cost Choi et al., [27] Kumar et al., [28] Proposed Work BUi 12 H+ 3 ECC 8 H 8 H GWi 5 H+ 1 ECC 9 H 8 H SNk 7 H+ 2 ECC 5 H 5 H Total 24 H+ 6 ECC 22 H 20 H Execution time 0.390 s 0.011 s 0.0100 s Table 8. Communication cost Choi et al., [27] Kumar et al., [28] Proposed Work Total communication cost (bits) 3040 1792 1821 Communication cost of sensor devices (bits) 3040 800 879 Sensor device cost (%) 100 44.64 60 Table 9. Comparison of security requirements. Choi et al., [27] Kumar et al., [28] Proposed Work confidentiality concerning the identity of the user X √ √ Protect yourself against a session-key assault. √ √ √ Resist the use of sensor energy √ X √ Refuse to be manipulated by your mind. √ √ √ Resistance to re-encounters √ √ √ Attacks on a guy in the midst √ √ √ Verification by both parties √ √ √ Agreement between the sensor and the user is essential. √ √ √ According to Table 10, we compared 10 different machine learning classifiers for the same datasets using crossvalidation approaches. The findings show that the suggested technique outperforms well-known machine classifiers such as Nearest Neighbours, Gaussian Process, and Naive Bayes. In order to train and test the classifiers, we used the identical training and testing data set as in sample 1 of Table 1. Table 10 compares the proposed work to standard machine learning classifiers and shows the best precision, recall, and accuracy scores. Since the suggested technique has an advantage, it can be concluded that the deep neural network is most successful when applied to a more significant and diverse training set. Table 10. Comparison of proposed work with other classifiers. Classifiers Precision (%) Recall (%) Accuracy (%) Gaussian Process 77 76 73 NaiveBayes 74 53 53 Nearest Neighbors 69 68 66 Proposed Work 98.8 98 97.79 Table 11 illustrates that the suggested work's accuracy ranges from 90 percent to 95 percent compared to the current CNN. Table 11. Comparison with existing techniques Methodology Accuracy % Sensitivity % Specificity % CNN model with 5560 WCE images [29] 90.8 90 91 HANet with ResNet-34 [30] 92 91 92 AlexNet CNN [31] 95 96 95 Proposed 98.79 98 98.9 Experiment findings have been compared against state-of-the-art machine learning classifiers using accuracy, sensitivity, specificity, preciseness, recall, and F1 score, among others.
5. Discussion To obtain the final accuracy of the proposed methodology, we provided the hybrid-analysis selected features to different machine learning classifiers. The analysis of these classifiers was conducted through well-known performance metrics, including sensitivity, precision, accuracy, and f1-score. We observed that the proposed hybrid-analysis GA classifier outclassed the other classifiers, with an accuracy of 98%. The results show that the proposed method achieves higher precision; which indicates the testing samples are correctly identified as positive. The higher value of recall indicates a lower value of False Negative cases i.e. all the ulcer samples being identified as the accurate ulcer regions which improved comparatively. A complete end-to-end machine learning methodology is implemented wherein the original ulcer images are the inputs to the system to obtain the desired results. And, we processed the ulcer images using the image segmentation method to overcome the drawbacks of low clarity and quality of ulcer images; which is unavoidable in the raw ulcer images due to their size limitations. In the clinical environment the implementation of the proposed method helps the doctors quick screening and identification of ulcer images from the huge number of other images in the ulcer database; thereby reducing the limitation of analyzing large ulcer images manually. The images were labeled by the hospitals before training. The dataset from hospitals helped us to obtain real-time ulcer images and diagnosis reports for normal as well as cases with the ulcer. The proposed method analysis can be used as a pre-screening ulcer diagnostic system helping doctors to take decisions that would aid ulcer recognition with higher efficiency. The outcome of the proposed method analysis when combined with ulcer diagnosis helps to improve the accuracy and save time. The huge differences in the accuracy values are due to the different familial information used. We can conclude that the direct comparison of the proposed method with other similar works is fully justified by the varying datasets. The study and the experiments conducted show that method analysis is made as per the datasets considered. The datasets considered with different methods improve the performance, and hence GA method improved in this work with the familial information GA architecture with its learning parameters.
6. Conclusions Manual identification of Peptic Ulcers is a challenging task, and there is a need to have CAD for efficient and accurate results. This work proposed a machine learning-based model following the feature selection framework to classify different Peptic Ulcers. We selected two different models: A tree-based algorithm and Level-based Regression to extract features and then used machine learning on the feature vectors before using them as feature extractors. In feature selection, a relational GA selected familial information from the extracted feature vectors. The above process of hybrid analysis helped the proposed work to improve the accuracy, due to better predictor values. Experimental results demonstrate that the proposed analysis outperforms a better GA model, especially for the recognition of small peptic ulcer regions. Visualization with the Breath device further demonstrates the importance of the proposed model to locate an exact area accurately in an ulcer-data image. Also, we conducted experiments to analyze the effect of a number of peptic ulcer regions. The performance of RF, MLP and the linear model using these features summarized results show that all tested learning methods give robust peptic ulcer predictions with minimal differences, compare to the proposed work. From the overall analysis, after training, the overall recognition sensitivity, specificity, and accuracy of the medical breath device equipment fault recognition based on rough set and hybrid neural network are 81.52%, 84.21%, and 86.52%, respectively. To sum up, it can be seen that when the medical breath device equipment fault detection technology based on a rough set and neural network algorithm proposed in the study detects the training set, the total sensitivity of the corresponding breath device fault detection is 89.26%, the corresponding specificity is 91.34%, and the accuracy rate is 92.5%. The proposed work achieved the best precision, recall, and accuracy values as compared to the traditional machine learning classifiers. Successfully analyzed in this paper were relative-feature learning algorithms (RFL). This article contributes to the feature learning topic in three ways: This study is the first to propose that a hierarchical distribution of computing values can be used to describe sophisticated feature learning and explains how this may be used in genetic data. Feature-test-suite diagnostic creation and extended data testing by non-repetitive feature cases are combined in our suggested approach to identify data from alignment issues, resource leaks, and feature-data ambiguity.
7. Future Work In the future, one of the most notable structures is to categorize and identify actual or false grouping of a fuzzy neural network set. It is self-organizing if the fuzzy neural network can change its layers during training. The selforganizing fuzzy neural network is one of the strongest and fastest forecast structures based on early training. It suggested using this structure to forecast software errors in future research.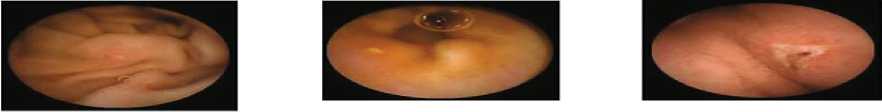
References Optimization of Fault Learning in Medical Devices
- [1]Hooman, J., Mooij, A.J., van Wezep, H.: Early fault detection in the industry using models at various abstraction levels. In: Derrick, J., Gnesi, S., Latella, D., Treharne, H. (eds.) IFM 2012. LNCS, vol. 7321, pp. 268–282. Springer, Heidelberg (2012).
- G. Latif shabgahi et al.,“A novel family of weighted average voters for Fault-Tolerant Computer systems. Cambridge, UK presented in Proceedings fo ECC03: European control conference 2003.
- K. O. Jones, “Comparison of genetic algorithm and particle swarm optimization,” in Proceedings of the International Conference on Computer Systems and Technologies (CompSysTech ’05), 2005.
- S. Panda and N. P. Padhy, “Comparison of particle swarm optimization and genetic algorithm for FACTS-based controller design,” Applied Soft Computing, vol. 8, no. 4, pp. 1418–1427, 2008.
- C.-C. Chiu, Y.-T. Cheng, and C.-W. Chang, “Comparison of particle swarm optimization and genetic algorithm for the path loss reduction in an urban area,” International Journal of Applied Science and Engineering Research, vol. 15, no. 4, pp. 371–380, 2012.
- R. Rajendra and D. K. Pratihar, “Particle Swarm Optimization Algorithm vs. Genetic Algorithm to Develop Integrated Scheme for Obtaining Optimal Mechanical Structure and Adaptive Controller of a Robot,” Intelligent Control and Automation, vol. 02, no. 04, pp. 430–449, 2011.
- V.Kakulapati et al.,” Improved Usability of IoT Devices in Healthcare Using Big Data Analysis” in the book “Predictive Intelligence Using Big Data and the Internet of Things,” A volume in the Advances in Computational Intelligence and Robotics (ACIR) Book Series, IGI global book, DOI: 10.4018/978-1-5225-6210-8.ch005.
- I. Tumar, Y. Hassouneh, H. Turabieh, and T. Thaher, “Enhanced binary moth flame optimization as a feature selection algorithm to predict software fault prediction,” IEEE Access, vol. 8, pp. 8041–8055, 2020.
- O. Salem, Y. Liu and A. Mehaoua. Anomaly Detection in Medical Wireless Sensor Networks. Journal of Computing Science and Engineering,7(4): 272-284, 2013.
- D.-J. Kim and B. Prabhakaran. Motion Fault Detection and Isolation in Body Sensor Networks. Proceeding of IEEE International Conference on Pervasive Computing and Communications, pp. 147-155, 2011.
- D.-J. Kim and B. Prabhakaran. Motion Fault Detection and Isolation in Body Sensor Networks. Pervasive and Mobile Computing, 7(6): 727- 745, 2011.
- O. Salem, A. Guerassimov, A. Mehaoua, A. Marcus and B. Furht. Sensor Fault and Patient Anomaly Detection and Classification in Medical Wireless Sensor Networks. Proceeding of the 2013 IEEE International Conference on Communications, pp. 4373-4378, 2013.
- Draper S. Human factors engineering a partnering opportunity for clinical engineering. J Clin Eng 2004;29(4):198–205.
- Draper S, Nielsen G, Noland M. Using no fault found in infusion pump programming as a springboard for learning about human factors engineering. Jt Comm J Qual Saf 2004;30(9):515–20.
- Zhu JZ (2002) Optimal reconfiguration of electrical distribution networks using the refined genetic algorithm. Elect Power Syst Res 62:37–42.
- Moles CG, Mendes P, Banga JR (2003) Parameter estimation in biochemical pathways: a comparison of global optimization methods. Genome Res 13:2467–2474
- Reeves CR (1995) A genetic algorithm for flowship sequencing. Comput Oper Res 22:5–13
- Schmidt M, Lipson H (2009) Distilling free-form natural laws from experimental data. Science 324:81–85
- Goldberg DE (1989) Genetic algorithms in search, optimization, and machine learning. Addison-Wesley, Boston.
- Endoatlas, endoatlas (2019 (accessed June 2017)). http://www.endoatlas.org. Fan, S., Xu, L., Fan, Y., Wei, K., Li, L., 2018. Computer-aided detection of small intestinal ulcer and erosion in wireless capsule endoscopy images. Physics in Medicine & Biology 63 (16). 165001.
- GastroLab, GastroLab (2019 (accessed May 2019)). http://www.gastrolab.com. Glorot, X., Bordes, A., Bengio, Y., 2011. Deep sparse rectifier neural networks. In: Proceedings of the Fourteenth International Conference on Artificial Intelligence and Statistics, pp. 315–323.
- Khan, M.A.; Kadry, S.; Alhaisoni, M.; Nam, Y.; Zhang, Y.-D.; Rajinikanth, V.; Sarfaraz, M.S. Computer-Aided Gastrointestinal Diseases Analysis FromWireless Capsule Endoscopy: A Framework of Best Features Selection. IEEE Access 2020, 8, 132850–132859.
- Klang, E.; Barash, Y.; Margalit, R.Y.; Soffer, S.; Shimon, O.; Albshesh, A.; Ben-Horin, S.; Amitai, M.M.; Eliakim, R.; Kopylov, U. Deep learning algorithms for automated detection of Crohn’s disease ulcers by video capsule endoscopy. Gastrointest. Endosc. 2020, 91, 606–613.e2.
- Owais, M.; Arsalan, M.; Choi, J.; Mahmood, T.; Park, K.R. Artificial Intelligence-Based Classification of Multiple Gastrointestinal Diseases Using Endoscopy Videos for Clinical Diagnosis. J. Clin. Med. 2019, 8, 986.
- Charfi, S.; El Ansari, M. Computer-aided diagnosis system for ulcer detection in wireless capsule endoscopy videos. In Proceedings of the 2017 International Conference on Advanced Technologies for Signal and Image Processing (ATSIP), Fez, Morocco, 22–24 May 2017; pp. 1–5.
- Ma, B.; Guo, Y.; Hu, W.; Yuan, F.; Zhu, Z.; Yu, Y.; Zou, H. Artificial Intelligence-Based Multiclass Classification of Benign or Malignant Mucosal Lesions of the Stomach. Front. Pharmacol. 2020, 11, 572372. [CrossRef] [PubMed]
- Caroppo, A.; Leone, A.; Siciliano, P. Deep transfer learning approaches for bleeding detection in endoscopy images. Comput. Med. Imaging Graph. 2021, 88, 101852.
- D. Kumar, S. Chand, and B. Kumar, “Cryptanalysis and improvement of an authentication protocol for wireless sensor networks applications like safety monitoring in coal mines,” Journal of Ambient Intelligence and Humanized Computing, vol. 10, no. 2, pp. 641–660, 2019.
- Aoki, T., Yamada, A., Aoyama, K., Saito, H., Tsuboi, A., Nakada, A., Niikura, R., Fujishiro, M., Oka, S., Ishihara, S., et al., 2019. Automatic detection of erosions and ulcerations in wireless capsule endoscopy images based on a deep convolutional neural network. Gastrointestinal Endoscopy 89 (2), 357–363.
- Wang, S., Xing, Y., Zhang, L., Gao, H., Zhang, H., 2019. Deep convolutional neural network for ulcer recognition in wireless capsule endoscopy: experimental feasibility and optimization. Computational and Mathematical Methods in Medicine.
- Fan, S., Xu, L., Fan, Y., Wei, K., Li, L., 2018. Computer-aided detection of small intestinal ulcer and erosion in wireless capsule endoscopy images. Physics in Medicine & Biology 63 (16). 165001.
