Optimizing Kidney Stone Detection: Exploring YOLOv8 Variants for Computational Efficiency and Enhanced Accuracy

Author: Amol Satsangi, Shaurya Jain, Subho Upadhyay
Journal: International Journal of Intelligent Systems and Applications @ijisa
Article in issue: 5 vol.17, 2025.
Free access
Kidney stones are solid mineral and salt deposits formed within the kidneys, causing excruciating discomfort and pain when they obstruct the urinary tract. The presence of speckle noise in CT-scan images, coupled with the limitations of manual interpretation, makes kidney stone detection challenging and highlighting the need for precise and efficient diagnosis. This research investigates the efficacy of YOLOv8 models for kidney stone detection, aiming to strike a balance between computational efficiency and detection accuracy. This study's novel evaluation framework and practical deployment considerations underscore its contributions to advance kidney stone detection technologies. It evaluates five YOLOv8 variants (nano, small, medium, large, and extra-large) using standard metrics such as precision, recall, F1-score, and mAP@50, alongside computational resources like training time, power consumption, and memory usage. The comprehensive evaluation reveals that while YOLOv8s and YOLOv8e demonstrate superior performance in traditional metrics, YOLOv8s emerges as the optimal model, offering a harmonious balance with its high precision (0.917), highest mAP@50 (0.918), moderate power consumption (150W), and efficient memory usage. Graphical analyses further elucidate the behaviour of each model across different confidence thresholds, confirming the robustness of YOLOv8s. Additionally, this research explores the impact of model size and complexity on inference speed, demonstrating that smaller YOLOv8 variants achieve real-time performance with minimal latency. The study also introduces a method for model scalability, allowing for adjustments in accuracy and computational demand based on specific clinical or resource constraints. These contributions further emphasize the importance of holistic model assessment for real-world medical applications.
Kidney Stone Detection, Computer Aided Diagnosis (CAD), YOLOv8, Computational Efficiency, Deep Learning
Short address: https://sciup.org/15020003
IDR: 15020003 | DOI: 10.5815/ijisa.2025.05.01
Text of the scientific article Optimizing Kidney Stone Detection: Exploring YOLOv8 Variants for Computational Efficiency and Enhanced Accuracy
Kidney stones, scientifically known as renal calculi or nephrolithiasis or urolithiasis, are salt deposits and solid mineral formed within the kidneys. It provides an excruciating discomfort and pain when it obstructs the urinary tract. It is an increasing urological disorder of human health, affecting about 12% of the world population [1]. The numerous types of kidney stones include calcium oxalate stones, uric acid stones, calcium phosphate stones and struvite stones [2]. Each of these exhibits distinguishable characteristics and require specific treatments.
The primary issue in kidney stones is the lack of early prediction. This happens because, in most cases, the stones continue to grow and become painful as they increase in size. Due to this delay in detection and diagnosis, it can lead to severe pain, urinary tract infections, and ultimately kidney damage. This disease affects people irrespective of age, gender, and race. Recent research of Zhu Wang et al. [3] indicated that kidney stone cases are reported increasing worldwide with 5.8% among Chinese adults affected which about 1 in 17 adults currently have disease. Hence accurate and early becomes important.
To address this problem, medical imaging methods are used as the first step of examination. Many medical imaging types, such as X-ray imaging, computed tomography (CT), and ultrasound, have become significant for diagnosis. These methods require a trained practitioner for accurate detection, which can be time-consuming and lead to delays in treatment. Additionally, the potential for human error can result in inaccurate treatment, and the need for human expertise makes it a costly process. Therefore, this research proposes a computer vision-based algorithm that can be implemented into CAD systems. This approach contemplates to achieve better performance in detecting kidney stones and can be deployed for real-time tasks to assist in diagnosis.
YOLO (You Only Look Once) is a cutting-edge deep learning technique for disease detection in medical imaging [4-7]. Unlike traditional CNNs (Convolutional Neural Network), YOLO is optimized for speed and efficiency, making it ideal for real-time detection. It works by dividing the image into a grid, where each cell predicts bounding boxes and associated class probabilities, allowing for rapid and accurate identification of objects within medical images.
For this study, YOLOv8 was chosen for its improved efficiency, accuracy, and speed, making it ideal for real-time kidney stone detection. Its lightweight design allows deployment on low-resource hardware, ensuring wider clinical use. This study investigates the best YOLOv8 version for the detection of kidney stones using CT-scan images, achieving an optimal balance between computational efficiency and accuracy of prediction. This ensures that the system can be embedded in hardware with lower computational capabilities, making it accessible and practical for widespread clinical use. The main contributions of the research are as follows:
• Investigation of YOLOv8, providing insights into its capabilities for kidney stone detection within medical imaging applications.
• Comparison between all variants of YOLOv8 facilitates a nuanced understanding of each model's unique properties.
• The study introduces a novel evaluation framework that not only incorporates traditional performance metrics like precision and recall but also integrates considerations of computational resources such as training time, power consumption, and memory usage.
• The study has achieved high precision (0.917), high mAP@50(0.918), moderate power consumption and efficient memory usage, making it suitable for real time clinical use.
• The study also demonstrated the potential of smaller YOLOv8 models to achieve real time kidney stone detection with minimal latency, making it application in hardware-constrained clinical environments.
2. Related Works
The organization of the research paper is as follows: Section 2 reviews prior work in kidney stone detection. Section 3 covers the YOLO framework and its versions. Section 4 details the methodology, including the dataset, model versions, experiment setup, training, and evaluation. Section 5 presents results and graphical analysis. Section 6 provides conclusion and future research directions have been highlighted in Section 7.
In the field of kidney stone detection, various studies have utilized deep learning and machine learning techniques. Deep learning offers algorithms that are effective for image segmentation [8-9], detection [10-11], and classification [12-13]. Deep learning is becoming increasingly valuable in diagnosis system [9, 11, 13, 14-15]. Among the pertinent works is the early detection of chronic kidney disease using machine learning techniques [16].
Shi et al. [17] presented a segmentation based on fully automatic for kidney images, employing pre-trained CNN to extract relevant features. In [18], the new deep learning model with adaptive weighting score is used to predict a chronic kidney disease with 0.912 AUC. Abdullah et al. [16] focused on early detection of chronic kidney disease based on artificial neural networks (ANN, 99.75%) and support vector machines (SVM, 97.75%) techniques. Baygin et al. [19] developed ExDark19 for an automated kidney stone detection with 99% accuracy using CT images.
Ahmet Furkan Bayram et al. [20] proposed SOTA one stage detector YOLOv7 for detecting kidney disease with CT image. They experimented on both YOLOv7 and YOLOv7 tiny with results 84.9% and 70.3% mAP50 respectively. Authors [21] obtained a kidney segmentation IOU of 91.4% and kidney stone detection accuracies of 99.5% for YOLOv7 and 98.7% for YOLOv5.
The study in [22] enhances kidney stone detection in Kidney, Ureter and Bladder (KUB) X-Ray images by combining super resolution techniques with the redesigned YOLOv7, achieving a sensitivity of 91.7% and a precision of 97.3%. Another study [23] on YOLOv7, proposes an effective kidney stone prediction method with integration of Energy Valley optimizer for segmentation and Pulse Couple Neural Network (PCNN) for classification. This combination achieved superior accuracy of 98.88% compared to traditional techniques. The research [24] develops a kidney stone detection system using YOLOv5 achieving high performance metrics (average mAP of 95.71% and accuracy of 93.06%) and integrated it into a flask web interface. Table 1 combines the limitation of all the research.
Table 1. Summary of previous research works on kidney stone detection
|
Year |
Author |
Critique |
Reference |
|
2019 |
Abdullah et al. |
The use relatively small dataset of 400 patients might affect the generalisability of the machine learning model to larger, more diverse population. |
16 |
|
2020 |
Shi et al. |
This paper struggles with highly variable or noisy ultrasound images that differs significantly form the training data, limiting its robustness in real-world clinical settings. |
17 |
|
2018 |
V. B. Kolachalama et al. |
This study didn’t account for the impact of treatments such as immunosuppressive drugs, on renal survival. This could have influence outcome, as treatment may have improved survival beyond what the machine learning model predicted. |
18 |
|
2022 |
M. Baygin et al. |
The proposed ExDark19 model was only tested on specific datasets, which may limit its generalisability to diverse clinical senecios. |
19 |
|
2022 |
A. F. Bayram et al. |
The study only compares YOLOv7 and YOLOv7 Tiny on specific kidney-related conditions and no analysis was provided on the computational efficiency or real-time performance of these models in clinical settings. |
20 |
|
2023 |
S. Rabby et. al. |
The dataset used in the study was relatively small, potentially limiting the generalizability of the results to larger and more diverse datasets. |
21 |
|
2023 |
M. T. P. Nguyen et al. |
The study focuses solely on KUB X-ray images, which may not generalize well to other imaging modalities like CT or ultrasound. |
22 |
|
2024 |
B. Reuben et. al. |
A limitation of this study is the complexity of the proposed model, making it computationally intensive and less suitable for real-time clinical use. |
23 |
|
2024 |
A. Ramadhani |
A limitation of this study is the lack of validation on a larger and more diverse dataset, which could affect the generalizability of the model to different imaging conditions and patient demographics. |
24 |
Previous research has demonstrated the effectiveness of deep learning methodologies in various medical imaging tasks. While integration of diverse techniques has shown promising results, there is still a gap in achieving higher accuracy for kidney stone detection. This research findings contribute to the ongoing progress in leveraging artificial intelligence to enhance clinical applications and improve diagnostic accuracy in nephrology.
3. YOLO
This section delves into the You Only Look Once (YOLO) model, a cutting-edge methodology for detecting realtime object with exceptional speed and accuracy. The rest of the section delves into the evolution of YOLO through its various iterations, from YOLOv1 to the most recent advancements.
3.1. You Only Look Once (YOLO)
3.2. Versions of YOLO
YOLOv1 [25] was launched in 2016, introducing the innovative single-pass detection framework. This was followed by YOLOv2 [27] in 2017, which improved accuracy and speed through batch normalization and high-resolution classifiers. YOLOv3 [28] brought multi-scale predictions and a deeper architecture with residual connections. YOLOv4 [29] further enhanced performance with Cross-Stage Partial connections and the Mish activation function. YOLOv5, YOLOv6 and YOLOv7 focused on real-time performance and architectural innovations [30-32]. YOLOv8 [33] introduced more complex models with increased layers, advanced data augmentation, and improved training strategies. Each version has progressively improved in terms of the number of classes they can classify, the complexity of the model architecture, and overall detection accuracy and speed. Recently release version YOLOv9 and YOLOv10 are also continuing this trend [34-35].
4. Methodology4.1. Dataset Description
The dataset utilized in the research is collected from Roboflow (it is a large repository of datasets prepared for training YOLO models). The dataset [36] comprises a total of 1428 medical CT-scan images, annotated with a total of 2951 bounding boxes, indicating the presence and location of kidney stones. Some samples images from the dataset is shows in Figure 1. All the images are resized to a uniform resolution of 640x640 pixels. On average, there are approximately 2 annotations per image. The annotations are distributed across two main classes, “Tas_Var" (stone) and "normal-kidney" (normal). Table 2 shows the distribution of annotation in each set.
4.2. YOLOv8
Joseph Redmon et al. first proposed the YOLO framework in 2016 [25], revolutionizing object detection with a real-time end-to-end approach. Unlike previous methods that required either exhaustive sliding windows or a two-step process involving region proposals followed by classification, YOLO streamlined the task by accomplishing detection in a single network pass. This innovation drastically improved efficiency, as the network only "looks once" per image to predict objects. YOLO's architecture employs a straightforward regression-based output to predict bounding boxes and class probabilities simultaneously, contrasting with methods like Fast R-CNN [26], which use separate outputs for classification and bounding box regression. By integrating these predictions, YOLO achieves rapid and accurate detection, making it a valuable for real-time object detection.
This section describes the methodology used in this study. It delves into the details of the dataset used, architecture and properties of YOLOv8, the variants of YOLOv8. Following the information about the experiment setup and the model training process has also been reported. Finally, delineate the evaluation metrics employed to compare the performance of trained models.
Table 2. Annotations in each class
|
Class |
Total Images |
Train Images |
Test Images |
Valid Images |
|
Tas_Var |
2837 |
2281 |
281 |
265 |
|
Normal |
124 |
99 |
14 |
11 |
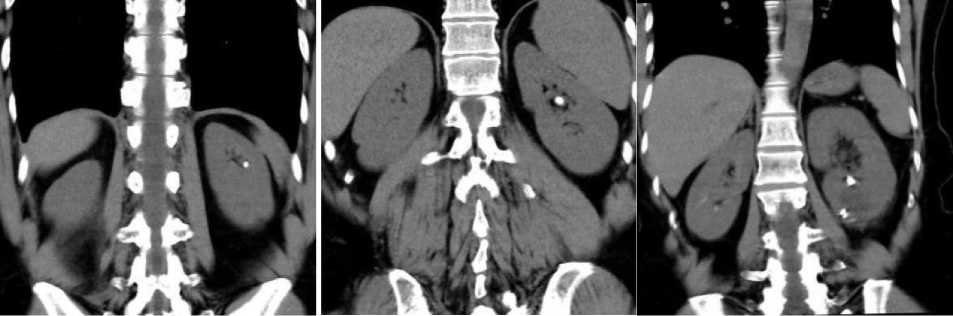
Fig.1. Sample CT-Scan images from the dataset [36]
YOLOv8 [29], the latest version released by Ultralytics [37] in January 2023, boasts higher accuracy and faster speed, exemplified by the YOLOv8 (medium) model achieving a 50.2 mAP score at 1.83 milliseconds on the COCO dataset which has 80 classes, using A100 TensorRT. Although it lacks an official paper, YOLOv8 features a Python package and CLI-based implementation, enhancing ease of use and development. This versatile model can perform tasks such as detection, segmentation, classification, pose estimation, and oriented bounding boxes (OBB). The research focuses on detection using YOLOv8, which is equipped with advanced backbone and neck architectures for superior feature extraction and object detection performance. The model's anchor-free split Ultralytics head improves accuracy and efficiency, and its optimized accuracy-speed trade-off makes it ideal for real-time detection tasks. Additionally, YOLOv8 provides a variety of pre-trained models to suit different tasks and performance needs, simplifying the selection of an appropriate model for specific applications.
4.3. Versions of YOLOv8
4.4. Experiment Setup and Model Training
4.5. Evaluation Metrics
5. Result and Discussion
YOLOv8 [33] is available in five variants, each differing in the number of parameters: nano (n), small (s), medium (m), large (l), and extra-large (x). All these variants are suitable for detection tasks. Details such as the number of parameters and FLOPs for each variant are provided in Table 3. This research aims to experiment with all 5 YOLOv8 variants to determine the most suitable model that balances computational efficiency and detection accuracy. By comparing these variants across multiple performance metrices such as precision, mAP (mean Average Precision) and resource consumptions, the study aims to identify the optimal YOLOv8 variant for kidney stone detection, ensuring a robust combination of precision and efficiency.
The experiment was conducted using the Kaggle platform, leveraging a Tesla-P100 GPU with 16GB of VRAM to efficiently handle the computational demands of training YOLOv8 models. Study have used the Ultralytics 8.2.26 package to implement and train the models. Additionally, the research has utilized weights and biases tool for investigation of various evaluation and computational parameters.
Table 3. Comparison of version of YOLOv8
|
Model |
Speed (ms) |
Params (M) |
FLOPs (B) |
|
|
CPU ONNX |
A100 TensorRT |
|||
|
nano |
80.4 |
0.99 |
3.2 |
8.7 |
|
small |
128.4 |
1.20 |
11.2 |
28.6 |
|
medium |
234.7 |
1.83 |
25.9 |
78.9 |
|
large |
375.2 |
2.39 |
43.7 |
165.2 |
|
extra- large |
479.1 |
3.53 |
68.2 |
257.8 |
The model training process was carried out over 100 epochs, with a batch size of 16 to balance between training time and convergence stability. The research has utilized pre-trained weights for enhancing the initial performance and speeding up the convergence. The AdamW optimizer was employed, known for its ability to handle the complexities of training deep learning models. The learning rate was set to 0.001667, chosen to ensure gradual and stable convergence, while a momentum of 0.9 was used to accelerate the optimizer by dampening oscillations.
The models' accuracy, robustness, and generalization capabilities were assessed using standard evaluation metrics, encompassing precision, recall, f1-score, and mean Average Precision (mAP) at IoU thresholds of 0.5 (mAP@0.5). In addition to evaluation metrics, YOLOv8 variants also evaluated on the basis of GPU power usage in Watts, GPU memory allocated in bytes, Memory written on disk during training in mega-bytes, and total training time. These metrics facilitated a comprehensive evaluation of the models' detection performance.
This section presents the results of this study on kidney stone detection using various YOLOv8 models. The study provides a detailed evaluation of the models' performance through standard evaluation metrics, interpret the models' behaviour through graphical analysis, and identify the most computationally efficient model.
-
5.1. Performance Evaluation Using Evaluation Metrics
-
5.2. Model Interpretation Through Graphical Analysis
The comprehensive evaluation of the performance of each YOLOv8 variant model is presented in Table 4. It offers valuable insights into their capabilities in detecting kidney stones.
Table 4. Result of YOLOv8 versions
|
Model |
Class |
Precision |
Recall |
F1-score |
mAP@50 |
|
nano |
All |
0.896 |
0.861 |
0.878 |
0.897 |
|
Stone |
0.825 |
0.722 |
0.770 |
0.799 |
|
|
Normal |
0.967 |
1.000 |
0.983 |
0.995 |
|
|
small |
All |
0.917 |
0.889 |
0.903 |
0.918 |
|
Stone |
0.883 |
0.778 |
0.827 |
0.840 |
|
|
Normal |
0.952 |
1.000 |
0.975 |
0.995 |
|
|
medium |
All |
0.910 |
0.875 |
0.892 |
0.902 |
|
Stone |
0.870 |
0.751 |
0.806 |
0.808 |
|
|
Normal |
0.950 |
1.000 |
0.974 |
0.995 |
|
|
large |
All |
0.858 |
0.894 |
0.876 |
0.902 |
|
Stone |
0.841 |
0.790 |
0.815 |
0.817 |
|
|
Normal |
0.875 |
0.997 |
0.932 |
0.986 |
|
|
extra-large |
All |
0.917 |
0.85 |
0.915 |
0.904 |
|
Stone |
0.880 |
0.730 |
0.798 |
0.813 |
|
|
Normal |
0.954 |
1.000 |
0.976 |
0.995 |
A notable observation from the table is that both YOLOv8l and YOLOv8n exhibit performance below the threshold of 0.9 across all evaluated metrics (except mAP@50 in case of YOLOv8l), indicating areas for improvement in their detection capabilities. In contrast, YOLOv8m showcases commendable performance, achieving a precision of 0.910 and a mAP@50 of 0.902, demonstrating its effectiveness in detecting kidney stones.
However, among the models, YOLOv8e emerges as a strong competitor, closely rivalling YOLOv8s. Both models exhibit the highest precision of 0.917. While YOLOv8s achieves the highest mAP@50 of 0.918, YOLOv8e achieves the highest F1-score of 0.915. Notably, both models fall short in recall compared to YOLOv8l, with YOLOv8s slightly outperforming YOLOv8e with a recall value of 0.889.
These findings suggest that both YOLOv8s and YOLOv8e are equally efficient in kidney stone detection. However, to determine the best model for deployment, other factors such as computational requirements and real-world applicability need to be carefully considered.
This subsection provides a graphical interpretation of the models' performance to gain deeper insights into their detection capabilities. Figures 2, 3, 4 and 5 illustrate the performance evaluation curves. These graphs are essential for understanding the behaviour of the YOLOv8 models across different confidence thresholds and metrics.
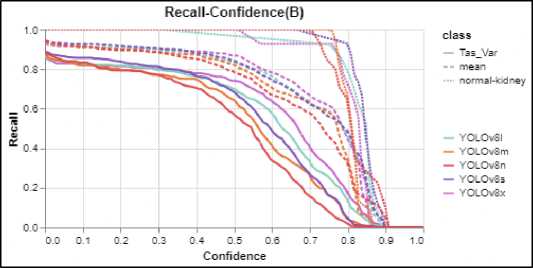
Fig.2. Recall confidence curve
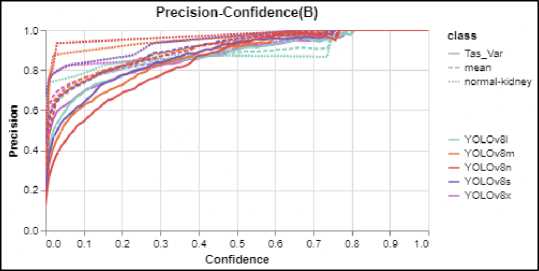
Fig.3. Precision confidence curve
Fig.4. F1 confidence curve
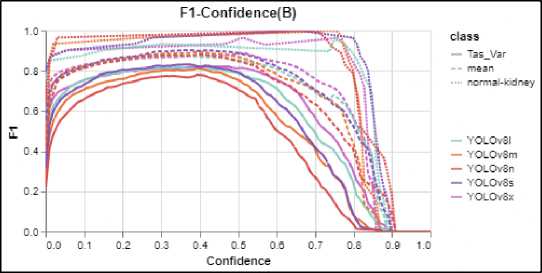
Figure 2 (Recall-Confidence curve) illustrates the model's ability to identify all positive instances, changes as the confidence threshold increases. Higher recall at lower confidence thresholds suggests the model captures more true positives but may also include false positives. In Figure 3, the curve for YOLOv8s exhibits a more optimal shape, closely approaching the ideal curve, indicating superior performance compared to the other models. Figure 2 (PrecisionConfidence curve) demonstrates the model's accuracy in identifying only relevant instances, is affected by increasing the confidence threshold. A higher precision at higher confidence thresholds means the model is more selective, reducing false positives while potentially missing some true positives. YOLOv8n seems to be better performing in the graph, approaching to ideal Precision-Confidence curve. Figure 4 (F1-Confidence curve) combines precision and recall into a single metric (F1-score), balancing the trade-off between the two. This curve helps assess the overall performance
of the models as the confidence threshold varies, offering a clearer picture of where the balance between precision and recall lies. In the curve, it can be seen that both YOLOv8s and YOLOv8l are performing better than other models showcased its efficiency in maintaining the trade-off between precision and recall. Figure 5 (Precision-Recall curve), on the other hand, provides insight into the interplay between precision and recall across all confidence thresholds, highlighting the model's ability to maintain high precision while maximizing recall. For the normal class all the models showcased almost near the ideal curve but when looking the other two curves (mean and Tas_Var), it is evident that YOLOv8s are performing better than other models.
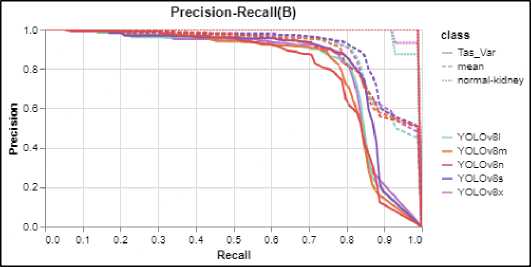
Fig.5. P-R curve
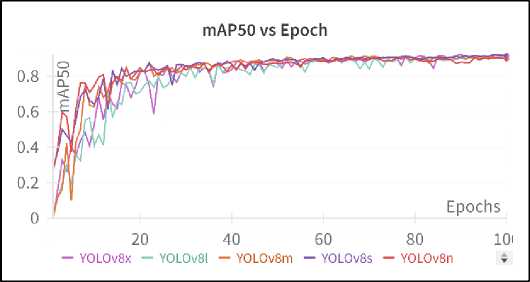
Fig.6. mAP50 vs epoch curve
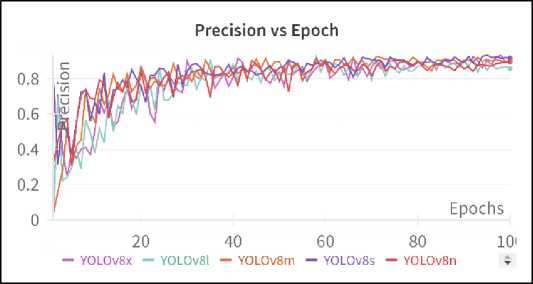
Fig.7. Precision vs epoch curve
Figures 6, 7, and 8 present the progression of mAP50, precision, and recall values across epochs during the training of the models, respectively, offering critical insights into the models' learning behaviour over time. Figure 6 (mAP50 vs Epoch curve) shows the mAP at an IoU threshold of 50% as it evolves throughout the training process. This curve provides a summary of overall model performance in terms of detection accuracy, indicating how well the models learn to balance precision and recall. Examining the curves, it can be seen that the YOLOv8s curve ends slightly higher than other model’s curve. Figure 7 (Precision vs Epoch curve) tracks the change in precision across epochs, indicating how the models improve in terms of reducing false positives as training progresses. Precision helps in understanding the ability of the model to make correct detections without sacrificing specificity. YOLOv8s stands out here by achieving the highest precision by the end of the training, indicating that it consistently makes fewer false-positive detections. Figure 8 (Recall vs Epoch curve) provides a view of how recall improves with each epoch, highlighting the model’s ability to detect true positives over time. A higher recall throughout training reflects the model’s strength in capturing relevant detections, although it may also result in more false positives at certain points.
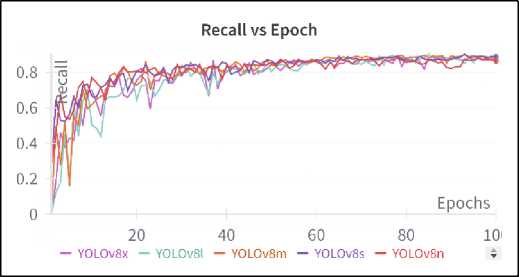
Fig.8. Recall vs epoch curve
Interestingly, despite initial differences, all models show convergence in performance by the end of training, reaching similar mAP, precision, and recall values. However, the Precision vs Epoch curve reveals that YOLOv8s achieves the highest precision, surpassing the other models, while YOLOv8l performs slightly lower in terms of precision compared to the other variants. These observations provide valuable insights into how the models progress and stabilize during training, helping guide model selection and optimization strategies based on the desired trade-offs between precision, recall, and overall accuracy.
-
5.3. Identification of Computationally Efficient Model
Table 5 encompasses the total and per-epoch training time for each model. It is evident that the extra-large model required significantly more time to train compared to the nano model, approximately seven times longer. This discrepancy is expected due to the extra-large model's complex architecture and exponentially larger number of parameters.
Table 5. Time taken by models to train for 100 epochs
|
Model |
Total Time (min) |
Time/Epoch (minute: second) |
|
nano |
69 |
0:42 |
|
small |
110 |
1:50 |
|
medium |
222 |
2:14 |
|
large |
333 |
3:20 |
|
extra-large |
480 |
4:48 |
Evaluation of computationally efficient algorithms must not solely be based on the training time; it can be misleading as other external factors can be influential. Factors such as memory usage and power consumption also play critical roles in the real-world scenario. Therefore, a comprehensive analysis considering multiple factors is essential for making informed decisions regarding model selection and deployment strategies.
Figure 9 illustrates the power consumption of GPUs during training across YOLOv8 models. YOLOv8n notably consumes the least power at an average of 120W, while YOLOv8x exhibits the highest consumption at 190W due to its extensive architecture. YOLOv8s stands out with commendable performance, averaging 150W during training, showcasing efficiency. YOLOv8l and YOLOv8m demonstrate slightly lower power usage compared to YOLOV8x, around 180W. This analysis emphasizes the importance of considering power consumption alongside other metrics for model selection and deployment.
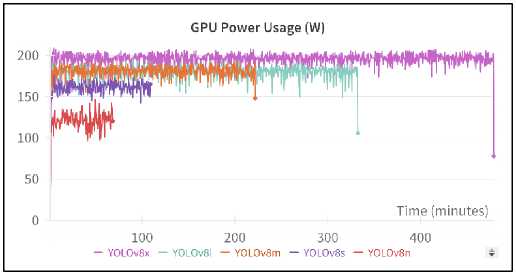
Fig.9. GPU power usage in watt throughout the training
Figures 10 and 11 illustrate the GPU and disk memory allocation throughout the training process. These parameters are crucial as they define the computational expense of the models and the necessary memory requirements for running these models. The graphical representation clearly shows that YOLOv8x is the most computationally expensive, requiring 13.6 billion bytes of GPU memory. In contrast, YOLOv8n is much less demanding, needing only 2.86 billion bytes of GPU memory.
Regarding disk memory requirements, it is directly proportional to the training duration. YOLOv8x, being the most resource-intensive, requires almost 100,000 megabytes, while YOLOv8n needs about 4,500 megabytes—22 times less. The other models, such as YOLOv8s, YOLOv8m, and YOLOv8l, have memory usage that falls between the extremes of YOLOv8n and YOLOv8x. This indicates a balanced computational expense and memory requirement for these models, making them potentially more suitable for practical applications where resources are limited.
GPU Memory Allocated (Bytes)
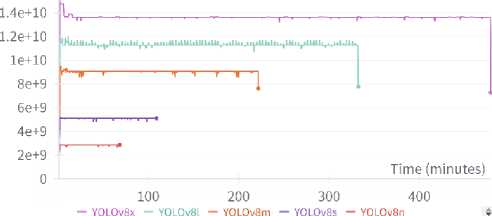
Fig.10. GPU memory allocated in bytes throughout training
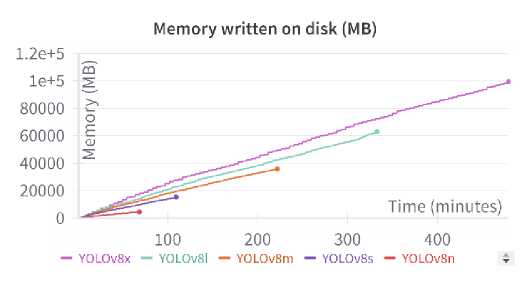
Fig.11. Memory written on disk throughout the training
These findings reveal that each model exhibits distinct characteristics: some excel in evaluation metrics, while others are more computationally efficient, requiring significantly less memory for training. This comprehensive analysis enables us to draw a nuanced conclusion, identifying the optimal model that strikes a balance between computational efficiency and robust evaluation metrics. The synthesis of these insights will guide the selection of a model that is not only resource-efficient but also demonstrates superior performance in detecting kidney stones.
Table 6. Comparison with previous researched
|
Reference |
Authors |
Employed Methodology |
Evaluation Metrics |
|
[38] |
M. Gulane et al. (2024) |
Improved Deep Neural Network |
Accuracy = 90% Recall = 90% F1-Score = 89.5% Precision = 89% |
|
[39] |
Tsitsiflis et al. (2022) |
ANN |
Accuracy = 81.43% |
|
[40] |
D. C. Elotn at al. (2022) |
Deep Learning |
Sensitivity = 86% |
|
[41] |
S. Rabby e t al. (2023) |
YOLO |
IOU = 91.4% |
|
[42] |
A. F. Bayram et al. (2022) |
YOLOv7 |
mAP@50 = 85% precision = 88.2% sensitivity = 82.9% F1 score = 85.4% |
|
Proposed |
YOLOV8s |
Precision = 91.7% Recall = 88.9% F1-Score = 90.3% mAP@50 = 91.8% |
5.4. Comparison with Previous Research on Kidney Stone Detection
6. Conclusions
This section presents a comparative analysis of the proposed methodology against previous works. It highlights how the current study addresses the limitations and weaknesses of earlier approaches, as well as the challenges associated with real-world kidney detection. Table 6 presents the comprehensive table of existing research on kidney stone detection. The table encompasses the methodology employed by the research and their presented results.
The study addresses the critical balance between computational efficiency and detection accuracy in kidney stone detection. Rather than solely pursuing the most accurate model or the least computationally expensive one, the research’s aim is to identify a model that strikes a balance between these two aspects. Throughout the investigation, the study can conclude the following:
-
• The research observed that YOLOv8s and YOLOv8x exhibit outstanding performance across evaluation
metrics.
-
• YOLOv8x is significantly more computationally expensive than YOLOv8s in terms of disk space, GPU
utilization, and power usage.
-
• Study recommend YOLOv8s as the optimal model, effectively balancing computational efficiency and
performance evaluation.
-
• The experiment showcased that YOLOv8 achieved the highest metrices values of precision (0.917) and
mAP@50 (0.918).
• Moreover, YOLOv8s demonstrates efficient resource utilization, requiring only 150W for training, 5 billion bytes of GPU memory, and 150,000 megabytes of disk space.
• This research highlights the importance of considering both computational efficiency and performance metrics when selecting a model for kidney stone detection.
7. Future Scope
These characteristics position YOLOv8s as the top performer among all YOLOv8 variants. This research highlights the importance of considering both computational efficiency and performance metrics when selecting a model for kidney stone detection. YOLOv8s emerges as the optimal choice, offering exceptional accuracy while minimizing computational resource requirements.
The future scope of this research includes investigating other YOLO models to compare their performance and effectiveness in detecting kidney stones. Additionally, testing the trained models on real-world datasets will be crucial to validate their robustness and applicability in practical medical settings as a CAD tool. Furthermore, validating the trained models on real-world datasets will be essential to ensure their robustness and practical applicability in medical settings. Expanding the focus to include the detection of other urological conditions could further enhance the models' clinical utility and improve overall patient outcomes.
