Optimum ECG signal filtering based on wavelet transformation

Free access
The development of digital signal processing and microprocessor technology creates conditions for improving methods for diagnosing the functional state of organs. Wavelet analysis is a modern and promising method of information processing. In order to determine the effective optimal filtering of the electrocardiography signal based on the wavelet transform, wavelet filtering was performed using wavelets of different families, the efficiency of using different levels of decomposition, methods for calculating the threshold and types of the threshold function was investigated. Aim. Determination of effective optimal filtering of electrocardiography signal based on wavelet transform. Materials and methods. Cardiograms were taken for analysis. Then they were digitized and entered into a computer for processing. A program was written in the Matlab environment that implements continuous and discrete wavelet transform. Results. As a result of the research, 56 combinations of noise reduction parameters were tested for three noise levels. It was found that the maximum degree of signal purification from noise was obtained using the Coiflets 5 wavelet using a rigid thresholding method, with a heuristic method for calculating the threshold value. Wavelet Simlet 8 has lower correlation coefficient values than Coiflets 5, at 35 dB the best result is 97%, the noise level is 40 dB the best result is 98.7%, the noise level is 45 dB the best result is 99.3%, which is generally negligible differs from the correlation coefficients of the wavelet Coiflets 5. Conclusion. As a result of the study, the first and the present work, the following conclusions were made: the optimal level of the wavelet decomposition of the ECG signal N = 2; the maximum degree of signal cleaning from noise was obtained using the Coiflets 5 wavelet using a rigid thresholding method, with a heuristic method for calculating the threshold value; Simlet 8 wavelet using a soft thresholding method with a minimax thresholding method also shows noteworthy results, slightly inferior to Coiflets 5 wavelet results.
Ecg signal, wavelet simlet 8, wavelet coiflets 5, thresholding method, optimal level
Short address: https://sciup.org/147236497
IDR: 147236497 | UDC: 53.08 | DOI: 10.14529/ctcr210415
Оптимальная фильтрация сигнала ЭКГ на основе вейвлет-преобразования
Развитие средств цифровой обработки сигналов и микропроцессорной техники создают условия для совершенствования методов диагностики функционального состояния органов. Вейвлетный анализ - это современный и перспективный метод обработки информации. С целью определения эффективных оптимальных фильтраций сигнала электрокардиографии на основе вейвлет-преобразования в работе была произведена вейвлет-фильтрация с использованием вейвлетов разных семейств, исследована эффективность применения различных уровней разложения, способов расчета порога и видов пороговой функции. Цель исследования: определение эффективных оптимальных фильтраций сигнала электрокардиографии на основе вейвлет-преобразования. Материалы и методы. Для анализа были взяты кардиограммы. Далее они были оцифрованы и введены в компьютер для обработки. Была написана программа в среде MATLAB, реализующая непрерывное и дискретное вейвлет-преобразование. Результаты. В результате исследования были протестированы 56 комбинаций параметров шумоподавления для трех уровней шума. Было выявлено, что максимальная степень очистки сигнала от шума была получена с использованием вейвлета Койфлета 5 с использованием жесткого метода пороговой обработки, с эвристическим способом расчета порогового значения. Вейвлет Симмлета 8 имеет меньшие значения коэффициента корреляции, чем Койфлет 5, на уровне шума 35 дБ наилучший результат 97 %, на уровне шума 40 дБ наилучший результат 98,7 %, на уровне шума 45 дБ наилучший результат 99,3 %, что в целом незначительно отличается от коэффициентов корреляции вейвлет Койфлета 5. Заключение. В результате исследования были сделаны следующие выводы: оптимальный уровень вейвлет разложения ЭКГ сигнала N = 2; максимальная степень очистки сигнала от шума была получена с использованием вейвлет Койфлета 5 с использованием жесткого метода пороговой обработки, с эвристическим способом расчета порогового значения; вейвлет Симмлета 8 с использованием мягкого метода пороговой обработки, с минимаксным способом расчета порогового значения также показывает достойные упоминания результаты, незначительно уступающие результатам вейвлета Койфлета 5.
Text of the brief report Optimum ECG signal filtering based on wavelet transformation
The development of means of digital signal processing and microprocessor technology create conditions for improving methods for diagnosing the functional state of organs [1–3]. Wavelet analysis is a modern and promising method of information processing. The wavelet analysis apparatus was developed in the early 1980 [4–6]. The results obtained in various fields using wavelet analysis have increased interest in this area and contribute to its continuous development [7–9].
Wavelet analysis can be successfully used to smooth and remove noise in the ECG signal. The cardio signal stripped of noise components, looks clearer, while its volume is from 10% to 5% of the original signal, which largely solves the problem of storing cardiac records [10–12].
To implement the procedure for the wavelet filtering of the CS, the method of threshold processing of the coefficients was chosen. In the course of the work, an algorithm for the wavelet filtering of the CS by the thresholding method was developed and implemented. There is a wide choice of wavelet bases used for filtering signals by the thresholding method, the choice of the wavelet function and noise reduction parameters, such as the type of threshold, the level of decomposition, etc., plays a decisive role in the operation of the method [13–15].
In order to determine the effective optimal filtering of the electrocardiography signal based on the wavelet transform, wavelet filtering was performed using wavelets of different families, the efficiency of using different levels of decomposition, methods for calculating the threshold and types of the threshold function was investigated.
Determination of the effective filter parameters
Let us determine the signal-to-noise ratio and the correlation coefficient for each set of parameters for the selected decomposition level N = 2.
Let's test 7 selected types of wavelet functions: Haar wavelet; Daubechies wavelet 4; Daubechies wavelet 6; Coiflets wavelet 5; wavelet Simlet 4; wavelet Simlet 6; wavelet Simlet 8.
For each type of wavelet, we use a hard or soft thresholding method. Let us calculate the threshold value by each of the four methods for calculating the threshold: adaptive, heuristic, logarithmic and minimax calculation method.
Thus, for the study, it is necessary to enumerate 56 variants of possible combinations of noise reduction parameters for each noise level.
The calculated data are presented in Tables 1, 2, each cell contains data for three noise levels SNR 1 = 35, SNR 2 = 40, SNR 3 = 45.
Consider the signal-to-noise ratio for all combinations of parameters; the calculation results are shown in Table 1.
Table 1
Signal-to-noise ratios for all combinations of parameters
|
Parameters |
Soft method |
Hard method |
||||||
|
rigrsure |
sqtwolog |
minimaxi |
heursure |
rigrsure |
sqtwolog |
minimaxi |
heursure |
|
|
36.740 |
36.805 |
36.829 |
36.880 |
36.770 |
36.695 |
36.697 |
36.668 |
|
|
Haar |
38.150 |
38.078 |
38.107 |
38.15 |
38.112 |
38.146 |
38.092 |
38.094 |
|
38.620 |
38.619 |
38.638 |
38.64 |
38.634 |
38.626 |
38.642 |
38.621 |
|
|
39.994 |
39.886 |
40.166 |
40.028 |
39.552 |
39.881 |
39.586 |
39.796 |
|
|
Simlet 4 |
43.372 |
42.971 |
43.47 |
43.223 |
43.115 |
43.258 |
43.298 |
43.137 |
|
45.246 |
45.278 |
45.224 |
45.276 |
45.17 |
45.171 |
45.306 |
45.181 |
|
|
39.964 |
39.716 |
39.836 |
39.669 |
39.614 |
39.505 |
39.877 |
39.673 |
|
|
Simlet 6 |
42.846 |
42.950 |
42.999 |
43.015 |
42.811 |
43.055 |
43.236 |
43.002 |
|
44.643 |
44.733 |
44.755 |
44.603 |
44.734 |
44.657 |
44.681 |
44.683 |
|
|
40.512 |
40.530 |
40.517 |
40.440 |
40.382 |
40.248 |
40.48 |
40.535 |
|
|
Simlet 8 |
44.033 |
44.264 |
43.906 |
44.23 |
44.149 |
43.838 |
44.054 |
43.946 |
|
46.427 |
46.535 |
46.502 |
46.544 |
46.613 |
46.363 |
46.456 |
46.458 |
|
|
39.958 |
40.079 |
40.058 |
39.994 |
39.751 |
40.273 |
40.021 |
40.16 |
|
|
Daubechies 4 |
43.430 |
43.400 |
43.446 |
43.616 |
43.273 |
43.582 |
43.222 |
43.237 |
|
45.306 |
45.083 |
45.320 |
45.309 |
45.435 |
45.268 |
45.335 |
45.225 |
|
|
39.619 |
39.446 |
39.643 |
39.804 |
39.957 |
40.135 |
40.039 |
39.904 |
|
|
Daubechies 6 |
43.031 |
42.978 |
43.194 |
43.108 |
43.153 |
43.005 |
43.237 |
42.821 |
|
45.057 |
44.874 |
44.871 |
44.937 |
44.961 |
44.893 |
44.934 |
44.970 |
|
|
40.575 |
40.102 |
40.001 |
40.440 |
40.525 |
40.279 |
40.290 |
40.770 |
|
|
Coiflets 5 |
43.865 |
43.634 |
44.022 |
43.764 |
44.192 |
44.025 |
44.236 |
44.404 |
|
46.828 |
46.975 |
46.697 |
46.811 |
46.832 |
46.642 |
46.655 |
46.863 |
|
As a result of the analysis of the obtained data on the signal-to-noise ratios of all combinations of parameters, it was revealed:
-
– the least effective wavelet for filtering ECG signals is the Haar wavelet;
-
– the most optimal wavelet from the Simlet family – Simlet 8;
-
– Daubechies 4 wavelet has a higher signal-to-noise ratio for all noise levels than Daubechies 6 wavelet;
-
– Simlet 8 and Coiflets 5 wavelets have the highest signal-to-noise ratios among the considered wavelets.
Consider the correlation coefficients for all combinations of parameters, the calculation results are shown in Table 2.
Table 2
Correlation coefficients for all combinations of parameters
|
Parameters |
Soft method |
Hard method |
||||||
|
rigrsure |
sqtwolog |
minimaxi |
heursure |
rigrsure |
sqtwolog |
minimaxi |
heursure |
|
|
92.4 |
92.5 |
92.6 |
92.5 |
92.5 |
92.3 |
92.4 |
92.4 |
|
|
Haar |
94.5 |
94.4 |
94.4 |
94.5 |
94.4 |
94.5 |
94.4 |
94.4 |
|
95.0 |
95.0 |
95.1 |
95.1 |
95.1 |
95 |
95.1 |
95 |
|
|
96.5 |
96.4 |
96.6 |
96.6 |
96.2 |
96.5 |
96.2 |
96.4 |
|
|
Simlet 4 |
98.4 |
98.3 |
98.4 |
98.4 |
98.3 |
98.3 |
98.4 |
98.3 |
|
98.9 |
99 |
98.9 |
99.0 |
98.9 |
98.9 |
99.0 |
98.9 |
|
|
96.5 |
96.4 |
96.5 |
96.3 |
96.3 |
96.2 |
96.3 |
96.3 |
|
|
Simlet 6 |
98.2 |
98.2 |
98.3 |
98.2 |
98.2 |
98.2 |
98.3 |
98.3 |
|
98.8 |
98.8 |
98.8 |
98.8 |
98.8 |
98.8 |
98.8 |
98.8 |
|
|
97.0 |
96.8 |
97.0 |
96.9 |
96.9 |
96.7 |
96.9 |
97 |
|
|
Simlet 8 |
98.6 |
98.7 |
98.6 |
98.7 |
98.7 |
98.5 |
98.6 |
98.6 |
|
99.2 |
99.2 |
99.2 |
99.2 |
99.2 |
99.2 |
99.2 |
99.2 |
|
|
96.5 |
96.6 |
96.6 |
96.6 |
96.3 |
96.8 |
96.6 |
96.7 |
|
|
Daubechies 4 |
98.4 |
98.4 |
98.4 |
98.5 |
98.3 |
98.4 |
98.3 |
98.3 |
|
99.0 |
98.9 |
99.0 |
99.0 |
99.0 |
98.9 |
99.0 |
98.9 |
|
|
96.3 |
96.1 |
96.3 |
96.5 |
96.4 |
96.7 |
96.7 |
96.5 |
|
|
Daubechies 6 |
98.3 |
98.2 |
98.3 |
98.3 |
98.3 |
98.2 |
98.3 |
98.1 |
|
98.9 |
98.8 |
98.8 |
98.9 |
98.9 |
98.9 |
98.9 |
98.9 |
|
|
97.0 |
96.6 |
96.5 |
96.9 |
96.9 |
96.7 |
96.8 |
97.2 |
|
|
Coiflets 5 |
98.6 |
98.6 |
98.6 |
98.5 |
98 |
98.6 |
98.7 |
98.7 |
|
99.3 |
99.3 |
99.2 |
99.3 |
99.3 |
99.2 |
99.2 |
99.3 |
|
As a result of the analysis of the obtained data on the correlation coefficients for all combinations of parameters, it was revealed:
-
– filtering using the Haar wavelet showed the worst results;
-
– the most optimal wavelet from the Simlet family – Simlet 8;
-
– Daubechies 4 wavelet at all noise levels has better correlation coefficients than Daubechies 6;
-
– The highest correlation coefficients were obtained as a result of filtering with Simlet 8 and Coiflets 5 wavelets.
After considering and generalizing the conclusions made on the calculated signal-to-noise ratios and correlation coefficients, two wavelets that filter the ECG signal most effectively were identified: Simlet 8 and Coiflets 5.
To visualize the collected data and identify the optimal set of parameters for each of the two identified wavelets, a graphical data analysis program was written. Figs. 1, 2 show the result of the graphical data analysis program.
-
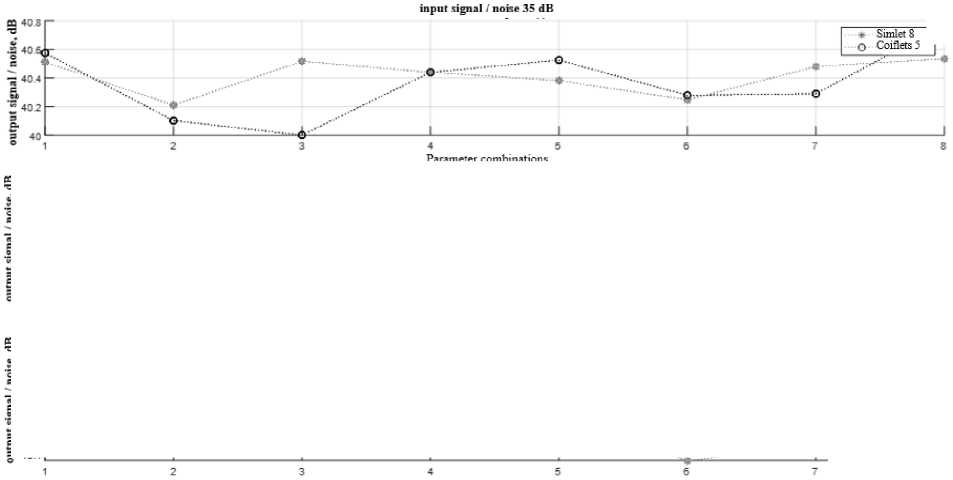
F ig. 1 shows a comparison of the output signal-to-noise ratios of Simlet 8 and Coiflets 5 wavelets for eight combinations of parameters presented in Table 1. The figure shows three graphs for three noise levels SNR 1 = 35, SNR 2 = 40, SNR 3 = 45.
-
F ig. 2 shows a comparison of the correlation coefficients of the Simlet 8 and Coiflets 5 wavelets for eight combinations of parameter parameters presented in Table 2. The figure shows three graphs for three noise levels SNR 1 = 35, SNR 2 = 40, SNR 3 = 45.
As a result of the graphical analysis of the collected data, it was revealed:
-
– The highest output signal-to-noise ratio for all considered noise levels has the Coiflets wavelet 5 using a rigid thresholding method, with a heuristic method for calculating the threshold value;
-
– for most sets of parameters the values of the signal-to-noise ratio of the wavelet Coiflets 5 exceed the values of the signal-to-noise ratio of the wavelet Simlet 8, which is especially clearly seen for the input noise level of 45 dB;
-
– The largest values of the correlation coefficient for all considered noise levels (97.2%, 98.7%, 99.3%) have the Coiflets 5 wavelet using a rigid thresholding method, with a heuristic method for calculating the threshold value;
-
– Simlet 8 wavelet has lower correlation coefficient values than Coiflets 5, at a noise level of 35 dB the best result is 97%, a noise level of 40 dB is the best result 98.7%, a noise level of 45 dB is the best result 99.3%, which, in general, slightly different from the correlation coefficients of the wavelet Coiflets 5;
-
– Simlet 8 wavelet shows good filtering results using soft thresholding method, with minimax thresholding method.
Parameter combinations
Fig. 1. Comparison of the output signal-to-noise ratios of Simlet 8 and Coiflets 5 wavelets for eight combinations of parameters
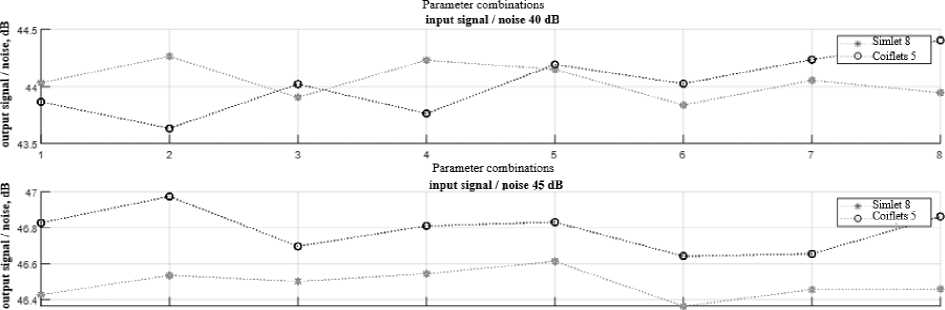

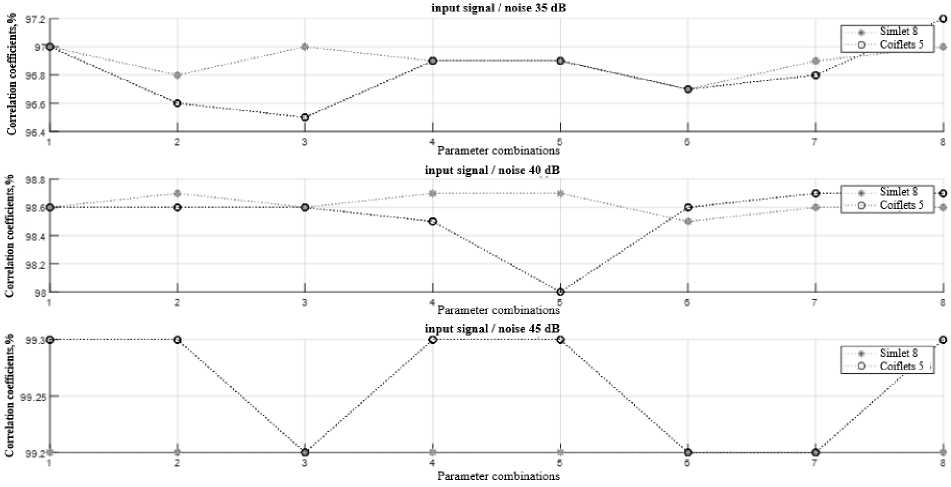
Fig. 2. Comparison of the correlation coefficients of wavelets Simlet 8 and Coiflets 5 for eight combinations of parameters
As a result of the research, 56 combinations of noise reduction parameters were tested for three noise levels. It was found that the maximum degree of signal purification from noise was obtained using the Coiflets 5 wavelet using a rigid thresholding method, with a heuristic method for calculating the threshold value.
Conclusion
As a result of the study, the following conclusions were made: optimal level of wavelet decomposition of ECG signal N = 2; the maximum degree of signal purification from noise was obtained using Coiflets 5 wavelet using a rigid thresholding method, with a heuristic method for calculating the threshold value; Simlet 8 wavelet using a soft thresholding method, with a minimax thresholding method, also shows noteworthy results, slightly inferior to the Coiflets 5 wavelet results.
References Optimum ECG signal filtering based on wavelet transformation
- Bohan C., Hongliu, Y. ECG Signal Processing and Human State Detection Based on Wearable Electrodes. Journal of Physics: Conference Series, 2021, pp. 1-8. DOI: 10.1088/1742-6596/1952/3/032055
- Saidov B., Telezhkin V. Transformation of the Amplitude-Modulated Spectrum of a Signal on a Nonlinear Element. 2020 International Russian Automation Conference (RusAutoCon), 2020, pp. 757-761. DOI: 10.1109/RusAutoCon49822.2020.9208134
- Phinyomark A., Limsakul C., Phukpattaranont P. An Optimal Wavelet Function Based on Wavelet Denoising for Multifunction Myoelectric Control. 6th International Conference on Electrical Engineering/Electronics, Computer, Telecommunications and Information Technology (ECTI-CON 2009), Thailand, 2009, vol. 2, pp. 1098-1110. DOI: 10.1109/ECTIC0N.2009.5137236
- Burhan E. Signal and Image Denoising Using Wavelet Transform. Advances in Wavelet Theory and Their Applications in Engineering, Physics and Technology, 2012, pp. 495-514. DOI: 10.5772/36434
- Singh B.N., Tiwari A.K. Optimal Selection of Wavelet Basis Function Applied to ECG Signal Denoising. Digital Signal Processing, 2006, vol. 16 (3), pp. 275-287. DOI: 10.1016/j.dsp.2005.12.003
- Bagheri F., Ghafarnia N., Bahrami F. Electrocardiogram (ECG) Signal Modeling and Noise Reduction Using Hopfield Neural Networks. Eng. Technol. Appl. Sci. Res., 2013, vol. 3, no. 1, pp. 345-348. DOI: 10.48084/etasr.243
- Sameni R., Shamsollahi M.B., Jutten C., Babaie-Zadeh M. Filtering noisy ECG signals using the extended kalman filter based on a modified dynamic ECG model. Computers in Cardiology, 2005, pp. 1017-1020. DOI: 10.1109/CIC.2005.1588283
- Shemi P.M., Shareena E.M. Analysis of ECG signal denoising using discrete wavelet transform. 2016 IEEE International Conference on Engineering and Technology(ICETECH), 2016, pp. 713-718, DOI: 10.1109/ICETECH.2016.7569341
- Chouakri S.A., Bereksi-Reguig F., Ahmaïdi S., Fokapu O. Wavelet Denoising of the Electrocardiogram Signal Based on the Corrupted Noise Estimation. Computers in Cardiology, 2005, pp. 1021-1024. DOI: 10.1109/CIC.2005.1588284
- Telezhkin V., Saidov B. Integrated Information Processing in Wireless (Secure) Communications of Corporate Communication Systems. 2020 International Multi-Conference on Industrial Engineering and Modern Technologies (FarEastCon), 2020, pp. 1-5. DOI: 10.1109/FarEastCon50210.2020.9271417
- Sameni R., Shamsollahi M.B., Jutten C., Clifford G.D. A Nonlinear Bayesian Filtering Framework for ECG Denoising. IEEE Transactions on Biomedical Engineering, 2007, vol. 54, no. 12, pp. 2172-2185. DOI: 10.1109/TBME.2007.897817
- Mishu M.M.H., Hossain A.B.M.A., Emon M.E.A. Denoising of ECG signals using dual tree complex wavelet transform. 2014 17th International Conference on Computer and Information Technology (ICCIT), 2014, pp. 379-382. DOI: 10.1109/ICCITechn.2014.7073141
- Aowlad Hossain A.B.M., Haque M.A. Analysis of Noise Sensitivity of Different ECG Detection Algorithms. International Journal of Electrical and Computer Engineering (IJECE), 2013, vol. 3, no. 3, pp. 307-316. DOI: 10.11591/ijece.v3i3.2516
- Omid S., Mohammad B.Sh. ECG Denoising and Compression Using a Modified Extended Kalman Filter Structure. IEEE transactions on biomedical engineering, 2008, vol. 55, no. 9, pp. 22402248. DOI: 10.1109/TBME.2008.921150
- Telezhkin V., Saidov B., Ragozin A. Recognition and Elimination of Anomalies in Information Leakage Channels in Opto-Ultrasonic Communication Channels in Data Streams of Industrial Automated Systems. 2021 International Russian Automation Conference (RusAutoCon), 2021, pp. 201-206. DOI: 10.1109/RusAutoCon52004.2021.9537495
