Особенности распределения сейсмической активности в разных регионах Земли по фазам 11-летнего солнечного цикла

Автор: Ружич В.В., Левина Е.А.
Журнал: Солнечно-земная физика @solnechno-zemnaya-fizika
Статья в выпуске: 1 т.6, 2020 года.
Бесплатный доступ
Обсуждается связь солнечной активности с сейсмичностью Земли и причины расхождений в результатах исследований разных авторов. С использованием метода наложения эпох анализируются различия в распределении сейсмической активности по фазам 11-летнего солнечного цикла для всей планеты, полушарий, секторов, широтных поясов и отдельных регионов. Показано, что главный вклад в планетарное распределение сейсмической активности по фазам 11-летнего солнечного цикла вносит северо-восточный сектор Земли. Выявлена закономерность в распределении сейсмической активности по широтным поясам: главные максимумы сейсмической активности с увеличением широты приходятся на все более поздние фазы солнечного цикла в обоих полушариях. Для отдельных регионов результаты могут отличаться от результатов для Земли в целом из-за влияния местных геодинамических условий при деструкции земной коры. В средних широтах наблюдается смещение максимума количества землетрясений на более поздние фазы солнечного цикла в направлении с запада на восток, чего не обнаружено для северных регионов. Обсуждаются возможные причины разнообразных проявлений солнечно-земных связей для разных регионов с учетом различий в их строении и режимах геодинамического развития. Наличие ярко выраженных максимумов распределения сейсмической активности по фазам 11-летнего солнечного цикла позволяет их использовать для уточнения параметра «время» при среднесрочном прогнозе опасных землетрясений.
Периодичность в сейсмическом режиме, солнечная активность, дрейф ядра земли, асимметрия полушарий, солнечно-земные связи, геодинамика, факторы внеземных воздействий, среднесрочный прогноз землетрясений
Короткий адрес: https://sciup.org/142224282
IDR: 142224282 | УДК: 550.34, | DOI: 10.12737/szf-61202011
Features of distribution of seismic activity in different regions of Earth over phases of the 11-year solar cycle
We discuss the relationship of solar activity with the seismicity of Earth and reasons for the differences in the results of studies of various authors. Using the epoch superposition method, we analyze the differences in seismic activity distribution over phases of the 11-year solar cycle for the whole world, hemispheres, sectors, latitudinal belts, and individual regions. The northeastern sector of Earth has been shown to make the main contribution to the planetary distribution of seismic activity over phases of the 11-year solar cycle. We have revealed a pattern in the distribution of seismic activity over latitudinal belts: the solar cycle phases, at which the main maximum of seismic activity occurs, increase with increasing latitude in both hemispheres. For some regions, the results may differ from the generalized results for Earth due to the influence of local geodynamic conditions during the destruction of the earth's crust. In middle latitudes, the maximum number of earthquakes is shifted to the later phases of the solar cycle from west to east, which was not found for the northern regions...
Текст научной статьи Особенности распределения сейсмической активности в разных регионах Земли по фазам 11-летнего солнечного цикла
In recent decades, a question about the possible relation between Earth’s seismicity and the 11-year solar cycle has been actively addressed [Lyubushin et al., 1998; Levin, 2006; Sidorenkov, 2009; Tyapkin, 2012] . Periodicities in the seismic regime of the Baikal Rift Zone (BRZ) have been observed by many researchers, and several harmonics including the 11-year one have been identified [Lyubushin et al., 1998; Dyad’kov, 2002; Levin, 2006; Levina, Ruzhich, 2010, 2016; Levina, Ru-zhich, 2015; Ruzhich et al., 2018] . The most pronounced 11-year periodicity in the seismic regime of different regions of Earth is often attributed to the influence of changes in the level of solar activity. There is, however, an opinion about the absence of such a relation [Chipizubov, 2018]. There is no consensus of opinion on the distribution of seismic activity over solar cycle phases either. Below we discuss the causes of these differences and the possible nature of the 11-year periodicity. The solar cycle is known to last from 7 to 13 years, and it is asymmetric: the ascending branch (increasing Wolf numbers) is generally shorter than the descending one; hence, the choice of the reference point becomes significant. This paper shows the difference in the distribution of seismic activity over phases of the 11-year solar cycle for the entire planet, hemispheres, sectors, latitudinal belts, and individual regions. We focus on the analysis of additional information about cosmogenic factors affecting geodynamic processes, including seismotectonic destruction in the earth’s crust.
COMPUTING METHOD AND INITIAL DATA
The epoch superposition method has been adopted: to determine the statistical relationship between two processes, corresponding series are first smoothed using the same time window, then it is calculated which phases of one process exhibit maximum values of parameters of another process, which are summed over a long period of time. For the calculations, we have used the catalog of earthquakes for the observation period from 1964 to 2018 with a magnitude M≥5.0 [Northern California Earthquake Data Center, ] and the catalog of earthquakes in BRZ, provided by the Baikal Branch of the Geophysical Center of the Siberian Branch of the Russian Academy of Sciences (Irkutsk) []. As characteristics of seismic activity we considered series of the number of earthquakes and the total released seismic energy. To eliminate the effect of the annual cycle of Earth’s revolution around the Sun, the series were smoothed using a time window of one year. Solar activity was described using Wolf numbers for the period from 1964 to 2018 and yearly average ones. We took the minimum moment of this parameter as the beginning of the cycle. The period considered contains five solar cycles of different duration (12, 10, 10, 13, 11 years). The average solar cycle duration is 11.2 years, therefore the smoothed series of Wolf numbers was approximated by the 11-year harmonic whose minimum
This is an open access article under the CC BY-NC-ND license was taken as the beginning of the next solar cycle. Next, for each earthquake we determined to which year of cycle it belonged. The number of events and their energy for the corresponding years were summed over all the five cycles.
CALCULATION RESULTS
The distribution of earthquakes and released seismic energy over phases of the 11-year solar cycle for the entire planet, Northern and Southern hemispheres is shown in Figure 1. We can see that for entire Earth the distribution of the released seismic energy (Figure 1, b ) has two maxima: in the first and seventh years of the solar cycle; and the distribution of the number of earthquakes (Figure 1, a ) has only one maximum, in the seventh year. Noteworthy is that the graphs for the Northern Hemisphere are virtually similar to those for Earth as a whole. As for the Southern Hemisphere, the main difference lies in the fact that the maximum of the released seismic energy occurs about one year earlier.
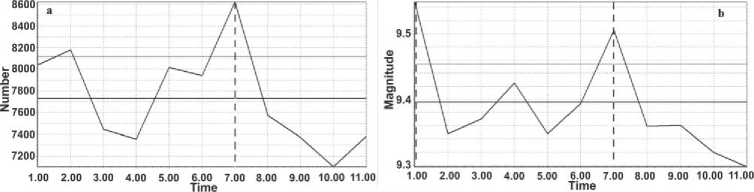
Let us now analyze the distribution of seismic activity over longitudinal hemispheres (Figure 2). Of course, the division into the Eastern and Western hemispheres is largely arbitrary: unlike the equator, the prime meridian has no physical meaning and is randomly chosen.
We can see (Figure 2) that the distribution for the Eastern Hemisphere shows a closer similarity to the distribution of seismic activity for Earth as a whole. In the Western Hemisphere, the main maximum of released seismic energy occurs earlier — in the fourth year of the solar cycle.
The next level of the analysis is latitudinal and lon- gitudinal belts. Latitudinal belts were taken of width 10°; longitudinal ones, 15°. For each belt we plotted distributions of the number of earthquakes and the released seismic energy over solar cycle phases. Then, from each phase we determined the solar cycle phase during which the main maximum of the corresponding parameter occurred. The result is presented in Figure 3. The graph itself (solid line) has a complex shape, but the trend line (dashed line), represented by the second degree polynomial, shows that the main maximum occurs later with increasing latitude both for the number of earthquakes (a) and for their total energy (b). No regularity has been revealed for longitudinal belts.
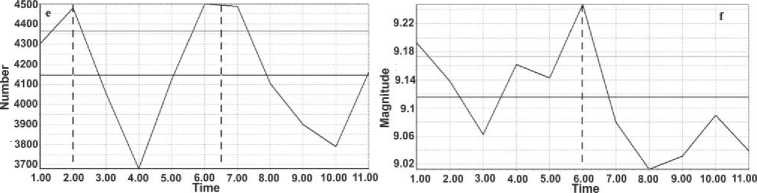
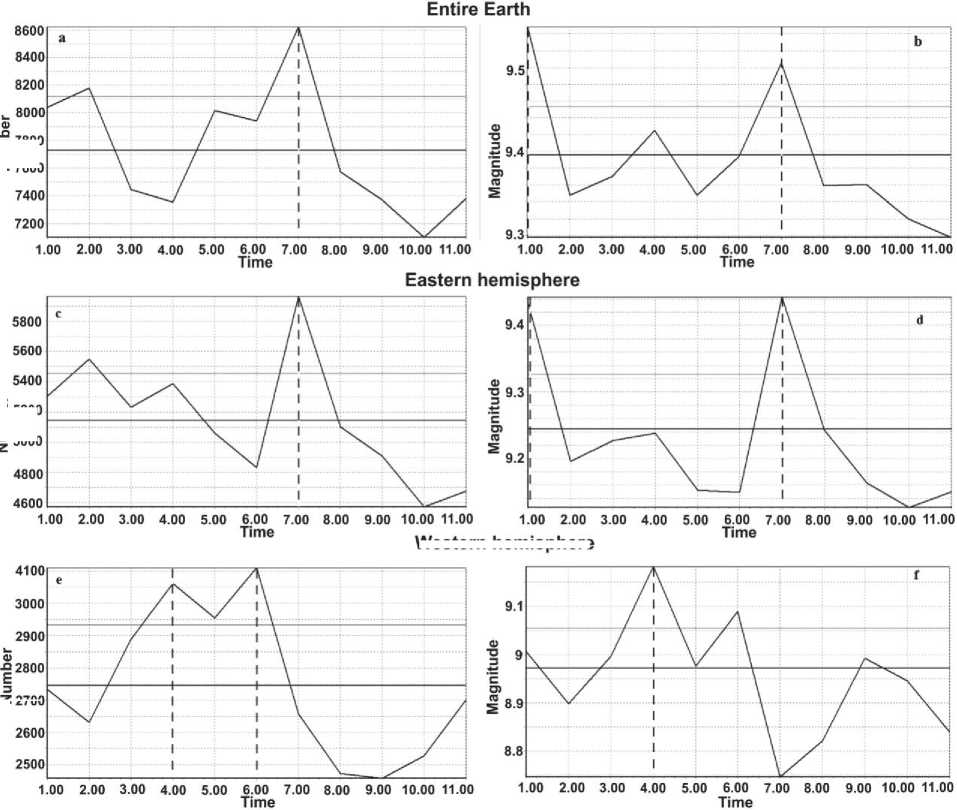
We turn now to the consideration of individual regions (Figure 4). It should be noted that the regions selected for analyzing seismic regimes radically differ from each other in existing regimes of seismotectonic degradation of the lithosphere. Graphs for each region (letter designations are the same as in Figure 4) are given in Figure 5: top six graphs ( a ) show the distribution of the number of earthquakes; bottom six graphs ( b ) indicate the distribution of the released seismic energy over solar cycle phases. Vertically in each block, the graphs are in order of changing longitudes of the respective regions from west to east.
Parts of the Atlantic Rift ( a ), the Himalayan collision zone ( b ), and the Japanese subduction zone ( c ) are located approximately in one latitudinal range — from 20° to 50° N. Figure 5 shows that the main maxima of the number of earthquakes shift to later solar cycle phases from west to east.
For series of the total energy, this regularity can be observed only partially. Three other regions of interest —
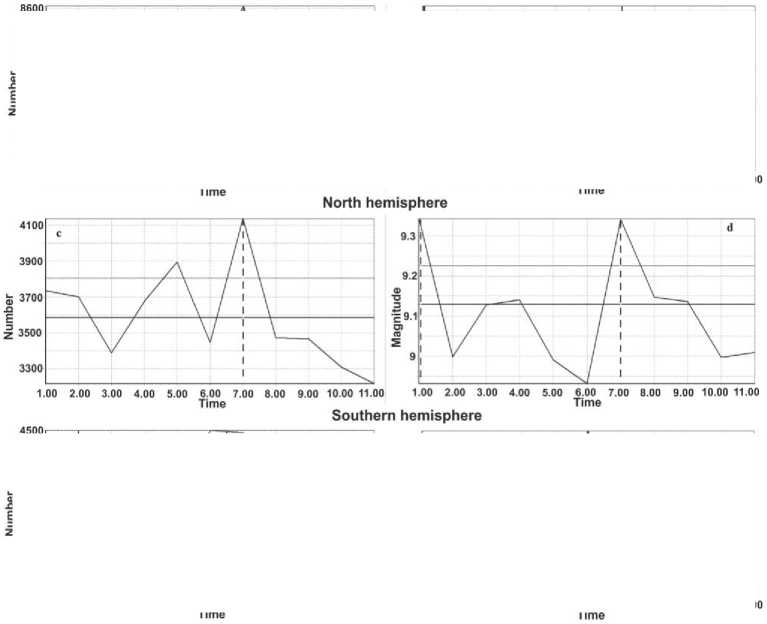
Figure 1. Distribution of the number of earthquakes ( a , c , e ) and the released seismic energy ( b , d , f ) for entire Earth ( a , b ), Northern ( c , d ) and Southern ( e , f ) hemispheres over solar cycle phases. Along the X-axis is the time in years of the 11-year solar cycle. Dashed lines indicate the main maxima. The horizontal line is the mean value of the corresponding parameter
Entire Earth
Western hemisphere
Z2700
Figure 2. Distribution of the number of earthquakes ( a , c , e ) and the released seismic energy ( b , d , f ) for entire Earth ( a , b ), Eastern ( c , d ) and Western ( e , f ) hemispheres over solar cycle phases. Along the X-axis is the time in years of the 11-year solar cycle. Dashed lines mark the main maxima
Ё 7800
Z 7600
£ 5200 E = 5000
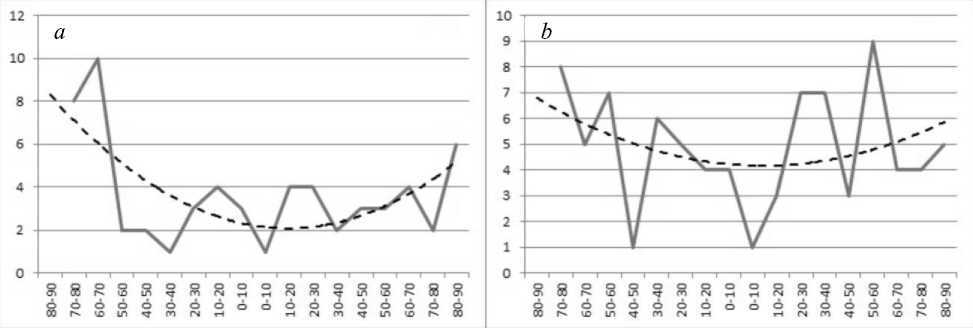
Figure 3. Distribution of the main maxima of the number of earthquakes ( a ) and the released seismic energy ( b ) in latitudinal belts of Earth over solar cycle phases (solid line). Along the Y-axis is the time in years of the 11-year solar cycle; along the X-axis are geographic coordinates of latitudinal belts; on the left is the Southern Hemisphere, on the right, the Northern Hemisphere. The dashed line shows a trend
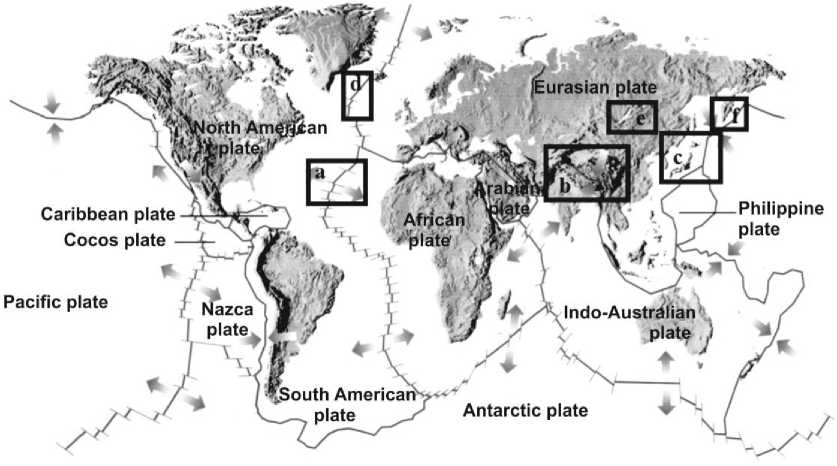
Figure 4. Location of regions considered (rectangles): parts of the Atlantic Rift ( a ), Himalayan collision zone ( b ), and Japanese subduction zone ( c ); the North Atlantic Rift ( d ), BRZ ( e ), and the Kamchatka part of the subduction zone ( f )
the North Atlantic Rift ( d ), BRZ ( e ), and the Kamchatka part of the subduction zone ( f ) — also have close latitudinal location — from 48° to 65° N. For them, no regularity has been found in the displacement of the main maxima in the longitudinal direction for series of the number of earthquakes. Noteworthy here is the similarity between the two groups of regions in the distribution of the total seismic energy: the main maxima of this parameter occur during the earlier solar cycle phase for the regions occupying the middle position in longitude ( b , e ).
DISCUSSION OF RESULTSAND THEIR INTERPRETATION
The analysis of the results shows that for all the above regions we have identified the solar cycle phases during which the number of earthquakes or the total released seismic energy is maximum. The phases thus detected are, however, different for the globe (seventh year of the solar cycle) and individual hemispheres. In this case, the results of seismic dissipation in the lithosphere of the Northern and Eastern hemispheres almost coincide with those obtained for Earth as a whole, whereas in the Southern and Western hemispheres seismic activity maxima occur during the earlier phase. From this we can conclude that the planetary distribution of the current seismotectonic activity over phases of the 11-year solar cycle is largely determined by the northeastern sector of Earth. The asymmetry of the hemispheres we found manifests itself not only in the distribution of seismic activity over solar cycle phases but also in the distribution of earthquake regions over Earth’s surface. Table 1 presents the distribution of the number of earthquakes with M ≥5 over Earth’s hemispheres.
We can see that 46 % of earthquakes with M ≥5 occur in the Northern Hemisphere and 55 % in the Southern Hemisphere; the contribution of the Eastern Hemisphere is 67 % versus 36 % for the Western Hemisphere.
The distribution of the number of earthquakes over Earth’s sectors is illustrated by the histogram in Figure 6. We can see that the contribution of the northeastern sector to the number of earthquakes with M ≥5 is the greatest. The differences between seismic activity regimes in hemispheres and sectors in terms of geodynamics may be indirectly related to mantle flows, which, in turn, are triggered by the drift of Earth’s core from its geometric center to the northeastern sector of the planet [Barkin, 2009; Goncharov et al., 2014] .
We have statistically identified a feature in the distribution of seismic activity over latitudinal belts: the main maxima of seismic activity with increasing latitude occur during later and later phases in both hemispheres. No regularities in the distribution of seismic activity over longitudinal belts have been found.
The results of the calculations carried out for individual regions may differ from the results obtained for individual hemispheres of Earth as a whole. For the regions located in middle latitudes, there is a shift of the maximum number of earthquakes to later phases of the solar cycle in the direction from west to east, but we have not found such a regularity for northern regions with a latitude of >50°.
Differences in the distribution of seismic activity over the latitudinal belts manifest themselves not only in its distribution over solar cycle phases but also in the location of epicenters of earthquakes on Earth’s surface. Figure 7 shows that the maximum number of strong earthquakes with M ≥5 occurs in the near-equatorial region, and also there is a local maximum at latitudes 30°–50° in the Northern Hemisphere, where the Alpine-Himalayan interplate collision zone is located.
The influence of cosmogenic factors on terrestrial processes is often estimated from solar activity, since this factor is easily represented in numerical form as a series of Wolf numbers. Nevertheless, there is still no clear understanding of the nature of this influence. One hypothesis is that the correlation of solar activity with
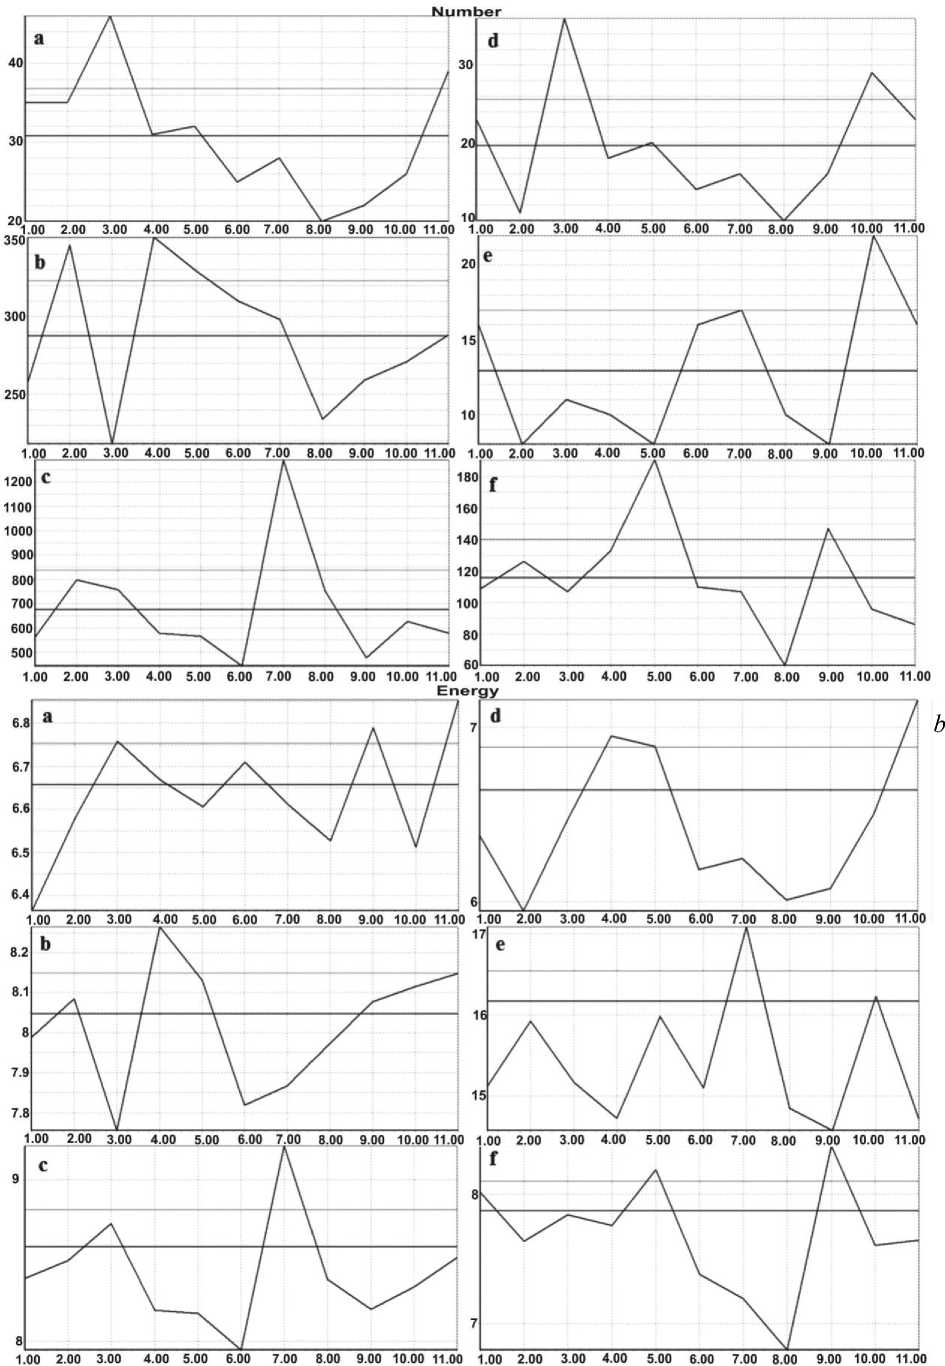
Figure 5. Distribution of the number of earthquakes ( a ) and the released seismic energy ( b ) for the regions designated by the corresponding letters in Figure 4. Along X-axes is the time in years of the 11-year solar cycle; Y-axes: a — the number of events; b — magnitude, except e that shows classes (BRZ)
Table 1
Distribution of the number of strong earthquakes with M ≥5 over Earth’s hemispheres
|
Region |
M ≥5 |
|
|
Number |
% |
|
|
Entire Earth |
85016 |
100 |
|
Northern Hemisphere |
39444 |
46 |
|
Southern Hemisphere |
45583 |
55 |
|
Eastern Hemisphere |
56595 |
67 |
|
Western Hemisphere |
30194 |
36 |
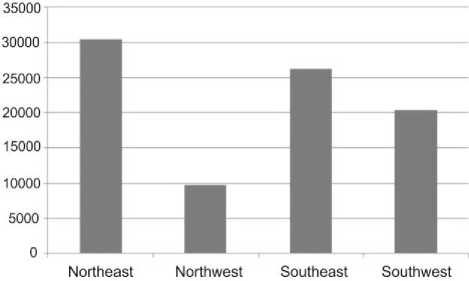
Figure 6. Distribution of the number of earthquakes with M ≥5 over Earth’s sectors
Figure 7. Distribution of the number of earthquakes over Earth’s latitudinal belts. To the left on the X-axis are latitudes of the Northern Hemisphere; and to the right, of the Southern one seismic activity of Earth may be attributed to the influence of the same factor on both the processes.
Avsyuk [1996] has shown that a change in the total tidal force affecting the Sun (in the Sun – Jupiter – Saturnsystem) corresponds to a change in solar activity considered over the period from 1800 to 1980. By the total tidal force is meant here the disturbing effect caused by the rotation of the Sun around the barycentre of the solar system. The above cosmogenic factors may be capable of initiating short-period variations with similar duration in Earth’s seismic regime.
We are well aware of that too short series of seismic data used in the calculations do not exclude the occurrence of random coincidences or, on the contrary, omit actual kinds of influence of extraterrestrial factors on seismotectonic deformation. From the standpoint of planetary geophysics, it has been shown that solar activity only partially contributes to the formation of solarterrestrial relations [Nagovitsin, 2012; Smolkov, 2018] .
Note that geodynamic effects of extraterrestrial impacts effectively manifest themselves as responses only for those areas of our planet, where in zones of interplate and intraplate faults there is an unstable geomechanical balance. Despite the quasi-regularity of the extraterrestrial impacts, significant seismic events initiated by a triggering mechanism not always occur in faults, therefore their identification becomes more reliable in the analysis of sufficiently long data series by statistical methods. In such calculations, we should also take into account possible delays of responses of geomechanical systems to extraterrestrial dynamic effects, which complicate their detection [Ruzhich, 1997] .
From the standpoint of geodynamics it is useful to compare the energy of gravitational and thermal fields. Table 2 presents data on the energy balance of Earth and power of different geodynamic processes [Barkin, 2013] . We can see that their total power is only slightly higher than the power of volcanic processes, but by three orders of magnitude lower than the power of heat convection and by four-five orders of magnitude lower than the power of dissipation both of the energy of mantle processes and of the total released energy of oscillatory motions of Earth’s core and viscoelastic deformations in the mantle. Due to the lack of knowledge, it is still very difficult to estimate the energy of the terrestrial gravitational eigenfield and the energy of the gravitational effect of the Sun and planets of the solar system.
In geosciences, misconceptions are often encountered which underestimate the energy contribution of the gravitational field of our planet and particularly of the solar system to geodynamics as compared to the contribution of the thermal field of Earth. At the same time, geologists ignore frictional processes that occur when slipping between geospheres, lead to the melting of huge volumes of rocks, to the occurrence of magma pockets, mantle currents, and channels of penetration of huge volumes of melts of mantle matter in the form of plumes, facilitated by gravitational differentiation, into the bottom of the lithosphere [Stothers, 1993; Bakirov, 2007; Dobretsov, Turkina, 2015] . A huge amount of energy of impacts of the gravitational field of the Sun and planets of the solar system on Earth usually goes unnoticed [Smolkov, Barkin, 2014] .
Many experts do not still understand causes, mechanisms, and consequences of the extraterrestrial impacts on the form of the geoid (Figure 8), including causes and characteristics of the drift of the inner core, manifestations of convection currents in the mantle, emergence of superplumes, destruction of the lithospheric shell, as well as changes in paths of motion of lithospheric plates and interplate interactions. Figure 8 shows the detected drift of Earth’s mass center to the northeastern sector. The very fact of the core motion has been found out from DORIS system imaging data [Zotov et al., 2009] . Many geodynamic processes can be considered as consequences of the fundamental phenomenon — accelerated movements of the core mass center relative to the mantle mass center.
Geodynamic consequences of the centuries-old drift of Earth’s mass center to its northeastern sector revealed themselves in changes of the form of the geoid. Near the south pole, the concavity appeared; near the north pole, the bulge. According to the ideas discussed in [Goncharov et al., 2014], the drift of Earth’s core in the said direction gave rise to a submeridional current in the mantle and to the northeastward compression of the earth’s crust extended over Earth. From the geological viewpoint, the observed shape of Earth can be considered as clear evidence of deformation processes in the upper shell of the planet, initiated by stepwise displacements of its core and mantle disturbances. Another example confirming the important role of the compression of the earth’s crust in geodynamics is the widespread occurrence of thrusts and reverse-strike faults in East Siberia,
Table 2
Earth energy budget and power of geodynamic processes
According to the available geological information, e.g., [Letnikov, 2001; Rodkin, Rundkvist, 2017] , an additional and still little-known factor acting within solar-terrestrial relations and affecting many terrestrial physicochemical processes may be the planetary thermogravity process, which manifests itself in the form of high-speed transfer of huge volumes of mineral matter from the outer boundary of Earth’s core to the upper layers of the mantle and to the lithosphere by gas-saturated lightweight fluids. Pulsed propagation of fluids rapid in geological terms naturally stimulates viscoplastic deformation processes in the lithosphere and an episodic accelerated decrease in shear resistance in fault zones. With such a mechanism, frictional instability may occur in segments of fault zones, which, along with deformation waves, including tidal ones, promotes qua-siperiodic activation of trigger-type seismic processes
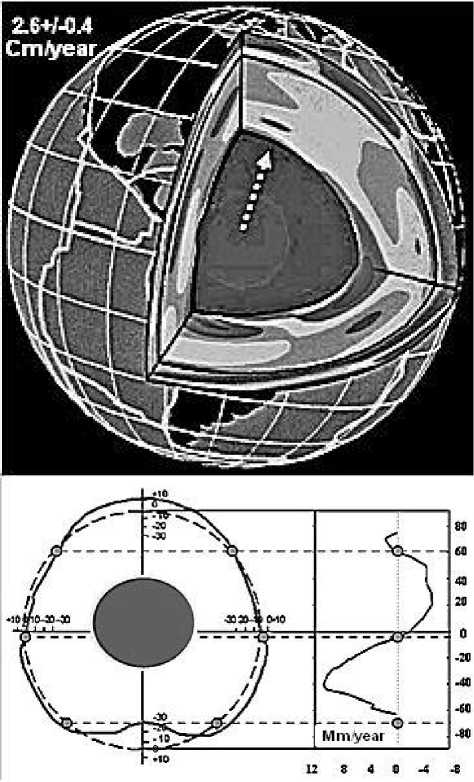
Figure 8. The Earth mantle (top), the arrow indicates the direction (northeastward) of the drift of Earth’s mass center for the period from 1993 to 2007 [Zotov et al,. 2009] ; the drift velocity is shown in the top left corner. The form of the geoid and its changes (bottom) observed in the recent epoch according to [Barkin, 2002; Khain, Khalilov, 2009]
[Levina, Ruzhich, 2010] . The interaction between the gravitational field and the thermal field of Earth continuously manifests itself through the activity of endogenous processes, such as the drift of the mass center, physicochemical transformations of rocks, convective currents in the mantle, magmatism, emergence of plumes, and through periodicities in seismotectonic degradation, including the 11-year one.
The kinetic energy contribution, associated with the effect of variations in the rotational and orbital revolution of Earth, to endogenous processes is also significant [Bakirov, 2007; Song, Richards, 1996; Raman, 2011] . This energy undoubtedly affects the modes of release of the elastic seismic energy during deformation and destruction of the lithospheric shell. Levin and Sa-sorova [2012] have observed a statistically significant similarity between global distributions of seismic events for Earth and the Moon, which has no such a thermal energy source as the hot core.
CONCLUSION
We have demonstrated the presence of statistically significant maxima in the distribution of seismic activity over phases of the 11-year solar cycle, which were identified by the superposed epoch method. The ambiguous results obtained by different authors when studying the periodicity in the seismic regime of Earth can be explained by complex combinations of cosmogenic factors affecting the geodynamics of the planet as a whole and its individual regions.
The presence of clear maxima in the distribution of seismic activity over solar cycle phases allows us to identify the periods when the probability of an increase in the number of earthquakes or the occurrence of a strong earthquake significantly increases. Using the Baikal Rift Zone as an example, we have confirmed the significance of this factor in the medium-term earthquake prediction [Ruzhich, 1997; Ruzhich et al., 2018] .
We believe that the detailed study of the relationship between the 11-year solar cycle and the seismic activity regime can not only estimate the influence of extraterrestrial factors on the processes occurring on our planet but also provide reasoned explanations of many phenomena in geology and geodynamics.
The work was performed under base project No. 0346-2019-0007 «Tectonophysics of current geodynamic processes in the lithosphere of Central Asia as a basis for the prediction of natural emergencies".
Список литературы Особенности распределения сейсмической активности в разных регионах Земли по фазам 11-летнего солнечного цикла
- Авсюк Ю.Н. Приливные силы и природные процессы. М.: ОИФЗ РАН, 1996. 188 с.
- Бакиров А.Б. Главнейшие структуры Земли и источники энергии геодинамических процессов // Фундаментальные проблемы геотектоники: материалы XL тектонического совещания. Т. I. М.: ГЕОС, 2007. С. 43-45.
- Баркин Ю.В. Объяснение эндогенной активности планет и спутников и ее цикличности // Изв. секции наук о Земле Российской академии естественных наук. М.: ВИНИТИ, 2002. Вып. 9. С. 45-97.
- Баркин Ю.В. Относительные смещения ядра и мантии Земли и их роль в сейсмическом процессе // Международная конференция "Геология: история, теория, практика", посвященная 250-летию Государственного геологического музея им. В.И. Вернадского РАН (14-16 октября 2009 г.). М.: ГГМ РАН, 2009. С. 20-24.
- Баркин Ю.В. Синхронные скачки в процессах и явлениях на Земле, Луне и Солнце в 1997-1998 гг. и их единый механизм // Геология морей и океанов. Труды XX Международной научной конференции (Школы) по морской геологии. Т. V. М.: ГЕОС, 2013. С. 21-25.
- Гончаров М.А., Разницин Ю.Н., Баркин Ю.В. Северная компонента дрейфа континентов в фанерозое: структурные следствия и возможная причина // Доклады Академии наук. 2014. Т. 455, № 5. С. 550-552.
- DOI: 10.7868/S0869565214110176
- Добрецов Н.Л., Туркина О.М. Раннедокембрийская история Земли: роль плейт- и плюм-тектоники и космического фактора // Геология и геофизика. 2015. Т. 56, № 7. С. 1250-1274.
- DOI: 10.15372/GiG20150702
- Дядьков П.Г. Периодичности в изменениях сейсмического режима и напряжений в земной коре Байкальской рифтовой зоны: связь с 11-летней цикличностью солнечной активности и сезонными изменениями уровня оз. Байкал // Атлас временных вариаций природных, антропогенных и социальных процессов. Т. 3. М.: Янус-К, 2002., С. 251-254.
- Левин Б.В. О природе некоторых периодических изменений в сейсмическом режиме Земли // Вестник ДВО РАН. 2006. № 1. С. 51-58.
- Левин Б.В., Сасорова Е.В. Сейсмотектоника и земные приливы // Тихоокеанская геология. 2012. Т. 31, № 1. С. 80-87.
- Левина Е.А., Ружич В.В. Миграция землетрясений как проявление волновых деформаций твердой оболочки Земли // Всероссийский семинар-совещание "Триггерные эффекты в геосистемах": Материалы. М.: ГЕОС, 2010. С. 71-78.
- Левина Е.А., Ружич В.В. Проявление одиннадцатилетней периодичности в сейсмомиграционных процессах рифтовых систем Земли // III Всероссийское совещание и II Всероссийская молодежная школа по современной геодинамике "Современная геодинамика Центральной Азии и опасные природные процессы: результаты исследований на количественной основе": Материалы. Иркутск: ИЗК СО РАН, 2016. С. 269-272.
- Летников Ф.А. Сверхглубинные флюидные системы Земли и проблемы рудогенеза // Геология рудных месторождений. 2001. Т. 43. № 4. С. 291-307.
- Любушин А.А., Писаренко В.Ф., Ружич В.В., Буддо В.Ю. Выделение периодичностей в сейсмическом режиме // Вулканология и сейсмология. 1998, № 1. С. 62-76.
- Наговицин Ю.А. Солнечная активность и солнечно-земные связи на различных временных шкалах // Всероссийская конференция "Солнечная активность и природа глобальных и региональных климатических изменений": Тезисы докладов. Иркутск, 19-22 июня 2012 г. С. 20.
- Родкин М.В., Рундквист Д.В. Геофлюидогеодинамика. Приложение к сейсмологии, тектонике, процессам рудо- и нефтегенеза. Долгопрудный: Издательский Дом "Интеллект", 2017. 288 с.
- Ружич В.В. Сейсмотектоническая деструкция в земной коре Байкальской рифтовой зоны. Новосибирск: Изд-во СО РАН, 1997. 144 с.
- Ружич В.В., Шерман С.И., Тарасевич С.И. Новые данные о надвигах в юго-западном фланге Байкальской рифтовой зоны // Доклады АН СССР. 1972. Т. 205, № 4. С. 920-924.
- Смольков Г.Я., Баркин Ю.В. К системному и междисциплинарному изучению солнечно-земных связей // Коллоквиум "Космические факторы эволюции биосферы и геосферы": Труды. Москва, ГАИШ, 21-23 мая 2014 г. СПб.: Изд-во ВВМ, 2014. С. 162.
- Тяпкин К.Ф. Изменение положения оси вращения в теле Земли: причина, механизм и использование для объяснения глобальных тектонических процессов в земной коре // Геофиз. журнал. 2012. Т. З4, № 6. С. 91-100.
- Хаин В.Е., Халилов Э.Н. Цикличность геодинамических процессов: ее возможная природа. М.: Научный мир, 2009. 520 с.
- Чипизубов А.В. К прогнозу изменений сейсмичности Земли по изменчивости солнечной деятельности и других геономических процессов // XII Российско-Монгольская международная конференция "Солнечно-земные связи и геодинамика Байкало-Монгольского региона": Тезисы докладов. Иркутск, 2-4 октября 2018 г. С. 25.
- Levina E.A., Ruzhich V.V. The seismicity migration study based on space-time diagrams // Geodynamics and Tectonophysics. 2015. V. 6, iss. 2. P. 225-240.
- DOI: 10.5800/GT-2015-6-2-0178
- Northern California Earthquake Data Center. URL: http://www.ncedc.org. (дата обращения 20 мая 2019 г.).
- Raman K. Space weather - Sun - Earth relations // Intern. J. Astron. Astrophys. 2011. № 1. С. 10-14.
- DOI: 10.4236/ijaa.2011.11003
- Ruzhich V.V., Levina Ye.A., Ponomareva E.I. Availabi-lity and problems of the earthquake prediction (on an example of the Baikal rift) // Международная юбилейная научная конференция "Воздействие внешних полей на сейсмический режим и мониторинг их проявлений": Тезисы докладов. Бишкек, Киргизская Республика, НС РАН, 3-7 июля 2018 г.
- Sidorenkov N.S. The Interaction Between Earth's Rotation and Geophysical Processes. Weinheim: WILEY-VCH Verlag GmbH and Co. KGaA, 2009. 305 p. 10.1002/ 9783527627721.
- DOI: 10.1002/9783527627721
- Smolkov G.Ya. The natural changes of solar-terrestrial relations // Adv. Res. Astrophys. 2018. V. 3, N 4. Р. 205-217.
- DOI: 10.22606/adap.2018.34001
- Song X., Richards P.G. Seismological evidence for differen-tial rotation of the Earth's inner сore // Nature. 1996. V. 382. P. 221-224.
- DOI: 10.1038/382221a0
- Stothers R.B. Hot spot and Sun spot: surface of deep mantle convection in the Earth and Sun // Earth and Planetary Sci. Lett. 1993. V. 116. P. 62-69.
- DOI: 10.1016/0012-821X(93)90041-7
- Zotov L.V., Barkin Yu.V., Lubushin A.A. Geocenter motion and its geodynamical content // Space Geodynamics and Modeling of the Global Geodynamic Processes. Novosibirsk, 22-26 September, 2008. Novosibirsk: Academic Publ. House "Geo", 2009. P. 98-101.
- URL: http://www.seis-bykl.ru (дата обращения 20 мая 2019 г.).
