Parkinson's Brain Disease Prediction Using Big Data Analytics

Author: N. Shamli, B. Sathiyabhama
Journal: International Journal of Information Technology and Computer Science(IJITCS) @ijitcs
Article in issue: 6 Vol. 8, 2016.
Free access
In healthcare industries, the demand for maintaining large amount of patients' data is steadily growing due to rising population which has resulted in the increase of details about clinical and laboratory tests, imaging, prescription and medication. These data can be called "Big Data", because of their size, complexity and diversity. Big data analytics aims at improving patient care and identifying preventive measures proactively. To save lives and recommend life style changes for a peaceful and healthier life at low costs. The proposed predictive analytics framework is a combination of Decision Tree, Support Vector Machine and Artificial Neural Network which is used to gain insights from patients. Parkinson's disease voice dataset from UCI Machine learning repository is used as input. The experimental results show that early detection of disease will facilitate clinical monitoring of elderly people and increase the chances of their life span and improved lifestyle to lead peaceful life.
Big Data, Predictive Analytics, Parkinson's disease, Voice dataset
Short address: https://sciup.org/15012500
IDR: 15012500
Text of the scientific article Parkinson's Brain Disease Prediction Using Big Data Analytics
Published Online June 2016 in MECS
Big Data is an emerging area which handles large collection of voluminous complex data, which may be a mixture of structured, semi- structured, quasi-structured and unstructured data [1]. These data are not easily processed by using conventional data mining methods. Traditional databases handle only structured and limited amount of data because they are centralized [1]. The variety of data formats and data types are not handled in conventional data mining methods. There are several problems in processing, storing and analyzing large amount of data. Hadoop is used to find the solution for all the above problems [28]. There are two layers in Hadoop framework Distributed File System (DFS) and Execution engine (MapReduce). In big data, data sources are distributed on multiple servers. For accessing these data, DFS is used. DFS acts as client-server model which allows client to retrieve and store data from the server. MapReduce is the processing part that performs parallel computing. It is a software framework that processes large amount of data in distributed servers. The framework is divided into two parts, Mapper and Reducer [5]. In Mapper phase, the large data is divided into small pieces and input key value is assigned to all the data. Reducer is the reduction phase in which the output from the mapper share the same key. Big data analytics usually performed with the software tools commonly used as part of advanced analytics disciplines such as predictive analytics, descriptive analytics and prescriptive analytics. But the unstructured data sources used for big data analytics may not fit in traditional data warehouses [1]. Furthermore, traditional data warehouses may not be able to handle the processing demands posed by big data. The technologies associated with big data analytics include NoSQL databases, Hadoop and MapReduce [4]. These technologies form the core of a big data software framework that supports the processing of large data sets across clustered systems. Big Data is characterized by the following V’s for achieving high scalability [1]. They are
-
• Volume– It can be measured by quantity of data. Large amount of data can be stored from terabytes to zettabytes.
-
• Variety - It handles both structured, unstructured and semi structured data like text, audio, images, video, internet data and geospatial.
-
• Velocity-This refer to the speed in which data is created, stored and processed. It is used to develop a real time processing system to make real time decision.
-
• Veracity- This is about the Integrity of data. It points to data quality issues and trustworthiness of the information.
-
• Value- This relates to extracting value from the data with the increased number of systems, size and storage.
To analyze such a huge volume of data, big data analytics can be done using specialized software tools and applications for predictive analytics, text mining, data mining, data optimization and forecasting. These processes are separate and at the same time they are highly integrated functions of high-performance analytics
-
[1] . Using big data tools and software enables an organization to process extremely large volumes of data that a business has collected to determine the relevance of data and can be analyzed to drive better business decisions in future [28].Enterprises are increasingly looking forward to finding actionable insights from the data. Many big data projects originate from the need to answer specific business questions such as what customers really think about their brand, and how one can increase sales intelligence and close more deals. With the right big data analytics platform in place, enterprises can boost sales, increase efficiency and improve operations, customer service and risk management. It helps the organizations to discover the meaningful patterns which may be helpful for strategic decision making [7].The other data sources may also include like, social media activity reports, mobile-phone call detail records, Web server logs and Internet clickstream data and information captured by sensors. Some people entirely associate big data and big data analytics with unstructured data, however consulting firms such as Gartner In and Forrester Research Inc. are consider the transaction and other structured data to be valid form of big data [22].
Analysis of big data can help clinicians and organizations to deliver high quality and in particular cost-effective care to the patients [1]. Big data can lead to the development of an anticipatory health care system, where providers can create personalized evidence-based medicine, tailored to patients’ personal prevention profiles, social determinants of health, and even preferences for how, where, and when they want to receive care [10]. It can help to identify both public health threats and safety issues. Big data can help researchers to understand more than ever before about diseases and many factors that affect them, as well as determine what treatments are most effective for particular conditions. Most importantly, it can help patients understand their own health better and navigate and access the health care system more effectively [23].
Big Data analysts can use predictive and statistical methods that use data to predict risk or trends to help health care providers target care in ways that improve outcomes and save money [7]. Some health care organizations are already using predictive models to help customized care in many ways that improve outcomes and prevent unnecessary utilization. Even though it possesses lots of advantages, there are some of the barriers and challenges to the effective use of big data in health care which include a failure to adopt existing data standards to assure interoperability across settings, lack of willingness to engage in information sharing, concerns about privacy and security, a lack of tools to help both clinicians and patients take advantage of data, and the need to build a culture in medicine that integrates the use of data in a practical way [23]. Big data has the potential to transform health care and significantly improve health outcomes. In the near future, big data analytics will dramatically improve the delivery of care and the health of populations and individuals. Health care professionals, information technology leaders and policymakers must continue and contribute to the development of new methods and algorithms to forward towards better care and better health for the required individuals.
-
1.1 Descriptive, Predictive and Prescriptive Analytics
Analytics solution is used to extract meaning from large amount of data to help organizations to improve decision making and provide better outcomes. The organizations collects the enough data then build a statistical model for collected data and predict the value from it.
-
1.1.1 Descriptive analytics- insights into the past
Descriptive analytics is the simplest class of analytics [16]. It uses data aggregation and data mining techniques to summarize the complete view of data for what has happened. The common methods/techniques of data mining are;
-
• Artificial Neural Network (ANN)
-
• Decision tree (DT)
-
• Support Vector Machines (SVM)
-
• Genetic Algorithm (GAs)
-
• Nearest neighbor method
-
• Logistic regression
-
• Fuzzy based Neural Networks
-
• Bayesian Networks
-
• Random tree techniques
-
1.1.2 Predictive analytics- understanding the future
It uses a variety of statistical modeling, data mining techniques and machine learning techniques [16]. It can forecasts what might happen in the future, because it is a probabilistic in nature. It provide organization with actionable insights based on the data. Organizations identify pattern from the data and apply statistical modeling technique and algorithms to find relationships between various data sets.
-
1.1.3 Prescriptive analytics- Possible outcomes
It is the type of predictive analytics [16]. Prescriptive analytics requires a predictive model with two components, actionable data and a feedback system. It provides a set of possible actions and suggests actions based on descriptive and predictive analytics of complex data.
-
1.2 About Parkinson’s disease
PD is a neurological disease [2]. It affects certain brain cells that help in controlling the movement and coordination. Dopamine [20] is a hormone and neurotransmitter, a chemical that is generated by brain cell. It is used to send signals to other brain cells to control the muscle activity. PD causes, degeneration of dopamine in the brain cell which is unable to control the movement and activity of muscles. It is a common disorder in senile person [60years and above] which occurs in 1% of the population. There are several symptoms lead to PD. The symptoms may vary from person to person. Common symptoms in PD are muscular rigidity (limbs and upper half of the body is inflexible), shivering (vibration in upper and lower limbs or jaws, speech problem), expressionless face, Bradykinesia (slow movements), lethargy, Postural instability (depression and emotional changes), involuntary movements, dementia (loss of memory which is a common disorder of Alzheimer’s disease), thinking inability and sleeping disorders. Various stages in Parkinson’s disease are,
-
• Primary - Due to unknown reasons
-
• Secondary - Dopamine deficiency
-
• Hereditary- Genetic origin
-
• Multiple system atrophy - Degeneration of parts other than mid brain
-
• Carbidopa–levodopa - It is a natural chemical that passes into brain, convert to dopamine. High doses may cause involuntary movement [17].
-
• Dopamine agonist - It did not change dopamine, but act dopamine effects in brain [25]. It is similar to carbidopa and additionally it causes swelling, sleepiness and hallucinations.
-
• Amantadine - It is suggested at the early stage of PD. During later stages, it can be given with carbidopa-levodopa to control the involuntary movements.
For later stages, surgery is recommended for some people. It does not cure PD, but it may help ease symptoms. Surgery, Deep Brain Stimulation (DBS) is offered to people with advanced PD. Electrodes can be embedded into specific part of the brain that sends signals to your brain and may reduce the PD symptoms. DBS is a stabilize medication which reduces involuntary movements, tremor and rigidity [29].
Approximately 15% of people with PD have a family history of disorder. In a few cases, the disease may be inherited through certain gene changes. PD may occur at the age of 60. It affects both genders. Women have low risk for getting PD. They live longer with the disorder than man. There is 50% chance to have PD from their family history. Changes in the LRRK2, PARK2, PARK7, PINKI or SNCA genes cause PD.LRRK2 or SNCA refer to one copy of altered gene in each cell which is sufficient to cause the disorder.PARK2, PARK7 or PINKI advocate two copies of an altered gene in each cell [20].
Due to technological development in information technology and healthcare areas, healthier living, better outcomes and low cost healthcare delivery are possibly predicted from the PD patient’s analysis. For PD patients, life expectancy is 15 to 20 years and the survival rate is slightly lower than the people of the same age [20].
-
II. Related Work
In the past decade, predominantly data mining techniques are widely used to provide better patient care and effective diagnosis for the patient databases [survey paper]. The rationale behind applying data mining methods to the health care data is to analyze and predict the disease earlier [7]. From the collected patient datasets disease related and non-disease data are separated based on the data mining algorithms. In addition, treatment plans are developed and suggested appropriate medicines quickly and accurately. In the past, the medical records are hand written and kept as such. Due to the adoption of Hospital management systems and the rapid development of Internet technologies the medical records are digitized and distributed globally. Although distributed across, there are lots of methods to secure sensitive data. Finding and analyzing the data from different sources that use basic data mining algorithms like classification, clustering and association are used to predict the disease [3].
Big Data analytics is used to collect the data from different sources and apply machine learning techniques to predict the PD at an earlier stage. Big data analytics dramatically improves the healthcare of individuals. It helps to identify the factors which affect the health and helps to provide appropriate care for individuals [1].Nowadays, due to technological development, people use internet for collecting information about their health and healthcare by using sensors and wearable devices. Big Data provides personalized care for individuals and recommends drugs as well as treatments [7]. Finding the symptoms related to the disease is used to give an appropriate treatments and drugs to the patients. It is used to identify the genetic variations that affect the individuals to Multiple Sclerosis [22].
In Healthcare, data modeling and algorithm development is performed using leading data mining and supervised machine learning industry tools. These data modeling and algorithm development techniques are for generalized predictor of hospital readmissions, length of stay, heart failure and clustering of patient outcomes to historical cohorts at the time of admit mostly in both the inpatient and outpatient settings and adult and pediatric populations. This training data is crucial to addressing the predictive analytics demands of clients and site customization. The model involves the data and the expertise to successfully deliver top performing predictive analytics [7]. The multi classifier algorithms are proposed to predict the accuracy of disease.
Traditional data mining techniques can store limited amount of data. These techniques require a schema for storing all type of data into database without any limitation in the input data [1]. Improved usage of technology (Big Data Analytics) can handle huge amount of data and enhance the quality and quantity of the database. Thus, predictions based database will cover all the possible cases and thereby the model produces high accuracy with improved results. A database contains text dataset (patient history, symptoms and factors), voice data (speech variations) and image data. Sometimes dataset may contain genetic variations. Data sets collected from UCI machine learning repository [14]. Mining the knowledge from such medical datasets is to analyze and predict the disease by using data mining algorithms [3]. Basically, the term analytics in “big data analytics” is meant to apply predictive data mining algorithms or machine learning algorithms that are applied to these huge big datasets.
GeetaYadav and Yugal Kumar [15] have developed a statistical model which analyses Gait Rhythm in Patients with Parkinson′s Disease. The model proposed by these authors identifies the people affected by the PD more accurately. Also, predictive model for PD identification is developed. Three classification of algorithms are used (i.e.) tree classifier, statistical classifier and support vector machine. Based on the sensitivity, accuracy and specificity, the performances of PD are analyzed. Among the three classifiers, SVM and tree classifier produce high accuracy and sensitivity. Though the statistical classifier correctly identifies the number of people who are affected by PD, the count is less because the result of accuracy and sensitivity is more or less equal. SVM and Tree classifiers require additional functionalities because of variation in specificity and sensitivity. Whereas, in statistical classifiers, sensitivity and specificity are almost the same and further investigation is not necessitated.
TawseefAyoub Shaikh has proposed a prototype of Parkinson’s and Primary Tumor Diseases Prediction Using Data Mining Techniques [6]. The performance is measured based on accuracy, sensitivity, and specificity. The results are shown in confusion matrix. Psychiatric data set are used to predict the probability of disease [14]. In this work, two types of disease PD and primary tumor are considered. ANN, Decision Tree and Naïve Bayes algorithm are used to predict the disease. ANN provides good accuracy in PD and Naïve Bayes provides the best accuracy in primary tumors and it classifies the result based on the confusion metrics. To improve the predictive accuracy, the algorithms are splitted into sub groups by using mathematical algorithm (gini index, information gain, chi-squared test). Even though ANN gives good accuracy in PD, it consumes more time.
The various drawbacks of these models developed for analyzing the PD are performance degradation because of the huge data, less accuracy in prediction and security of the patient’s data. In addition, the voice data set is used almost in all the models developed previously. This dataset has its own limitations where the most of its attributes are not properly recorded due to various technical issues which lead to incorrect classification of patients and it is very difficult to arrive at the further treatment plans [22]. Hence, it is planned to propose a big data based analytics model that cater to the issue of handling the huge voluminous patient data for exhaustive and complete analysis profile. This model will be designed further with the best collection of classifiers for enhancing the accuracy of the classifiers. In addition, this model tries to integrate the real time PD patients’ data with the existing voice data set for better prediction with good sensitivity and specificity. Sensitivity and specificity are important for disease data analysis. The predictive model will use the required symptoms that will be important in identifying the PD and they are appropriately accommodated in the data set for better treatment and care [21].
Parkinson’s disease is characterized by age factor, shivering legs, arms and hands and impaired speech articulation. Here, one of the symptoms, speech articulation of people affected by Parkinson’s disease, is taken for formation and analyzes purposes of the model. Chandrashekhar et al., [12] have introduced predictive model which uses tree based classification model such as decision tree, ID3 and decision stumps. The K-fold cross validation technique is used to estimate the performance of predictive model. Among these models decision tree provide high accuracy (85.08%). As seen the accuracy is not optimal because the training dataset from a specific group when applied to general group then there is large difference between the cross validation result of specific group and the general group.
Gracy et al., [13] have discussed the four types of classifiers namely, Naïve Bayes, random tree, J48 and decision tree. WEKA tool is used to run the above classifiers. The performance is evaluated from the factors like shivering hands, legs, arms or jaws and emotional changes. The accuracy of above classifiers are shown using confusion matrix. A confusion matrix gives information about the actual and predicted values of classifiers. Among these classifiers, random tree provide 84% of accuracy. The proposed technique (Big Data) handles large amount of data with optimum accuracy.
Shianghau et al., [19] have claimed that 45% of the PD patients are affected by the voice disorders with vowel prolongation, isolated conversation and sentences and syllable repetitions among various other symptoms of PD. Especially syllable repetitions are considered to test the patients with the PD. Data set is collected from Max Little of the University of Oxford [14]. It consists of voice measurements of 31 people out of which 23 are affected by PD. With the help of SPSS 10.0 software 22 voice measurement variable are analyzed using three methods Decision tree, Logistic regression and Neural net analysis. These methods are analyzed to find out the method which has lowest error probability. Out of these models, Decision tree has the lowest error probability. Decision tree distinguishes healthy people from PD affected people based on certain criteria. Hence, its overall error probability of classification is 8.47%, there are still chances that the healthy people may be misinterpreted as people affected by PD. Proposed system is aimed to predict the Parkinson’s people correctly and also provide lowest error probability.
For decreasing possible errors and also increasing reliability and accuracy of diagnoses classification systems can be used. This is depicted in the work of
David et al., [27]. ANN and SVM are the two classification models which give better performance in diagnosis task and hence it is being used in pattern recognition. MLP is more or less ANN in which there is input and its desired output is presented. In order to minimize the error, backpropogation algorithm uses the threshold and weights of neurons. The weight is adopted in such a way that it reduces the error function. This reduction in error function is implemented using gradient decent where the weights are changed to reduce error function in the direction negative gradient. SVM kernel provides more accuracy than MLP. SVM can be implemented using 2 types of kernels - SVM linear kernel and SVM puk kernel. SVM linear kernel has sensitivity of 99.32% which is considered to be highest and SVM puk kernel has highest classification accuracy of 93.33%. Since classification accuracy is considered to be an important factor, big data can be used to get better classification accuracy.
Big Data analytics [1] is the process of collecting, organizing and analyzing the data from a large set of data, to discover pattern and other information. Various classification techniques are widely used in Parkinson’s disease analysis and to predict the status of the disease. Technology development in medical and others fields are mainly focused to reduce the service cost. Random tree, ID3, classification and regression tree, decision tree, NN are used. Analytic based methods provide the appropriate treatment suggestions by grouping the patients who have similar symptoms. Multi classifier methods produce better accuracy because they are evaluated by 10-fold cross validation approach [12]. DivyaTomar and Sonali Agarwal [8] have performed comparative analysis of different types of algorithms and discovered the class of attributes which may not tell anything about the relationship among the attributes. The main drawbacks of these algorithms are privacy and security which arises from patients’ data. Voice measurement dataset is used as input dataset which is retrieved from UCI machine learning repository [14].
Algorithms are used for identifying the attributes that relate to the PD .Voice data set is used for diagnoing the human diseases. Here, statistical analysis, classification, evaluation and unsupervised learning (clustering)
algorithms are used [11]. They are used as two different tools (Weka, orange). Orange tool is used for data visualization. Using Weka data mining tool, Classification algorithm (Random Forest) is implemented and accuracy (90.26%) higher than the other techniques is exhibited. This tool classifies the instances correctly. In Receiver Operating Characteristics (ROC) curve, SVM shows ample accuracy compared with majority of algorithms. Next to this, KNN algorithm provides good accuracy.
HananelHazan et al. [21] have developed a machine learning model for early diagnosis of PD voice Data. These authors used SVM to diagnose the PD. The speech vowel format data is used to diagnose the disease and the symptoms are taken into account to prevent the disease. Separate data, cross-country and pooled data sets are three approaches used here. It is not useful for the large number of patients. Major drawback of this method is that the security (patients’ data) is breached at times when it was shared for analysis purpose.
Kolçe and Frasheri [26] have suggested that the data mining techniques used in the diagnosis and prognosis of diseases are DTs, ANNs and Bayesian algorithms appear to be the most well performing algorithms for diagnosis. For prognosis ANNs, Bayesian algorithms, DTs and Fuzzy algorithms have come out to be the most well performing algorithms. In the literature, prognosis and diagnosis of Cancer Diseases ANNs are used. For heart disease prediction Bayesian algorithms are employed and for DTs are used in general for other disease analysis. Among these, ANNs and Bayesian algorithms are the most well performing techniques. In healthcare, these kind of predictive classification models provide several benefits which are utilized by the medical practitioner in identifying patients’ behavior, providing the treatments to that disease and prescribing appropriate treatments and medications to the patients. Hence, the proposed system stores large amount of “big data” about the patients, disease related symptoms, tests and other relevant details. This system detects the disease at earlier stages that can be done by analyzing a patients’ data such as imaging data, test results suggested treatment and medicines and also it is used to provide the cost effective treatment.
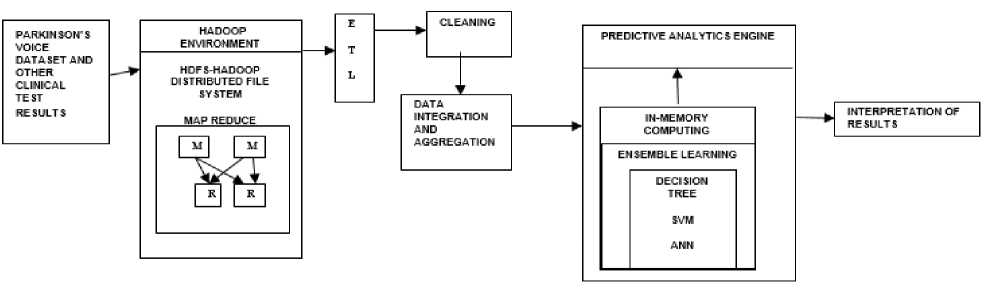
Fig.1. Architecture of the proposed system.
-
III. System Architecture
-
3.1 Algorithm C4.5
Gain Ratio(S,T)= Gain(S,T)/SplitInfo(S,T)
Where, SplitInfo(S,T) calculated as
|Ts, v|
splitlnfo ( s , T )= ∑ |Ts| ∗ log
∈ values(Ts)
|Ts, v| |Ts|
-
3.2 MapReduce implementation
Input: T- training dataset, S - attribute
Output: Decision Tree
If T=NULL then
Return failure
Endif
If S=NULL
Return Tree as single node with frequent class label in T
Endif
Set tree= {}
For a ∈ S do
Set info(a,T)=0, split info(a,T)=0
Compute entropy(a)
For v ∈ values(a,T)do
Endfor
Endfor
Set Ta,v is subset of T with attribute a=v
Set abest=argmax{Gain ratio(a,T)}
Attach abesttree
For v ∈ values(abest,T)do
Call C4.5(T a,v )
End for
Return Tree.
Entropy is calculated by using following formula,
Here c- no of classes and p(S,j) is the proportion of instances in that are assigned to j-th class. Then
Entropy(S)= ∑ j=0 р(Ѕ, ј) ∗ logp(Ѕ, ј)
Accordingly, the information gain by a training dataset T is defined as
Gain (S,T)=entropy(S)-
∑| , | entropy(Sv) where
∈ values ( ) | |
Ts - is the set of values of S in T
T is the subset of T induced by S, and S v T , is the subset of T in which attribute S has a value of v.
Gain Ratio is calculated as,
ProcedureMAP_ATTRIBUTE (row_id(a1,a2,…)) Emit(aj(row_id,c))
End procedure
Procedure REDUSE_ATTRIBUTE(aj,(row_id,c))
Emit(aj,(c,cnt))
End procedure
Procedure REDUCE_POPULATION(aj,(c,cnt))
Emit(aj,all)
End procedure
Procedure MAP_COMPUTATION(aj,(c,cnt,all))
Compute Entropy(aj)
Compete Info(aj)=cnt/allEntropy(aj)
Compete Split Info(aj)= -cnt/allEntropy
(aj)
Emit (aj,(In fo(aj), split In fo(aj ))
End procedure
Procedure REDUCE_COMPUTATION((aj,(In
fo(aj),split In fo(aj))
Emit(aj,GainRtio(aj))
End procedure
Procedure
MAP_UPDATE_COUNT((abest,(row_id,c))
Emit(abest,(c,cnt’))
End procedure
Procedure MAP_HASH(abest,(c,cnt’))
Compute node_id=hash(abest)
Emit (row_id,node_id)
End procedure
Procedure MAP((abest,row_id))
Compute node_id=hash(abest)
If node_id is same with the old value than
Emit(row_id,node_id)
End if
Add a new subnode
Emit (row_id,node_id,subnode_id)
End procedure
Before executing the algorithm, data is processed in MapReduce. Procedure MAP_ATTRIBUTE transforms the instance record into attribute table with attribute aj (j=1, 2 ,… m) as key, and row_id and class label c as values. Procedure REDUCE_ATTRIBUTE compute the number of instances along with class labels split with attribute aj and it forms count table. The REDUCE_POPULATION procedure takes the number of instances for each Key, value pair to combine the total
PD voice dataset is collected from UCI machine learning repository [14].For analysis purpose, the data is also collected from the clinical test results, oral disease related information and symptom details from Parkinson’s patients (CSV files). Analysis of these data will provide advanced diagnosis, early detection of disease and also reduce the cost [10]. The gathered information may not be in a particular kind of format and can easily produce petabytes of data. Then suitable data for analysis have to be brought under big data storage ecosystem. Convert this mixed type of big data into structured form which will facilitate the process ease as well as possible to retrieve actionable insights without missing the required information. The layered framework for big data ecosystem is designed as follows. Hadoop is a powerful platform for big data storage and processing which forms the first layer. The big data can be passed to the large data storage container called Hadoop Distributed File System (HDFS) which is basically a distributed environment [4]. The data can be processed reliably with improved scaling performance. HDFS is a cost effective system and also a fault-tolerant one. HDFS stores large files by dividing them into blocks and replicating the blocks on three or more servers [4]. A traditional Extract, Transform and Load (ETL) architecture accommodates multiple ETL iterations as well as an intermediate step to get the data from the source systems as quickly as possible [10]. HDFS provides APIs for MapReduce applications to read and write data in parallel [5].
Additional ETL iterations may be implemented to transfer data from the Enterprise Data Warehouse (EDW) into data marts, which support specific analytic purposes and end user tools [10]. Due to the power of database technology, RDBMS engines now support complex transformations in SQL, including in-database data mining, in-database data quality validation, cleansing, profiling, statistical algorithms, hierarchical and drilldown functionality, and much more. It has become more efficient to perform most types of “transformation” within the RDBMS engine. Selecting an optimal infrastructure of servers, storage, networking, and software will run the Hadoop cluster successfully and efficiently [4].
MapReduce is a distributed processing framework which helps to solve data-parallel problems [1]. MapReduce uses parallel programming approaches to deal with the complex and large datasets. The system splits the input dataset into multiple chunks, each of which is assigned a map task that can process the data in parallel. Each map task reads the input as a set of key, value pairs and produce an intermediate key, value pairs to the reduce tasks [4]. In addition, MapReduce uses JobTracker and TaskTracker mechanisms to schedule tasks and monitor them.
Big data analytics can provide the platform for integration of different analytics techniques to provide better healthcare [7]. For efficient analysis of Parkinson’s disease and to make better understanding of disease status predictive analytics techniques are used. In this proposed framework, three different classification techniques Decision tree, SVM and ANN are used analyzing PD patients’ records. Nevertheless, a single classifier would not be able to make appropriate predictions. The input datasets are divided into manageable size groups and these classifiers are experimented against each of these datasets and the highest accuracy value is chosen final decision. While processing, In-memory computing is used to access the data from Data warehouse and stores data in computer main memory to make faster access. This predictive analytical model, provide interpretation of result which detects the disease at earlier stages and provide the cost effective treatment. One of the main advantages to establish in-memory-based solutions with a NoSQL database is to reduce the cost of data access. Instead of storing the entire data purely in-memory or Random Access Memory (RAM), frequently accessed data alone can be retained. In the input datasets, the attributes that are used to construct the model are identified as frequently referred data which can be separated and passed onto the RAM. This can be implemented with the help of a two-tier approach, i.e., the in-memory computing systems run separately from the NoSQL database, which acts as the long-term storage and the frequently referred data attributes are kept in main memory which increases the speed of analytics operations.
Decision tree is one of the most powerful classification algorithms that are becoming increasingly popular with the growth of data mining and analytics in the field of computer science and information systems. Decision trees are formed from the classification rules [3]. In the decision tree, leaf nodes represent class labels and branches represent the test outcome of the features that are to be considered in order to make appropriate decisions. As it is a supervised learning model, the mandatory requirement is that it has to choose the suitable training datasets. From this learning, a prediction model is built and this tree building process is done in a recursive fashion [5]. Then the testing phase has to continue. The aim of the test phase is to perform segmentation of a given record into PD patient or healthy individual. There are no prior assumptions on the signal content or the probabilities of each of the two classes. All segment is classified separately. A block diagram describing the classification algorithm is shown in Fig. 2.
C4.5 decision tree is built using MapReduce computing model which is composed by a several Mappers and a Reducer, and deployed in a Hadoop distributed cluster [31]. The entire process has three phases - Partition phase, the Mapper phase and Reduce phase. In the Partition phase, PD data set is split into 6 group of data sets, each data set is formatted as value with instances. The intermediate result of classifier model is built in the Map phase. In Reducer phase, classifier is built from each value in value list and finally it produce a reduce classifier [31]. From the PD dataset of training data, C4.5 decision tree technique uses Information Gain Ratio (IGR) as criterion for finding a splitting attribute and applying a measurement function to all the other attributes. After determining the splitting attribute as Pitch Period Entropy (PPE) by the IGR, the instance space is partitioned into several parts. If the training cases belong to single class, then the algorithm will be terminated. Otherwise, the splitting process will be recursively performed until the whole partition is assigned to the same class [5]. After the creation of decision tree, classification rules is constructed for classify the new instance of unknown class labels.
size of records for given attribute aj. After MAP_COMPUTATION procedure computes the information and split information of aj, procedure REDUCE_COMPUTATION computes the information gain ratio. MAP_UPDATE_COUNT reads a record from attribute table with key value that equals to a best , and emits the count of class labels. Procedure MAP_HASH assigns node _ id, based on a hash value of a best to make sure that records with same values are split into the same partition.
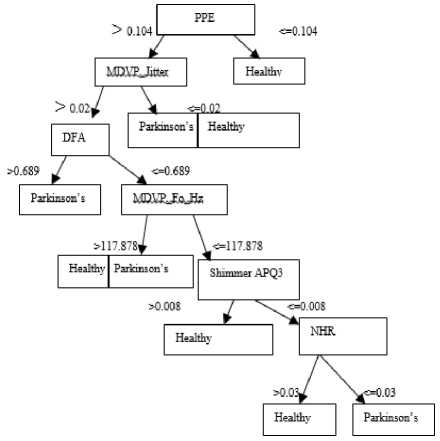
Fig.2. Decision Tree
There is some kind of deviation in voice measurement - it splits Jitter, shimmer and Noise Harmonic Ratio (NHR). Jitter and Shimmer is a variation of amplitude and frequency that reflect some specific irregularities in voice. In Fig. 2, the first node Pitch Period Entropy (PPE) follows two decisions. If the measured PPE value is <=0.104, then the people are consider as healthy. If it is greater than > 0.104, it undergoes next decision MDVP_Jitter. In the second decision if the value is <=0.02, then the people are healthy with 50% probability and if it is >0.02, it goes to next condition Detrented Fluctuation Analysis (DFA). If DFA value is >0.682, then the people are affected by PD. If it is <= 0.682, then the procedure is repeated in other nodes RPDE, shimmer APQ3 and NHR.
SVM performs classification by constructing an N-dimensional hyperplane that optimally separates the input dataset into two categories namely PD and healthy. It is used to transform an original training dataset into a higher dimension by using nonlinear mapping. It finds the hyperplane using its support vectors and margins [27]. SVM is a supervised learning model that analyze data and recognize the patterns for the appropriate target classes. Using a kernel function, SVM is solved in each Mapper phase. The reducer phase can be used to train second SVM using training data from mapper [32]
ANN is a supervised learning and it is derived from the functionality of human brains. ANN is a collection of unit in which each unit is allocated by weight. There are three types of layers in ANN input layer, output layer and hidden layer. Here, the hidden layer has to detect the relevant features of disease. ANN is designed with several nodes that are inter connected with links. Each node will be allocated based on its weight [19]. The data passes throw input layer which is multiplied by its weight. Number of class is based on number of nodes in output layer. If this classifier algorithm contains any error it should perform back-prorogation. A popular ANN architecture is called multi-layer perceptron (MLP) with back-propagation (a supervised learning algorithm). The MLP is a powerful function approximator for prediction and classification problems. The MLP is essentially the collection of nonlinear neurons or perceptron organized and connected to each other in a feed forward multi-layer structure. The experimental has also proved the notion that for this type of classification problems, MLP performs better than other ANN architectures such as radial basis function (RBF), recurrent neural network (RNN), and self-organizing map (SOM) [6].
-
IV. Results and Discussion
The dataset retrieved from UCI machine learning repository is used for this method. The dataset contains name, MDVP:Fo(Hz), MDVP:Fhi(Hz), MDVP:Flo(Hz), MDVP:Jitter(%), MDVP: Jitter(Abs), MDVP:RAP,
MDVP:PPQ, Jitter:DDP, MDVP:Shimmer,
MDVP:Shimmer(dB), Shimmer:APQ3, Shimmer:APQ5, MDVP:APQ, Shimmer:DDA, NHR, HNR, status, RPDE, DFA, spread1, spread2, D2, PPE attributes which are explained in Table 1. It includes attribute id, names of attributes and description of the attribute.
Experiments are run in Hadoop cluster which is established using desktops and a storage array is to evaluate the performance of the proposed approach. A Hadoop cluster is configured using a
HPSTORAGEWORKS X1600 G2:Processor: Intel R Xeon R processor E5520 2.26 GHz; 1Standard, up to 2 supported / Memory: 6GB (3X2GB)/ Storage Controller: Smart Array P212 with 512MBBBWCController with 1internal SAS port for expansion and a PC with 2.11 GHz dual-core CPU, 1G RAM and 200G hard disk. Two desktops with the following configuration HP Elite 7100 Business PC with Intel core i3 540 processor, 3.06 GHZ, 2GB RAM, and 320 GB are used to form the Hadoop cluster. Hard disks are connected as Hadoop nodes to perform the front end tasks seamlessly. There are 8 cores that are formed in the storage array and two desktops are two other cores that are added up in this eco system to form a Hadoop cluster which stores comfortably the large size datasets effectively. The Data node contains PD datasets that are divided into 6 groups and stored in storage array. Storage array is used to store the dataset and remaining systems are used for processing the dataset. HDFS and MapReduce nodes are deployed on each of the core. One of the core is named as HDFS NameNode and MapReduce JobTracker which is also referred as master node, and the remaining nodes act as HDFS DataNodes and MapReduce Task Trackers or slaves [4].
Big Data based predictive analytics is developed to predict the PD status accurately. Utilization of Big Data reduces the time taken for computation [4]. R (R3.1.3and R studio) analytic tool is used for the implementation of multi classifier methods. The proposed system uses Decision Tree, SVM and ANN sequentially and the results of these classifiers are taken based on the rank to predict the accuracy of PD correctly. In the process of prediction of healthy individual or PD person, the dataset is divided into 6 different datasets in order to get the complete and exhaustive information about the disease status. Medications, drug details, treatment prescriptions and other clinical tests that are to be taken for reviewing patients’ health status are suggested by the medical practitioners with ease with the help of the proposed system. Each dataset is divided into training and testing sets in the ratio of 70:30. The task of dividing the dataset into training set and testing set is to test the effectiveness of the proposed model.
Table 1. Description of PD dataset
|
ID |
NAME |
DESCRIPTION |
|
a1 |
MDVP:Fo(Hz) |
Average vocal fundamental frequency |
|
a2 |
MDVP:Fhi(Hz) |
Maximum vocal fundamental frequency |
|
a3 |
MDVP:Flo(Hz) |
Minimum vocal fundamental frequency |
|
a4 |
MDVP: Jitter(%) |
Kay pentax MDVP jitter as percentage |
|
a5 |
MDVP: Jitter(Abs) |
Kay Pentax MDVPabsolute jitter in microseconds |
|
a6 |
MDVP:RAP |
Kay Pentax MDVP relative amplitude perturbation |
|
a7 |
MDVP:PPQ |
Kay Pentax MDVP 5 point period perturbation quotient |
|
a8 |
Jitter:DDP |
Avg absolute difference of differences between cycles, divided by the avg period. |
|
a9 |
MDVP:Shimmer |
Kay Pentax MDVP local shimmer |
|
a10 |
MDVP:Shimmer(dB) |
Kay Pentax MDVP local shimmer in decibels |
|
a11 |
Shimmer:APQ3 |
3point amplitude perturbation quotient |
|
a12 |
Shimmer:APQ5 |
5-point amplitude perturbation quotient |
|
a13 |
MDVP:APQ |
Kay Pentax MDVP 11 point amplitude perturbation quotient |
|
a14 |
Shimmer:DDA |
measures of variation in amplitude |
|
a15 |
NHR |
Noise to Harmonic Ratio |
|
a16 |
HNR |
Harmonic to Noise Ratio |
|
a17 |
RPDE |
Recurrence Period Density Entropy |
|
a18 |
DFA |
Detrented Fluctuation Analysis |
|
a19 |
Spread1, Spread2 |
Non Linear measure of fundamental frequency |
|
a20 |
D2 |
Correlation dimension |
|
a21 |
PPE |
Pitch Period Entropy |
|
a22 |
Status |
0-Healthy,1-PD |
The purpose of implementing multiple predictive models is that it is applied to disease datasets and each model has its own accuracy and results. The critical and vital part of the proposed implementation is that the best results among these classifiers are chosen for final decision. The model is built on complete-case based samples, as it has to be deployed in the healthcare domain which only provides estimated target scores for individuals with complete data. This machine learning approach built consciously on all-case analysis, which includes all cases regardless of the missing values. This method is to build a better data model, as it has the distinctive feature of minimizing likely prediction bias and maximizing the model’s utility.
C4.5, SVM and ANN are performing better than the other machine learning methods and these are preferred because of time efficiency of capable of implemented as a parallel version in big data environment [5]. In PD dataset, DFA, MDVP_fo_Hz, PPE, MDVP_jitter, shimmer APQ3, NHR which is depicted in Fig.2. The number of training instances in this experiment varies from 0.5 to 3 million.
Once the proposed algorithm’s performance is evaluated against the other relevant approaches, it is also essential that its accuracy, sensitivity and specificity are also tested. These are calculated based on the true positive (TP), false positive (FP), true negative (TN) and false negative (FN) measures.
sensitivity = * 100
specificity = TN+FP *100
Accuracy =
( TP+TN ) *100
(TP+TN+FP+FN)
Traditional analytical methods use C4.5, C-PLS, C-RT, C-CRT, LDA, Random Tree, SVM, ID3, and K –NN predominantly. Random tree [9] provides 100% accuracy to predict the person who is affected by PD. Though Random tree gives 100% accuracy in PD analysis, it does not give consistent results and behaves differently in different tools for different cases. In the proposed system, the classifier models are chosen in such a way that they where consistency and accuracy of prediction are of have consistency and reliability in their performance, as prime factors.
these models are deployed in the healthcare domain
Table 2. Classification Accuracy Model
|
Population (Milllion) |
Decision Tree |
SVM |
ANN |
||||||
|
Accuracy |
sensitivity |
specificity |
Accuracy |
sensitivity |
specificity |
Accuracy |
sensitivity |
specificity |
|
|
0.5 |
82.31 |
85 |
10 |
84.15 |
87 |
28 |
86.05 |
89 |
3 |
|
1.0 |
86 |
86 |
23 |
85.88 |
87 |
18 |
88 |
88 |
10 |
|
1.5 |
84.1 |
87 |
18 |
86.25 |
89 |
23 |
89.87 |
89 |
22 |
|
2.0 |
87.5 |
90 |
19 |
89.4 |
91 |
22 |
90.2 |
93 |
5 |
|
2.5 |
85.2 |
92 |
32 |
85.99 |
95 |
27 |
88.5 |
97 |
4 |
|
3.0 |
89 |
91 |
7 |
90.71 |
95 |
7 |
91 |
96 |
7 |
The Receiver Operating Characteristic (ROC) curve [30] is widely used graphical plot to evaluate the discriminative ability of diagnostic or prognostic tests which helps medical practitioners to identify diseased individuals from the healthier people. This plot is based on the sensitivity and for a binary classifier system as its discrimination threshold is varied. The diagnostic tests with binary disease will reflect the status of either healthy or diseased and it would identify the diseased individuals as diseased and healthy individuals as non diseased. However, this situation rarely occurred since distributions overlap the diseased and unhealthy population [30]. In general, are two types of diagnostic errors may occur when diagnosing patients namely False negative (FN) and False Positive (FP). FN happens when classifying a diseased persons as healthy people. FN occurs when classifying a healthy people as diseased persons. The case correctly identifying a diseased subject as diseased is called True Positive (TP) and the case correctly identifying a healthy subject as non-diseased is called True Negative (TN). The rate of TPs is commonly referred as “sensitivity” and the rate of TNs is referred as “specificity”. Sensitivity and specificity characterize the diagnostic accuracy under diseased and healthy population, respectively [30].
A diagnostic threshold is needed to create a diagnostic test for binary disease status. The values of sensitivity and specificity are computed to evaluate the test performance with the pre-specified diagnostic threshold value. As the threshold value decreases, sensitivity increases while specificity decreases.to assess the test discriminatory accuracy, a compromise is required between sensitivity and specificity. There is one common technique to evaluate the test performance of all possible threshold values is done by a graphical summary of the diagnostic accuracy, i.e. by plotting the pair of (1-specificity, sensitivity) for all possible threshold values to form a curve.
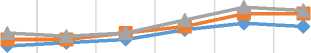
The ROC curve is plotted for the proposed approach which is depicted in Fig. 4. As specificity increases, sensitivity decreases and this kind of inverse linear relationship is clearly depicted from this ROC curve [24]. From this, one can clearly understand that as true positive rate increases, the false negative rate decreases automatically. The inference from this scenario is that the predictive accuracy against PD is having high probability.
The graphs depict the performance of the multi classifiers system. The computational performance is purely because of the faster implementation supported by the big data analytics framework. The fast learning of the classifier provides exploratory analyses to be rapidly performed in real-time medical diagnostic systems. In addition, concomitant reduction in response time is achieved because the learned knowledge is used instantly from the neural network and other classifier systems which build the knowledge from the start. In general, the values of sensitivity represents the probability of a diagnostic test identifies patients who have the disease. If sensitivity has higher value then the diagnostic test that will return lower value of false positive. Likewise, the values of specificity represents the probability of a test diagnoses a particular disease without giving falsepositive results. A perfectly accurate diagnostic test is a one which has high sensitivity and low specificity. Based on the specificity, sensitivity values and accuracy values the three classifiers can be used by the medical practitioners to diagnose accurately all truly diseased individuals as diseased and healthy individuals as nondiseased.
PREDICTIVE ACCURACY OF THE CLASSIFIERS
—•— DT —■— SVM —*—ANN
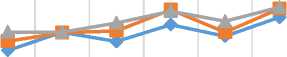
0.5 1 1.5 2 2.5 3
POPULATION
Fig.3. Predictive Accuracy of the classifiers
-
Fig.3. shows the accuracy of classifiers in different population. The values of sensitivity and specificity represent the probability of a diagnostic test which identifies patients who have the disease. A classifier produces high accuracy which has high sensitivity and low specificity. In each population, all the classifier produces the result. Among these multi classifiers, high
accuracy will be considered in all the populations to make a better decision. This will help the medical practitioners to provide appropriate treatment, suggest medications to the PD and thus ensure healthier life-style for the diseased ones.
MULTICLASSIFIER PERFORMANCE
—♦— DT —■— SVM —*—ANN н z 80 ^ 70
5 10 15 20 25 30
SPECIFICITY
-
Fig.4. Performance of the multi classifier
The way in which the prediction is done by TawseefAyoub Shaikh [6] in the Psychiatric data set is based on the probability of a disease. In this work, though Artificial Neural Network produces good accuracy, it takes more time. Sometimes misclassifications occur in this model due to the over fitting of data. The proposed multi classifier system reduces the computation time. This is purely because of the Hadoop MapReduce configuration [4]. In addition, it also produces optimum accuracy to predict the Parkinson’s disease at an early stage with the accuracy 88.22% which is shown in Fig. 3.
Chandrasekhar et al [12] have proposed a predictive model to predict the accuracy of PD. In this method decision tree provides high accuracy 85.08%. The Big Data based multi classifier system produces optimum accuracy 88.22%which is shown in Table 2. From the Fig. 3 and Fig.4, it is clearly understood that one can reliably prefer the results of SVM and ANN. As the insights derived from this analytics framework would play with the lives of the human beings, multiple classifiers are implemented and the consensus results are finally taken to manage PD effectively.
-
V. Conclusion
Big data analytics have a greater role to play in healthcare industries, as these data are diversified and complex in nature and huge in size. The dawn of the “Big data revolution” brings to the mankind a turning point and a unique moment in the history of patients’ data analysis that eclipses the traditions of the past. Recently, greater rise of tide in implementing medical information systems in big data as data analysts need no longer rely on traditional analytic methods that are developed largely to cope with the inherent challenges of using small data sets and running complex analyses on expensive configurations of hardware and software. Access to such larger datasets with powerful big data tools achieves greater accuracy, transparency, predictive power, and cost effective treatment. Big data analytics based multi classifiers system proposed in this paper is powered to experiment with the large Parkinson’s disease voice dataset and discover new opportunities and needs, expose greater variability, improve predictive performance and efficient time to answer cost effective actions. This approach represents a genuine leap forward and a clear opportunity to realize enormous gains in productivity, revenue, efficiency, and profitability. More importantly, this convergence provides healthcare organizations to analyze their large data sets quickly and efficiently. Early detection of any kind of disease is an important factor and this helps in treating the patients in advance. This system detects the maximum accuracy of classifier and consensus results of multi classifiers are taken to predict the disease earlier and to enhance the life time of PD people. In future,capacity and performance can be scaled by adding Data Nodes, and a single NameNode mechanism manages data placement and monitors server availability. For effective and efficient actionable insights, hybridized classifier based predictive analytics framework will be implemented in the improved NameNode and DataNode big data ecosystem.
References Parkinson's Brain Disease Prediction Using Big Data Analytics
- Michael Minelli, Michele Chambers, Ambiga Dhiraj. Big Data Big analytics: emerging business intelligence and analytics trend for today’s businesses, feb 2013.
- Parkinson’s disease, challenges, progress and promise: National Institute Of Neurological Disorder And Stroke, National Institute of Health, November 2004.
- Jiawai Han and Micheline Kamber. Data Mining Concepts and Techniques: second edition.
- Pravin Kumar and Vijay Singh Rathore. Efficient Capabilities of Processing of Big Data using Hadoop MapReduce: International Journal of Advanced Research in Computer and Communication Engineering June 2014; Vol: 3, Issue 6.
- Wei Dai and Wei Ji. A MapReduce Implementation of C4.5 Decision Tree Algorithm: International Journal of Database Theory and Application; Vol: 7, No.1 (2014), pp.49-60.
- TawseefAyoub Shaikh. A Prototype of Parkinson’s and Primary Tumor Diseases Prediction Using Data Mining Techniques: International Journal of Engineering Science Invention April 2014, Vol: 3 Issue 4, pp. 23-28.
- Anil Radhakrishnan and kirankalmadi.Big Data Medical Engine in the cloud (BDMEiC): your new Health Doctor: vol: 11 Nov 1, 2013.
- DivyaTomar and Sonali Agarwal. A survey on Data Mining approaches for Healthcare: International Journal of Bio-Science and Bio-Technology 2013, vol: 5.
- GeethaRamani R, Sivagami G, ShomanaGracia Jacob. Feature Relevance Analysis and Classification of Parkinson’s disease Tele-Monitoring data Through Data Mining: International Journal of Advanced Research in Computer Science and Software Engineering March 2012, Vol: 2.
- WhitePaper:Extract,Transform,and Load Big Data with ApacheHadoop,https://software.intel.com/sites/default/files/article/402274/etl-big-data-with-hadoop.pdf.
- Tarigoppula et al. Intelligent Parkinson Disease Prediction Using Machine Learning Algorithms: IJEIT September 2013, Vol: 3, Issue 3.
- Chandrashekhar Azad, Sanjay Jain, Vijay Kumar Jha. Design and Analysis of Data Mining Based Prediction Model for Parkinson’s disease: IJCSE.
- Dr.Hariganesh and Gracyannamary. Comparative study of Data Mining Approaches for Parkinson’s Disease: IJARCET september 2014, Vol: 3, Issue 9.
- Max A. Little, Patrick E. McSharry, Eric J. Hunter, Lorraine O. Ramig. Suitability of dysphonia measurements for telemonitoring of Parkinson's disease',IEEE Transactions on Biomedical Engineering 2008, https://archive.ics.uci.edu/ml/datasets/Parkinsons
- GeetaYadav, Yugal Kumar, GadadharSahoo. Predication of Parkinson's disease using data mining methods: A comparative analysis of tree, statistical, and support vector machine classifiers: Indian Journal of Medical Science, Vol: 65.
- IBM software, Descriptive, predictive, prescriptive: Transforming asset and facilities management with analytics: october2013.
- Lucas PJF, Abu-Hanna A. Prognostic methods in medicine: ArtifIntell Med 1999; 15: 105-19.
- TheNorman H.Nie. Rise of Big Data spurs a revolution in Big Data analytics: Revolution analytics.
- Shianghau Wu, JiannjongGuo. A Data Mining Analysis of the Parkinson’s disease: Scientific Research, iBusiness 2011, 3, 71-75.
- Genetics Home References, http://ghr.nlm.nih.gov/condition/parkinson-disease.
- HananelHazan et al. Early Diagnosis of Parkinson’sDisease via Machine Learning on Speech Data: 2012 IEEE 27-th Convention of Electrical and Electronics Engineers in Israel.
- MikeGualtieri. The Forrester Wave: Big Data Predictive Analytics Solutions, Q1 2013: February 2013.
- Jimeng Sun. Big Data Analytics for healthcare: Tutorial presentation at the SIAM InternationalConference on Data Mining, Austin, TX, 2013.
- Goncalves L,Subtil A,Rosario oliveira M and De Zea Bermdez P.ROC curve Estimation: An Overview: Revstat-Statistical journal November 1,march 2014,1-20;vol:12.
- Hoglinger GU, Rizk P, Muriel MP, Duyckaerts C, Oertel WH, Caille I, et al. Dopamine depletion impairs precursor cell proliferation in Parkinson disease: National Neuroscience 2004,7:726–35.
- Kolçe E, Frasheri N. Literature Review of Data Mining Techniques Used in Healthcare Databases: Paper presented at the ICT innovations 2012, Ohrid, Macadonia,September, 2012.
- David gila, magnus Johnson b. Diagnosing Parkinson by using Artificial Neural Networks and Support Vector Machines: Global Journal of Computer Science and Tchnology, pp. 63-71.
- Explore Big Data Analytics and Hadoop. [Online] http://www.ibm.com/developerworks/training/kp/os-kp-hadoop/
- http://www.pdf.org/en/surgical_treatments.
- Jingjing Yin. Overview of Inference about Roc Curve in Medical Diagnosis: Biometrics & Biostatistics International Journal December 2014; Vol: 1 Issue 3.
- Gong-Qing Wu et al. MReC4.5: C4.5 Ensemble Classification with MapReduce.
- Seyed Reza Pakize and Abolfazl Gandomi. Comparative Study of Classification Algorithms Based On MapReduce Model: International Journal of Innovative Research in Advanced Engineering August 2014; Vol: 1 Issue 7.
