Performance assessment of bacterial foraging based power system stabilizer in multi-machine power system

Author: Nader M.A. Ibrahim, Basem E. Elnaghi, Hamed A. Ibrahim, Hossam E.A. Talaat
Journal: International Journal of Intelligent Systems and Applications @ijisa
Article in issue: 7 vol.11, 2019.
Free access
This paper describes the process of power system stabilizer (PSS) optimization by using bacterial foraging (BG) to improve the power system stability and damping out the oscillation during large and small disturbances in a multi-machine power system. The proposed PSS type is P. Kundur (Lead-Lag) with speed deviation as the input signal. BG used to optimize the PSS gains. The proposed BG based delta w lead-lag PSS (P. Kundur structure) (BG-PSS) evaluated in the well-known benchmark simulation problem P. Kundur 4-machines 11-buses 2-areas power system. The BG-PSS compared with MB-PSS with simplified settings: IEEE® type PSS4B according to IEEE Std. 421.5, Conventional Delta w PSS (as the proposed PSS without optimization) from P. Kundur, and Conventional Acceleration Power (Delta Pa) PSS to demonstrate its robustness and superiority versus the three PSSs types to damp out the inter-area oscillations in a multi-machine power system. The damping ratio and the real part of the eigenvalues used as the fitness function in the optimization process. The nonlinear simulation results obtained in the MATLAB / SIMULINK environment prove that the proposed PSS is highly effective, robust, & superior to the other used controllers in restrictive the inter-area oscillation in a large power system & to maintain the wide-area stability of the system. Also, the performance indices eigenvalue analysis, peak overshoot, settling time, and steady-state error used to validate the superior oscillation damping and fast recovered transient dynamic behavior over the three considered controllers.
Multi-machine power system model, artificial intelligent, power system stabilizer optimization, bacterial foraging technique, performance indices
Short address: https://sciup.org/15016608
IDR: 15016608 | DOI: 10.5815/ijisa.2019.07.05
Text of the scientific article Performance assessment of bacterial foraging based power system stabilizer in multi-machine power system
Published Online July 2019 in MECS
Large interconnected power systems are complex and contain a large number of dissimilar dynamic components and devices that connected to each other to provide the electric service to the customer through the wide area. This widespread area requires isolated systems with different operating points and conditions due to economical operations cost [1].
Bulk power transfer in interconnected systems through long weak transmission lines leads to inter-area oscillation from 0.1 to 0.7 Hz. Additionally, the isolated systems suffering from local mode from 0.7 to 2 Hz. These low-frequency oscillations (LFOs) may disturb the system operation and limit the bulk power transfer and may lead to interconnected system separation and blackout [2, 3].
Automatic Voltage Regulator (AVR) with high gain used as a solution to the LFOs, when applied in the excitation system which may cause carriages an unfavorable effect upon the dynamic stability of the system by reducing the damping torque. A conventional power system stabilizer (CPSS) used to add a stabilizing signal to the AVR to increase the damping torque and improve the system stability [4, 5].
The CPSS composed of two stages. The gain stage, and the lead-lag stage, generally beside the washout filter with speed deviation as the input signal. In general, the CPSS strongly damps the local mode easily in some cases, but needs enhancements to generally damp LFOs types. This enhancement classified into three sets [6, 7].
Researchers found some lacks in GA performance, which looked at the application with greatly epistatic objective functions. Also, the hasty convergence of GA reduces its act and decreases the search capability [13, 15]
Secondly, PSS design, by robust & evolutionary control techniques as H ∞ control [16, 17], quantitative feedback theory [18], & sliding mode [19]. Thirdly, researchers work to enhance PSS performance by changing its structure, optimal and a suboptimal power system stabilizer [20], fractional-order proportionalintegral-differential (FOPID) controller [21], multi-band PSS [7, 22].
The use of adaptive control solves the problem of the robust control in a linear system, which contain parameters are unknown and changing with time. The adaptation in a nonlinear system need more calculation than the linear system. So, through the parameter valuation step, the state can escape to infinity in finite time. That makes it a very complicated challenge for the adaptive system [6, 8].
Generally, CPSS optimization methods in the first category have advantages over the other two categories, that the CPSS structure is simple and by tuning is robust and guarantee system stability improvement without a heavy mathematical effort in the adaptation process which may delay the signal of the PSS in the second category and without increasing the structure of the CPSS as in the third category [7].
The paper outlines: Section II power system model and PSS structure. Section III power system analysis. Section IV optimization technique. Section V simulation. Finally, section VI conclusion.
-
II. Power System Model and PSS Structure
-
A. Power system model
The power system model which used as a simulation problem is P. Kundur 4-machines 11-buses 2-areas power system. Fig.1., shown the one-line diagram of the system which its full details illustrated in [23].
The multi-machine system model described as differential equations, which stemmed from the model of the different devices that connected to each other as the generators, excitation systems, and controllers. In this work, the generators modeled by way of a d-q axis by using the 6-order model, and can be described by the following six differential equations [24]:
6 = ^ri - ШО1 (1)
qi
(-Ц
(P mi -P ei -D i (^ ri - D)
Xdi-Xdt
(Xdi-xd ^
(B)
(- edi +(x„i "X^V^ ^(x„i -Xq J^) ^ d i =
^ q i
(-e ; tedt ^-X^M t ^
У \ ‘do^di
(x di -xd )
)'d‘)
(- edt+edt +(x q-x^T^t-(xqi-Xq i))iqi) ^ ^ i = '
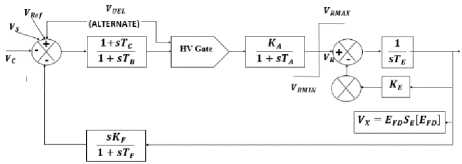
Fig.3. Type-DC1A-DC commutator exciter.
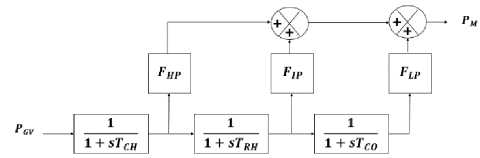
All generators in the system connected to tandem compound, single reheat prime mover steam turbine connected to speed governing system. The details of the speed governor and the steam turbine clarified in the IEEE committee report [25].
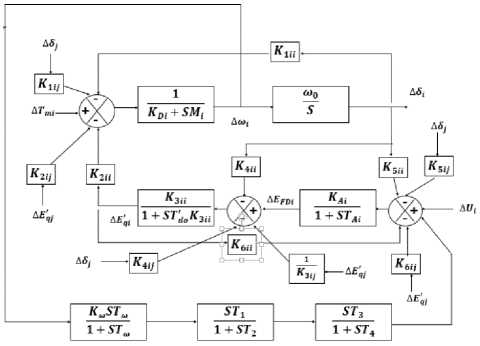
Fig.4. Heffron–Phillips block diagram of multi-machine power system without PSS.
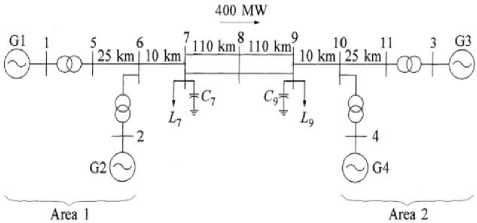
Fig.1. The one-line diagram of two area 4-machine 11-bus system.
(A)
-
B. Power system stabilizer
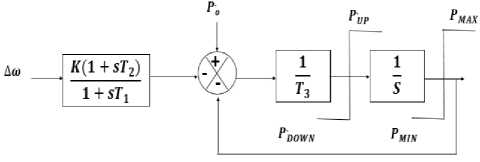
The function of the power system stabilizer (PSS) is to add damping torque according to the generator rotor oscillation by adding it to the AVR signal in the generator excitation system [23]. In this paper, the PSS type used is Delta w PSS P. Kundur (Lead-Lag) with speed deviation as input signal shown in fig.5., the data of the stabilizer described in [23].
The optimized parameters are the stabilizer gain K STAB , and the time constants T 1 , T 2 , & T 4 . The washout time constant TW selects to be 10 Sec. The time constants T1 & T3 considered as lead time constants equal to each other. Where, the time constants T2 & T4 are considered as lag time constants also, equal to each other.
-
III. Power System Analysis
The power system analysis process depends on the power system analysis toolbox (PSAT) version 2.1.8
which created by F. Milano and available for a free charge at [29]. The PSAT is a MATLAB toolbox used for static and dynamic analysis of the electric power system. The PSAT has its own built-in library to draw the power system.
Table 1. displays the Eigenvalue analysis of the system state matrix which computed by PSAT toolbox, and the dominant state variable that has high participation value in each mode.
Table 1. System modes without PSS
|
Eigenvalues |
Frequency |
Damping Ratio |
Most Associated States |
|
|
Real |
Imaginary |
|||
|
-0.78901 |
±7.1401 |
1.13638 |
0.1098 |
, |
|
-0.84036 |
±7.2535 |
1.154431 |
0.11508 |
, |
|
-0.13319 |
±3.4215 |
0.54454 |
0.038897 |
, 3 |
Furthermore, from the Eigenvalue, there are three swing modes, one inter-area, and two local modes. The two local modes accepted because of their damping ratio higher than 5%, which means the system is stable when exposed to this problem. However, the inter-area mode has a 0.035 restraining ratio, which makes the system goes to unstable and required additional damping torque from PSS to damp out this oscillation as quickly as possible.
The most associated variable called also the dominant variable. Its variables have a high participation factor in the dominant modes.
Fig.6., shown the compass plot for the mode shapes of the rotor angle modes. These mode shapes drawn from the right Eigenvectors which computed from the system Eigenvalues in the modes comprise a swing mode only.
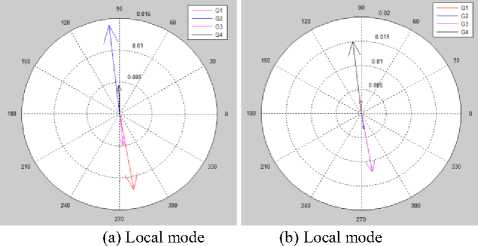
f = 1.1324 Hz , £ = 0.1128 f = 1.1545 Hz , £ = 0.11556
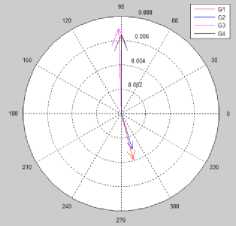
(c) Inter-area mode f = 0.5504Hz, ^ = 0.035084
Fig.6. The compass plot of the swing modes.
-
IV. Optimization Technique
The optimization technique used in this paper is an artificial intelligence technique called Bacterial Foraging Optimization Algorithm (BG) which, firstly, proposed by Passion in 2002. The BG based on the social foraging behavior Escherichia Coli (E. Coli) bacteria simulate the process of searching for foods in the human intestine [30]. The BG algorithm process involves four consecutive steps chemotaxis, swarming, reproduction, and elimination-dispersal [30].
In this paper, the BG toolbox used to consider as groups of M-files working in MATLAB background, which freely located at the Math-Work site [31].
The process of optimization depends on using the following (A) matrix which computed by state-space analysis from the Heffron–Phillip’s block diagram of the multi-machine power system shown in fig.4. when connected to a lead-lag PSS shown in fig.5. The input of the CPSS is , and the output signal of the CPSS used as input to the AVR block.
A11 A12
A21 A22
A31 A32
A41 A42
A13 A141
A23 A24
A33 A34
A43 A44-1
The first row of the combined full (A) matrix represents the first generator G1. Equation from 8 to 11 the full details of the first row of the (A) full matrix which define the self-matrix of the G1 at A11, and the effect of the other generators on it at (A12, A13, A14). It’s easy to derive the other rows of the (A) matrix as G1. The (A) matrix used as a function in the MATLAB, then these functions called from the BG M-file to search for the optimized value of the fifth parameters mentioned in the previous section. The optimized parameters showed in table 2.
|
0 |
^0 |
0 |
|
|
⎡ -к 111 |
0 |
-к 211 |
|
|
Ml |
|||
|
-к 411 |
0 |
-1 |
|
|
7 ʹ do |
311 d ʹ o |
||
|
-КдК 511 |
0 |
-КдК 611 |
|
|
A 11= |
ТА |
Тд |
|
|
-Кшк 111 |
0 |
—КШК 211 |
|
|
мт |
Ml |
||
|
-KtoK 111 В |
0 |
-KtoK 211 В |
|
|
МА |
МА |
||
|
-Кмк 111 ТА |
0 |
—КШК 211 ТА |
|
|
⎣ МАВ |
МАВ |
|
0 |
0 |
0 |
0⎤ |
|
0 |
0 |
0 |
0⎥ |
|
1 d ʹ o |
0 |
0 |
0⎥⎥ |
|
-1 Та |
0 |
0 |
0⎥ |
|
0 |
-1 тш |
0 |
0⎥ |
|
0 |
Тш-Т1 |
-1 |
0⎥⎥ |
|
ТМТ2 |
Т2 |
||
|
0 |
T3Tto-T3Ti |
Т2-Т3 |
-1 ⎥ |
|
ТШТ2Т1 |
та2 |
⎦ |
|
0 |
too |
0 |
0 |
0 |
0 |
0⎤ |
||
|
-к 112 мг |
0 |
-К 212 мг |
0 |
0 |
0 |
0 |
||
|
-к 412 |
0 |
-1 |
0 |
0 |
0 |
0 |
||
|
7 ʹ do |
К 312 Т d ʹ o |
|||||||
|
А 12 = |
-КдК 512 ТА |
0 |
-КдК 612 Тд |
0 |
0 |
0 |
0 |
|
|
-Кшк 112 мг |
0 |
-кшк 212 Ml |
0 |
0 |
0 |
0 |
||
|
"В,К 112 в МА |
0 |
-к,„к 212 71 МА |
0 |
0 |
0 |
0 |
||
|
-кмк 113 ВВ |
0 |
-кшк 212 ТА |
0 |
0 |
0 |
0⎦ |
||
|
⎣ МАВ |
МАВ |
|||||||
|
(9) |
||||||||
|
0 |
too |
0 |
|
|
-к 114 |
0 |
-к 214 |
|
|
⎢ |
Мт |
Ml |
|
|
⎢ |
-к 414 |
0 |
-1 |
|
⎢ |
7 ʹ do |
314 d ʹ o |
|
|
-КдК 514 |
0 |
-КдК 614 |
|
|
А 12 =⎢ |
ТА |
Тд |
|
|
-кшк 114 |
0 |
-Кшк 214 |
|
|
Мт |
Ml |
||
|
⎢ |
-Кшк 114 Т1 |
0 |
-KtoK 214 Т1 |
|
⎢ |
МА |
МА |
|
|
⎢ |
-кшк 114 ТА |
0 |
-кшк 214 ТА |
|
⎣ MiTA |
MiTA |
|
0 |
0 |
0 |
0⎤ |
|
0 |
0 |
0 |
0⎥ |
|
0 |
0 |
0 |
0⎥⎥⎥ |
|
0 |
0 |
0 |
0⎥ |
|
0 |
0 |
0 |
0⎥ |
|
0 |
0 |
0 |
0⎥⎥ |
|
0 |
0 |
0 |
0⎥ |
|
0 |
too |
0 |
0 |
0 |
0 |
0⎤ |
|
|
⎡ -к 113 Ml -К 413 7 ʹ do |
0 0 |
-К 213 Мт -1 313 d ʹ o |
0 0 |
0 0 |
0 0 |
0⎥ 0⎥ |
|
|
А 12 = |
-КдК 513 Тд |
0 |
-КдК 613 Тд |
0 |
0 |
0 |
0⎥ |
|
-Кшк 113 мт |
0 |
—КШК 213 Ml |
0 |
0 |
0 |
0⎥ |
|
|
-Кшк 113 В МА |
0 |
—КШК 213 1. МА |
0 |
0 |
0 |
0⎥⎥ |
|
|
-к,А 113 ТА ⎣ МАВ |
0 |
—КШК 213 ТА мат4 |
0 |
0 |
0 |
0⎥ |
Table 2. shows the optimized parameters that obtained when depending on maximizing the minimum damping ratio fitness function that helps the BG in optimizing the values better than minimizing the maximum real part of the eigenvalue fitness function. This optimized lead-lag PSS by using BG tested in the multi-machine power system to prove its robustness.
Table 2. The CPSS optimized parameters by using BG Algorithm.
|
The parameter |
The optimized Value |
|
^STAB |
48.6813 |
|
Т1 , тз |
0.036479 Sec. |
|
т2 , Г4 |
0.01 Sec. |
Performance of Three PSS for Interarea Oscillations
This demo requires the Control System Toolbox
Stop simulation if loss of synchronism
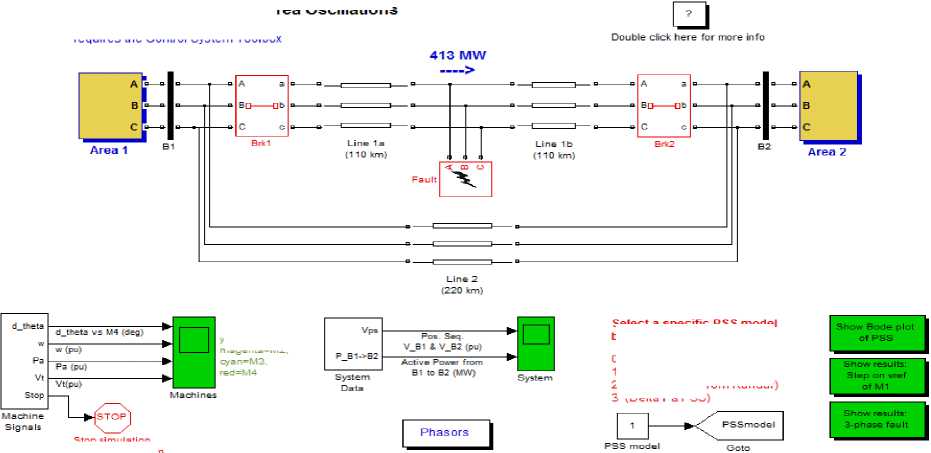
Fig.7. The Simulink multi-machine power system.
yellow™M1.
т>ядеп1э=М2.
select a specific pss model by typing:
0 (No PSS)
1 (MB-PSS)
2 (Delta w PSS from Kundur)
3 (Delta Pa PSS)
-
V. Simulation Work
The simulation process depends on the most popular P. KUNDUR 4-machines 11-buses 2-areas system connected by a tie transmission line 220Km length, which proposed, firstly, as a stability problem in [23].
The simulation process consists of two steps small and large signal performance assessment. Fig.7., shown the Simulink multi-machine power system which used in simulation steps.
-
A. Small signal stability assessment
In this stage, the reference voltage of generator G1 will be increased by 5% since 12-cycles (from 1 to 1.2 Sec.). The effect of increasing the voltage magnitude of G1 by 5% of the bulk power transferred when the system without PSS shown in fig. 8.
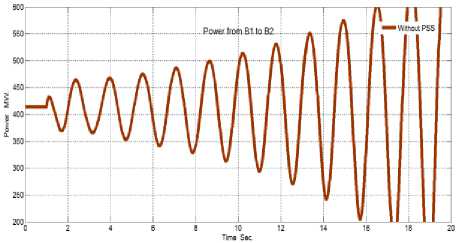
Fig.8. The effect of small signal test on the bulk power transferred when the system without PSS.
(a)
(b)
-
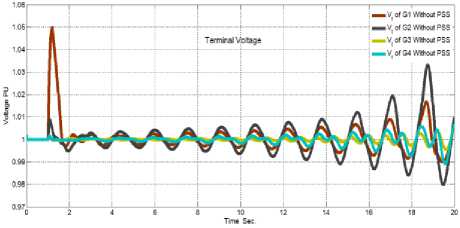
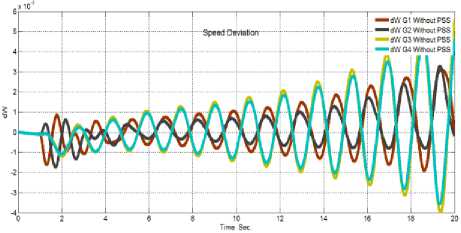
Fig.9. , (A & B) showed the speed deviation and the terminal voltage of the four generators after the reference voltage of generator G1 will be increased by 5% for 12-cycles without PSS, respectively.
The system response without PSS to the small signal assessment in the previous three figures displays that the system becomes unstable when exposed to these conditions. That is also, cleared from the Eigenvalue analysis the system is unstable without PSS.
-
Fig.10. , shown the effect of increasing the voltage magnitude of G1 by 5% for 12-cycles (from 1 to 1.2 Sec.) on the bulk power transferred when the system connected to BG based delta w lead-lag PSS (BG-PSS) in comparison to the system connected to the other three PSS: MB-PSS, Delta w lead-lag PSS, and Conventional Acceleration Power (Delta Pa) lead-lag PSS. Table 3. labels the LFO signal characteristics from fig.10.
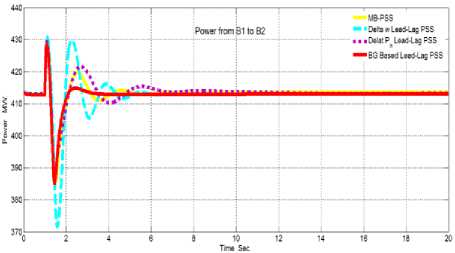
Fig.10. The effect of the small disturbance on the bulk power transferred when the system connected to BG-PSS in comparison to the system connected to the other three PSS: MB-PSS, Delta w lead-lag PSS, and Conventional Acceleration Power (Delta Pa) lead-lag PSS.
Table 3. The characteristics of bulk power transfer oscillation.
|
PSS Types |
Max. & Min. Overshoots In Percentage |
Settling Time Sec. |
Steady-State Error MW |
|
MB-PSS |
+4.0224% -35.8510% |
5.9450 |
+0.1286% |
|
Delta w Lead-Lag PSS |
+4.3198% -10.0208% |
4.9934 |
+0.0354% |
|
Delta P a Lead-Lag PSS |
+3.9908% -5.8564% |
9.3024 |
+0.0763% |
|
BG Based lead-lag PSS |
+3.7961% -6.7300% |
3.0601 |
+0.0020% |
-
Fig.10. , and table 3. shreds of evidence that the using of BG-PSS is robustness & superior to the other three PSS. That is because the maximum overshoot & the settling time in the bulk power transferred are smaller than the other three PSSs.
The steady-state error value in the case of the proposed BG-PSS is the closest to 413MW (the initial power transferred from area1 to area2), while its higher than the initial value by 1.9855e-005%.
-
Fig.11. , shown the speed deviation of G1 against increasing the voltage magnitude of G1 by 5% for 12-cycles when the system connected to BG-PSS in
comparison to the system connected to the other three PSS: MB-PSS, Delta w lead-lag PSS, and Conventional Acceleration Power (Delta Pa) lead-lag PSS. Table 4. describes the LFO signal characteristics from fig.11.
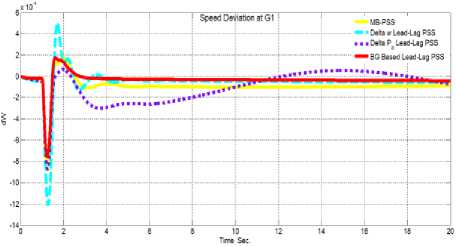
Fig.11. The system speed deviation response to the small disturbance when the system connected to BG-PSS in comparison to the system connected to the other three PSS: MB-PSS, Delta w lead-lag PSS, and Conventional Acceleration Power (Delta Pa) lead-lag PSS.
Table 4. The characteristics of the speed deviation oscillation.
|
PSS Types |
Max. & Min. Overshoot. |
Settling Time Sec. |
Steady-State Error |
|
MB-PSS |
+1.748e-4 -8.7674e-4 |
4.3624 |
-9.2822e-5 |
|
Delta w Lead-Lag PSS |
5.046e-4 -0.0012 |
5.3583 |
-5.733e-5 |
|
Delta P a Lead-Lag PSS |
6.498e-5 -8.739e-4 |
19.5755 |
-7.852e-5 |
|
BG Based lead-lag PSS |
+1.751e-4 -7.557e-4 |
5.8994 |
-4.8344e-5 |
So, it’s clear that the proposed BG-PSS is superior to the other three PSS and have the best performance in damping the small signal stability in comparison with the other PSSs.
-
Fig.12. , shows the effect of growing the voltage magnitude of G1 by 5% for 12-cycles on the terminal voltage of generator G1 when the system connected to BG-PSS in comparison to the system connected to the other three PSS: MB-PSS, Delta w lead-lag PSS, and Conventional Acceleration Power (Delta Pa) lead-lag PSS. Table 5 terms the LFO signal characteristics of fig.12.
Table 5. The characteristics of the G1 terminal voltage oscillation.
|
PSS Types |
Maximum Overshoot P.U. |
Settling Time Sec. |
Steady-State Error P.U. |
|
MB-PSS |
1.0330 0.9970 |
5.8000 |
1.0001 |
|
Delta w Lead-Lag PSS |
1.0403 0.9972 |
3.0530 |
1.00002 |
|
Delta P a Lead-Lag PSS |
1.0320 0.9959 |
9.5635 |
1.000025 |
|
BG Based lead-lag PSS |
1.0299 0.9929 |
2.9182 |
1.00001 |
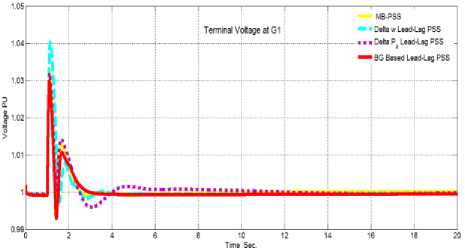
Fig.12. The effect of small disturbance on the terminal voltage of G1 when the system connected to BG-PSS in comparison to the system connected to the other three PSS: MB-PSS, Delta w lead-lag PSS, and Conventional Acceleration Power (Delta Pa) lead-lag PSS.
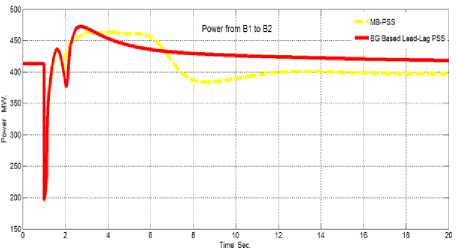
Fig.13. The effect of clearing three-phase fault after 8-cycles on the bulk power transferred when the system connected to BG-PSS in comparison to the MB-PSS.
The small signal assessment illustrates that the proposed BG-PSS stronger than the other three PSS in damp the inter-area oscillation. On the other hand, the delta w lead-lag and delta Pa lead-lag PSSs are the weakest in damp the inter-area oscillation, respectively.
So, in the next section (the large signal assessment) the delta w lead-lag and delta Pa lead-lag PSSs neglected to simplify and clarify the graphs.
-
B. Large signal assessment
This assessment tests the robustness of the PSSs with veneration to changing operating condition, which makes it a very rough test to show the PSSs superiority.
Fig.13., shows the effect of clearing three-phase fault after 8 cycles on the bulk power transferred from the area (1) to the area (2) when the system connected to BG-PSS in comparison to the system connected to the MB-PSS. Table 6 defines the LFO signal characteristics from fig.13.
Table 6. The characteristics of the bulk power transfer oscillation.
|
PSS Types |
Max. & Min Overshoot MW |
Settling Time Sec. |
Steady-State Error In Percentage |
|
MB-PSS |
+12.2929% -52.47% |
10.6787 |
-3.8354% |
|
BG Based lead-lag PSS |
+14.3543% -8.6722% |
13.6240 |
+1.1792% |
But there is a problem in the case of using MB-PSS against this test that the power transferred is limited by 3.83% of the normal value, which means that the MB-PSS doesn’t improve the system stability sufficiently, because the inter-area oscillation essentially limits the bulk power transfer and the MB-PSS can’t give back the power to its normal (initial) amplitude to make the system work adequately by serving the load with the required power level.
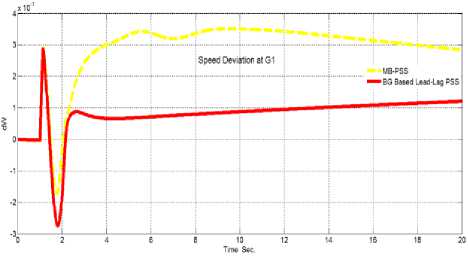
Fig.14. The system speed deviation response of clearing three phase fault after 8-cycles when the system connected to BG-PSS in comparison to the MB-PSS.
Table 7. The characteristics of the speed deviation oscillation.
|
PSS Types |
Max. & Min Overshoot |
Settling Time Sec. |
Steady-State Error |
|
MB-PSS |
0.0035 -0.0017 |
18.7186 |
2.8374e-3 |
|
BG Based lead-lag PSS |
0.0029 -0.0028 |
17.4077 |
1.203e-3 |
Fig.14., illustrates the speed deviation of G1 response against clearing three-phase fault after 8-cycles when the four generators in the system connected to the BG-PSS and MB-PSS. Table 7. describes the LFO signal characteristics from fig.14.
Fig.15., shows the effect of clearing three-phase fault after 8-cycles on the terminal voltage of generator G1 when all the generators in the system connected to BG-PSS versus the MB-PSS. Table 8 explains the LFO signal characteristics from Fig.15.
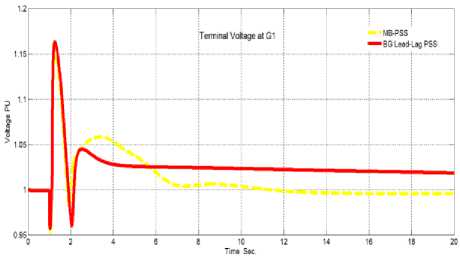
Fig.15. The effect of clearing three-phase fault after 8-cycles on the terminal voltage of generator G1 when the system connected to BG-PSS in comparison to the MB-PSS.
Table 8. The characteristics of the G1 terminal voltage oscillation.
|
PSS Types |
Max. & Min Overshoot |
Settling Time Sec. |
Steady-State Error |
|
MB-PSS |
1.1510 0.9536 |
11.9181 |
0.992 |
|
BG Based lead-lag PSS |
1.1634 0.9606 |
12.5431 |
1.0186 |
From table 8. and Fig. 15. shows that the steady-state error in the two cases is diverse from the initial value which is unity per unit because it’s normally to go to a new operating point after the SC because one of the two tie lines (which connect the two areas) opened.
But the important object is the level of the power transferred because if the required power doesn’t transport from the area (1) to the area (2) the loads on area (2) wouldn’t serve satisfactorily.
The important problem is that the limited value of power in the case of the MB-PSS (3.83%) not a high value which makes the system goes to isolation the blackout in some parts, but if the SC occurred than the used test, it can happen. Continuously, the tests demonstrate that the MB-PSS does not improve the power system stability sufficiently when compared to the proposed BG based lead-lag PSS.
Finally, the goals of this work attained by using the BG to optimize the delta w lead-lag PSS (P. Kundur construction), makes it superior to the other three PSSs and make it more robust in damping the inter-area oscillation which improves the overall system stability effectively.
-
VI. Conclusion
This paper proposed the using of the bacterial foraging algorithm (BG) to optimize the parameter of the delta w lead-lag power system stabilizer (PSS) (P. Kundur structure). Delta w means the speed deviation is the input signal to the PSS. The objective of this proposal is to improve this PSS performance in damping the inter-area oscillation and improve the system stability.
The well-known P. Kundur multi-machine 4-generators 11-buses 2-areas workbench system in the MATLAB program used to test the BG based lead-lag PSS. The system analyzed by using the Power System Analysis Toolbox (PSAT) in MATLAB platform. The state-space analysis used to compute the (A) matrix from the Heffron–Phillips multi-machine power system block diagram to use it in the PSS parameter optimization.
The test procedure applied on the MATLAB / SIMULINK in two test parts firstly small signal assessment by increasing the reference voltage of generator G1 by 5% for 12-cycles. Secondly the large signal assessment by clearing three-phase short circuit after 8-cycles by opening one of the two tie lines which connected the system which makes it goes to a new point and strongly test the proposed PSS.
The Eigenvalue analysis, settling time, rise time, steady-state error, and the maximum overshoot used as indices to demonstrate the robustness and superiority in damping the inter-area oscillation against the other three PSSs.
References Performance assessment of bacterial foraging based power system stabilizer in multi-machine power system
- E. L. Miotto; P. Bueno ; E. D.Fortes; & etc., "Coordinated Tuning of the Parameters of PSS and POD Controllers Using Bioinspired Algorithms," IEEE Trans. on Ind. App. , vol. 54, no. 4, pp. 3845 - 3857, July-Aug. 2018.
- P. Dey; A. Bhattacharya; & etc., "Parameter tuning of power system stabilizer using a meta-heuristic algorithm," in 2017 Sec. Inter. Conf. on Elec., Comp. & Comm. Tech. (ICECCT), Coimbatore, India, 22-24 Feb. 2017.
- A. Salgotra; & S. Pan, "Model based PI power system stabilizer design for damping low frequency oscillations in power systems," ISA Trans., vol. 76, pp. 110-121, May 2018.
- D.K.Sambariya, & R. Prasad, "Robust tuning of power system stabilizer for small signal stability enhancement using metaheuristic bat algorithm," Inter. Jour. of Elec. Power & Ener. Sys., vol. 61, pp. 229-238, Oct. 2014.
- Nader M.A. Ibrahim, Hossam E. M. Attia, & etc., "Modified particle swarm optimization based proportional-derivative power system stabilizer," I.J. Intel. Sys. & App., vol. 7, no. 3, pp. 62-76, Feb. 2015.
- W. PeresaIvo, C. Silva, & etc., "Gradient based hybrid metaheuristics for robust tuning of power system stabilizers," Inter. Jour. of Elec. Power & Ener. Sys., vol. 95, pp. 47-72, Feb. 2018.
- H. K. Abdulkhader, J. Jacob, & etc., "Fractional-order lead-lag compensator-based multi-band power system stabiliser design using a hybrid dynamic GA-PSO algorithm," IET Gene., Trans. & Dist., vol. 12, no. 13, pp. 3248 - 3260, 19 July 2018.
- M. Khaleghi, M. Mohammadian, & etc., "Design of two power system stabilizers coordinately based on Strength Pareto Evolutionary Algorithm," in 2009 4th IEEE Conf. on Ind. Electro. & App., Xi'an, China, 25-27 May 2009.
- A. Khodabakhshian, & R. Hemmati, "Multi-machine power system stabilizer design by using cultural algorithms," Inter. Jour. of Elec. Power & Ener. Sys., vol. 44, no. 1, pp. 571-580, Jan. 2013.
- P. Dey, A. Bhattacharya, & etc. , "Parameter tuning of power system stabilizer using a meta-heuristic algorithm," in 2017 Sec. Inter. Conf. on Elec., Comp. and Comm. Tech. (ICECCT), Coimbatore, India, 22-24 Feb. 2017.
- S. Ekinci, & B. Hekimoglu, "Parameter optimization of power system stabilizer via Salp Swarm algorithm," in 2018 5th Inter. Conf. on Elec. and Electr. Eng. (ICEEE), Istanbul, Turkey, 3-5 May 2018.
- N. N. Islam, M. A. Hannan, & etc., "Power system stabilizer design using BAT optimization algorithm in multimachine power system," in 2013 IEEE Stu. Conf. on Rese. & Dev., Putrajaya, Malaysia, 16-17 Dec. 2013.
- M. Shafiullah, M. J. Rana, & etc., "Online tuning of power system stabilizer employing genetic programming for stability enhancement," Jour. of Elec. Sys. & Inf. Tech., 11 April 2018.
- T. Špoljarić , & I. Pavić, "Performance analysis of an ant lion optimizer in tuning generators' excitation controls in multi machine power system," in 2018 41st Inter. Conven. on Inf. & Comm. Tech., Electr. & Micr. (MIPRO), Opatija, Croatia, 21-25 May 2018.
- Rahman, & J. M. Saleh, "Hybrid bio-Inspired computational intelligence techniques for solving power system optimization problems: A comprehensive survey," Applied Soft Computing, vol. 69, pp. 72-130, Aug. 2018.
- F. Dib, & I. Boumhidi, "Optimal H∞control without reaching phase with the differential evolution PID based on PSS for multi-machine power system," in 2015 Intel. Sys. & Comp. Vis. (ISCV), Fez, Morocco, 25-26 March 2015.
- K. B. Meziane, & I. Boumhidi, "An interval type-2 fuzzy logic PSS with the optimal H∞tracking control for multi-machine power system," in 2015 Intel. Sys. & Comp. Vis. (ISCV), Fez, Morocco, 25-26 March 2015.
- A.F. Okou, M. Kelemen, & etc., "Towards a systematic procedure to design robust power system stabilizers," in 2000 Power Eng. Soci. Summer Meet. (Cat. No.00CH37134), Seattle, WA, USA, 16-20 July 2000.
- K. Saoudi, Z. Bouchama, & etc., "Design of a robust PSS using an indirect adaptive type-2 fuzzy sliding mode for a multi-machine power system," in 2016 8th Inter. Conf. on Model., Identi. & Cont. (ICMIC), Algiers, Algeria, 15-17 Nov. 2016.
- J. Talaq, "Optimal power system stabilizers for multi machine systems," Inter. Jour. of Elec. Power & Ene. Sys., vol. 43, no. 1, pp. 793-803, Dec. 2012.
- J. Morsali, R. Kazemzadeh, & etc. , "Introducing FOPID-PSS to increase small-signal stability of multi-machine power system," in 2015 23rd Iran. Conf. on Elec. Eng., Tehran, Iran, 10-14 May 2015.
- B. Dhouib, A. Kahouli, & etc., "A comparative study of performance of multi-band and conventional power system stabilizers to improve transient stability of multimachine power system," in 2016 17th Inter. Con. on Sci. & Techni. of Auto. Cont. & Comp. Eng. (STA), Sousse, Tunisia, 19-21 Dec. 2016.
- P. Kundur, Power System Stability and Control, New York USA: McGraw-Hill, Inc., 1994.
- A.R.Fereidounia, B.Vahidi, & etc., "Improvement of low frequency oscillation damping by allocation and design of power system stabilizers in the multi-machine power system," Inter. Jour. of Elec. Power & Ener. Sys., vol. 52, pp. 207-220, Nov. 2013.
- C. Report, "Dynamic Models for Steam and Hydro Turbines in Power System Studies," IEEE Trans. on Power Appar. & Sys., Vols. PAS-92, no. 6, pp. 1904 - 1915, Nov. 1973.
- Editors, "421.5-2005 - IEEE Recommended Practice for Excitation System Models for Power System Stability Studies," 21 Apr. 2006, IEEE.
- Y. Y. Hsu, & C. L. Chen, "Identification of optimum location for stabiliser applications using participation factors," IEE Proc. C - Generation, Transm. & Distr., vol. 134, no. 3, pp. 238 - 244, May 1987.
- F. P. Demello, & C. Concordia, "Concepts of Synchronous Machine Stability as Affected by Excitation Control," IEEE Trans. on Power Appar. & Sys. , Vols. PAS-88, no. 4, pp. 316 - 329, Apr. 1969.
- F. Milano, "Federico Milano's Webpage," University College Dublin, 6 Jan. 2013. [Online]. Available: http://faraday1.ucd.ie/psat.html. [Accessed 15 May 2018].
- P. K. Ray, S. R. Paital, & etc., "Swarm and bacterial foraging based optimal power system stabilizer for stability improvement," in 2016 IEEE Regi. 10 Conf. (TENCON), Singapore, Singapore, 22-25 Nov. 2016.
- w. korani, "File Exchange," Mathworks, 9 Jun. 2008.
- [Online].Available: https://www.mathworks.com/matlabcentral/fileexchange/20217-bacterial-foraging. [Accessed 10 May 2018].
- M. Klein, G. J. Rogers, & etc., "Analytical investigation of factors influencing PSS performance," IEEE Trans. on EC, vol. 7, no. 3, pp. 382-390, Sep. 1992.
