Performance-based pay - a new (mixed) payment scheme for Russian civil servants
 payment scheme for Russian civil servants")
Author: Grinberg Ruslan S., Akhunov Rustem R., Volodin Andrey I., Gubarev Roman V., Dzyuba Evgeniy I.
Journal: Economic and Social Changes: Facts, Trends, Forecast @volnc-esc-en
Section: Labor economics
Article in issue: 6 (60) т.11, 2018.
Free access
We have developed a fundamentally new approach to the provision of financial incentives (bonuses) to civil servants, which does not contradict the concept of new public management (NPM) and has a certain similarity with the corporate (Asian) performance-based type of remuneration system. In the context of our study, “performance” means socio-economic development of Russian regions. We develop and test our methodology in two successive stages: first, we carry out a retrospective assessment of the level of development of Russia's constituent entities (according to regional statistics), and then we calculate the amount of bonuses paid to civil servants according to their performance. Based on the level of socio-economic development, we solve the problem of clustering of Russian regions with the use of neuromodeling. The prognostic function is implemented on the basis of neural network technologies (through the development of appropriate Bayesian ensemble of dynamic neuromodules)...
Evaluation of public administration efficiency, socio-economic development, constituent entities of the russian federation, neuromodeling, performance-based remuneration of civil servants, progressive scale, budget expenditures
Short address: https://sciup.org/147224108
IDR: 147224108 | UDC: 331.2 | DOI: 10.15838/esc.2018.6.60.10
Text of the scientific article Performance-based pay - a new (mixed) payment scheme for Russian civil servants
Introduction. The global trend is to reform national public administration systems by observing the key principle (management and performance-based remuneration of civil servants) of the New Public Management paradigm (NPM) [1]. The analysis of Russian and foreign studies on performance-based public administration systems indicates the presence of both positive [2] and negative [3] effects of their implementation. However, the latter does not imply a decreased interest of the leadership of the world countries and their regions (Russia is not an exception) in the NPM, i.e. introducing the reform of the current performance-based public administration system [4]. At present, the amount of incentive payments (bonuses) to Russian civil servants is at best determined on the basis of assessed individual performance indicators without taking into account collective “results” of the activity [5]. Moreover, the considered above amount in Russia is “not tied” to the achieved level of country’s socio-economic performance-based remuneration of civil servants, development, ensuring the effectiveness of the public administration system.
The novelty of the study and its results is as follows:
-
1) effectiveness of the modern public administration system in Russia is evaluated;
-
2) foreign experience of reforming the civil service is studied by briefly considering several most well-known public administration paradigms;
-
3) features of different types of foreign remuneration systems of civil servants and their main shortcomings are singled out;
-
4) key theoretical and methodological features of the author’s method of performancebased remuneration of Russian civil servants are disclosed;
-
5) testing of this method is carried out on the data of regional statistics of Russia for the period of 2011–20161.
Evaluation of the effectiveness of the modern Russian public administration system. The study tries to assess the effectiveness of the modern Russian public administration system on the basis of results of theoretical and empirical studies, including foreign ones.
The relevance of this assessment is confirmed by numerous, including interdisciplinary, researches of Russian political scientists, sociologists and economists. V.A. Ilyin and M.V. Morev in their work [6] identify and analyze a wide range of key problems of the modern Russian public administration system by determining cause-and-effect relations. According to the study results, these co-authors make a conclusion about “the need for the President to make tough decisions to enhance the efficiency of the public administration system”.
At first we consider the Russian public administration performance in terms of the new ranking (key sub-ratings), the Legatum Prosperity Index2 ( Fig. 1 ). Annually published by the Legatum Institute, the British analytical center, this index comprises 149 world countries. The choice of the rating is not accidental, as it is widely popular abroad and, in our opinion, characterized by methodological elaboration of the index (subindices) formation. The Legatum Prosperity Index is determined on the basis of 104 socioeconomic indicators, united in 9 groups (sub-ratings): economy, entrepreneurship, public administration, personal freedoms, social capital, security, education, health and environment. It is a composite indicator, as it is based not only on statistical analysis, but also on sociological research and expert assessments of survey participants.
According to the figure, Russia occupies places between India (100th place) and Tajikistan (102nd place), which can not be described as prosperous countries with effective public administration systems, developed economies and a high degree of social protection of their population. It should be noted that the Russian Federation ranks 70th by the key sub-rating, such as economy with the above average development level, i.e. the country occupies a much higher place than in the final ranking (101st place). As for the other two main sub-ratings (state management and social capital), the reversed situation is observed in our country. Thus, according to the subratings, public administration and social capital in the Russian Federation are characterized by a low development level, and the country ranges only 115th and 130th, respectively.
If we question the international experts’ assessment of Russia’s prosperity due to the politicization of its place in the Legatum Prosperity Index, the low public administration performance in Russia is confirmed by the results of quantitative and qualitative analysis of such a system.
In particular, it should be noted that the modern hierarchical system of public administration in Russia, unlike all world countries, is not two-tier (country – regions), but three-tier (country – macro-regions – RF subjects). So, nowadays all the subjects are united in 8 federal districts (macro-regions). The presence of an additional level in the public administration structure indirectly indicates its low efficiency and the state authorities’ attempt to adequately respond to numerous “challenges” in the socio-economic sphere due to the extensive development way of the civil service. This is indicated by the federal government structure, formed not only on the functional, but also on the geographical basis.
Figure 1. Russia’s place in the Legatum Prosperity Index
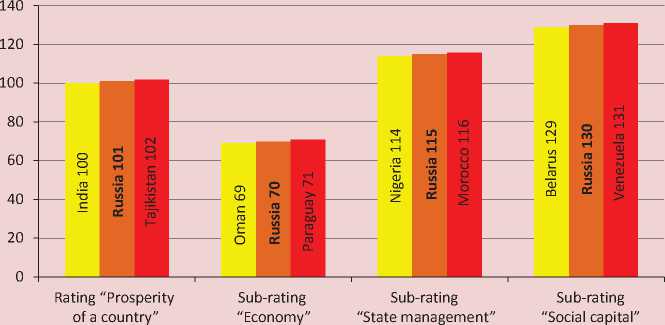
Source: compiled by the authors according to the Legatum Prosperity Index.
Thus, currently its composition includes the Ministries for the Development of the Far East and the North Caucasus3.
The main quantitative analysis results based on the calculated and interpreted coefficients (bureaucratization and remuneration) of the civil service efficiency by the method of G.A. Borshchevskii [7] are presented in the work [8]. Therefore, in the current study we just supplement this analysis by calculating and interpreting at least two more informative coefficients (expenditure and utility) of the civil service performance according to the above method. The data of the Russian statistics for 2011–2016 is the information base of the quantitative analysis of the national public administration system4.
The first coefficient (expenditure) shows a share of budget costs on the civil service in the total budget expenditure of the country.
In 2011–2012 and 2015–2016, the indicator increased from 22 to 22.4% and from 23.9 to 24.4%, respectively. In 2013–2014 the cost ratio was fixed at the same level – 22.9%. Hence, it is clear that the growth in the indicator dynamics during both the two sub-periods and the entire period under analysis means a rise in the burden on the budget in terms of financing civil service. This trend cannot be considered positive in terms of civil service efficiency.
The second coefficient (utility) is determined by means of the matrix of the dynamics of budget expenditures on civil service and GDP per capita. In 2011–2016 there was an annual growth in GDP per capita against the background of increased budget expenditures on public service (both indicators are expressed in current prices). This corresponds to the second matrix quadrant, which indicates an intermediate state of civil service performance, i.e. there are not only real opportunities to improve civil service efficiency, but also risks of its decline in the future.
Hence, the calculation and interpretation of two more coefficients (expenditures and utility) of civil service performance also allows us to state the presence of certain serious problems and significant risks in this sphere. According to the research team, the country’s leadership needs to boost and reconsider the process of reforming civil service. In our opinion, in modern Russia the first priority is to solve the problem of transition from extensive to intensive development of national civil service, paying special attention to enhancement of personnel reserve quality, “reasonable” optimization of a civil servants number, and also to their material incentives, an important tool to ensure and improve public administration performance in a market economy.
Brief overview of the relevant literature . At present, not only the New Public Management paradigm is developing, but also fundamentally different concepts (paradigms) are actively forming. There are several popular paradigms alternative to the NPM in foreign countries, such as Good Governance – GG and Responsible Cosmopolitan State – RCS. At the same time, it should be noted that the boundaries between modern public administration paradigms are not clear, i.e. they are mixed by interpenetration and transformation of a number of key functions. Therefore, we briefly describe the development (evolution) of the above three paradigms.
The “Good Governance belongs to the modern era, characterized by the beginning and development of the administrative crisis. It is the reason why this paradigm has been of practice-oriented character since the very beginning of its development” [9]. Its principles are still described on the basis of the well-known UNESCO report.
“Nevertheless, the GG theoretical constructions stipulate the recognition of joint responsibility of the state, citizens and public organizations to solve modern public life problems” [10]. The “neoliberal solution” of the problems is to integrate various organizations into a state management system [11]. In this case, the state refuses to monopolize a number of functions; public organizations (so-called network interaction of actors) are actively involved in the management process [12], even including public services provision [13]. The work [9], in our opinion, describes a role of the state in the framework of the GG paradigm quite accurately. “The state acts as a regulatory (through the achievement of public consent), but not autonomous, part of this interaction network” [9].
Another paradigm, the RCS, appeared as an attempt to solve the problem of poorly structured national public administration systems. Indeed, at present there are different hierarchical management systems with serious organizational problems, expressed in the absence of a clear division of powers even within a certain ministry and department, the duplication of functions performed by such organizations, and, ultimately, the weak coordination of their actions, the inability to work as a single team. The paper [14] provides a fundamental requirement of the RCS paradigm, stipulating the need to build well-structured hierarchical management systems in different world countries with a possibility to form a so-called “global world state” in the future. Another study [15] specifies a mechanism to implement the above requirements: the effective functioning of such national administration systems should be achieved through compliance with certain general principles to guide the coordinated action of various ministries and departments in the framework of established regulations of organizations activities. It should be noted that today the RCS paradigm is actively applied in the practice of public administration in various countries, for example, New Zealand, Finland and Estonia. It helps solve a wide range of tasks, such as “establishment of clear coordination of the work of public authorities, introduction of multi-purpose allocations to achieve common goals, elimination of duplication of powers and “unnecessary” state bodies” [9].
With a number of different paradigms, it is the NPM concept that prevails in most prosperous (mostly European) countries of the world (e.g. Austria, Great Britain, Germany, Denmark, Italy, the Netherlands, Norway, Finland, France and Sweden). This conclusion can be made after analyzing works of foreign and Russian scientists involved in assessing the effectiveness of national public administration systems. There is a striking example of such studies, the monograph [16], “devoted to the comparative assessment of the impact of administrative reforms in European countries, focused on the ideas of new public management (NPM)” [17].
The NPM emergence was due to the state’s need to support (to overcome the crisis) large industrial corporations using traditional production technologies by transferring to an innovative way of development. Therefore, at first under this paradigm, the state management system was to provide high-quality public services and business – to actively introduce innovations [18]. In modern conditions, the role and functions of the state are being rethought in many world countries in order to adequately respond to numerous “demands” of civil society. The main goal of the NPM at present is to ensure sustainable socioeconomic development of territories through the so-called “economy liberalization” (the minimum possible regulatory impact on business), as well as the enhancement of quality and the expansion of a range of public services provided to citizens [19; 20]. The paper [9] characterizes the evolution of NPM theories. Within the framework of the study, we will specify key directions of their modifications. New NPM theories “build an improved hierarchy of functions of the state, highlighting cost efficiency improvement, supervision functions strengthening, programs and sectoral policies management, and regulatory functions enhancement” [9].
The NPM development, in turn, led to the evolution of performance-based civil servant remuneration systems in different countries. Currently, there is no single generally accepted classification of such systems. The research team’s stance on this issue is closest to the opinion of T.A. Zhuravleva, who, relying on a number of classification features, considers it possible to distinguish three types of remuneration systems for civil servants: career (Romano-German), corporate (Asian) and positional (Anglo-Saxon) [21]. Within the framework of the study, we describe their features briefly, emphasizing the main shortcomings.
The Romano-German civil servant remuneration system (used, for example, in Germany, France and Japan) is of grading character (civil servants, based on their positions, are combined into grades). The official salary size for each position is approved centrally (by the federal government) and reflected in the fixed wage schedule. Under this system, the salary size of a civil servant depends mainly on the position and experience. In this case, career prospects, i.e. an increase in social status over time, are the main incentive for effective activity of civil servants.
The Anglo-Saxon system of civil servant remuneration (used, for example, in Australia, the United Kingdom, Canada, New Zealand and the United States), unlike the previous type, is characterized by a high degree of decentralization, when determining salary of civil servants. Thus, authorities of ministries and departments, as well as their structural units, make decisions on the amount of official salaries and bonuses that, as a rule, are “tied’ to individual performance indicators, with the size of a relevant budget being the only limitation.
Finally, the Asian civil servant remuneration system (applied, for example, in Singapore and South Korea). This system is mixed (hybrid), i.e. it includes elements of the Romano-German and Anglo-Saxon systems. In this case, on the one hand, salary of a civil servant depends not only on the individual performance, but also on the level of socioeconomic development of a country.
At the same time, it should be noted that each type of the civil servant remuneration system has certain drawbacks. For example, the career remuneration system has practically no material incentives for civil servants to work hard for task achievement. The positional system is characterized by a lack of economically justified incentive payments to certain civil servants. Often their amount does not depend on the performance, but is dictated by political factors [22]. Thus, there are cases, when gender and racial (ethnic) differences influence the size of awards to civil servants in the Anglo-Saxon countries [22; 23].
The shortcomings of different types of civil servant remuneration systems boost their evolution.
At the same time, not all attempts to form mixed (combining elements of different types) remuneration systems for civil servants, in our opinion, can be considered successful. Thus, the system in China is a vivid example of an atypical system. The work [24] reflects key cause-and-effect relations of the Chinese leadership’s failed attempt to reform the civil service within the NPM paradigm. “due to a lack of specific indicators, it is difficult to ensure performance-based remuneration, which includes a significant share of informal income ... such a factor, as a lack of material incentives for civil servants, does not promote the formation of conditions for work focused on result achievement” [24].
It should be noted that currently, mainly abroad, considerable experience has been accumulated in awarding (material incentives) to civil servants, based on the assessment of their individual performance [25]. Collective performance-based civil servant remuneration with regard to socio-economic development of a country and its regions is another matter. There are several reasons for this. So, in particular, the introduction of foreign experience in the Russian management practice, according to G.A. Borschevskii, “is hindered by the insufficient understanding of how to assess a certain employee’s contribution to the state body functioning, and authorities’ attempts, in turn, to achieve development priorities of a region and a country as a whole. It becomes obvious that without the introduction of performance-based management at the public service system level, it is impossible to transfer to the assessment and performance-based remuneration at the individual employee level” [26].
With regard to the Russian citizens’ mentality and the formed political system, in our opinion, the Singapore civil servant remuneration system, based on binding individual performance indicators to the country ones, can be considered as a positive foreign experience. Surely, the necessary adaptation of this approach to the Russian reality is required. We briefly argue such a statement.
Due to the ongoing reforms, Lee Kuan Yew managed to transform Singapore from a third world country into one of the most prosperous countries in the world with a developed economy. Thus, in the new Legatum Prosperity Index5, Singapore ranks 17th, two places higher than the previous year. At the same time, according to international experts, Singapore has the second economy in the world, lagging behind only Sweden. According to A.I. Tatarkin’s opinion, which we share, “such transformations are possible only in the conditions of structural crises and when there is a high level of public trust in state bodies and confidence that the reforms are carried out competently and improve lives of most population” [27].
In our earlier published work we identified a critical complex task, which successful solution would contribute to the accelerated economic development of Russia. “We need to create such an economic structure that would be insured against any turbulence in the oil market. And this is a complex task that unites different policies – structural, technological, financial, regional, demographic. Here everything is so interconnected that it is impossible to do without close coordination of actions of different departments” [28].
Based on the above, the study set and solved the problem of developing a new (mixed) system of Russian civil servant remuneration in terms of collective incentive payments on the basis of positive foreign experience of performance-based awarding. At the same time, in our opinion, the main target setting for Russian civil servants is to ensure the work of different ministries and departments as a single team of managers (coordination of their activities is necessary).
Elaboration and testing of the author’s method of Russian civil servant performancebased remuneration . The method is intended for economically reasonable calculation of the amount of collective stimulating payments (performance-based awards) to employees of regional executive bodies. We consider the situation in regions, as the lion’s share of employees of state executive bodies belongs to the regional, not federal level of government, according to official data of the Federal State Statistics Service of the Russian Federation (Rosstat)6. In different years of the analyzed period, the indicator value varied from 94 to 97% of the total number of such employees.
It should be noted that at present the country’s leadership took certain steps in the field of assessing a socio-economic development level through the elaboration and approval of the appropriate methodology7. However, in our opinion, it has numerous methodological shortcomings [29], which hinder correct estimation of socio-economic development of Russian regions.
Therefore, the research team developed an alternative (in relation to the government) methodology. This method was tested on the data of regional statistics for 2011–2015 [29]. It helped identify a competitive position of any RF subject, but only for a certain year.
The work was continued and the express assessment of the public administration development in Russia was carried out. Based on the method of G.A. Borschevskii, two coefficients of the civil service efficiency (bureaucratization and remuneration) were calculated and analyzed. Most importantly, the author’s approach to the performancebased awarding of civil servants working in RF subjects, based on the alternative (in relation to the state) method to assess socio-economic development of regions, was disclosed. However, in contrast to the previous work, this methodology was improved by expanding the system of indicators, with cost indicators expressed in comparable prices (constant prices of a base year). And this, in turn, also helped correctly determine changes in the level of socio-economic development of each Russian region in the dynamics for a number of years.
This work is a final article of the cycle of authors’ research devoted to the evaluation and improvement of the Russian civil service performance through the elaboration and testing of the method for calculating the economically justified amount of collective incentive payments to civil servants working in regions of the country.
The development and testing of the method is carried out in two successive stages (and several sub-stages) [8].
The first stage includes a quantitative and qualitative assessment of socio-economic development of Russian regions.
At the first sub-stage a system of socioeconomic indicators of Russian regions is formed. The key problems in socio-economic development of the country and its regions are caused by the low efficiency of public administration. The scientific literature [28; 30–35] identifies the following problems: 1) pronounced export-raw material orientation of the economy; 2) deindustrialization (in our opinion, its essence is characterized by the so-called 4 “D” effect, the concept introduced into scientific circulation by S.D. Bodrunov); 3) low speed of economy transition to the innovative development path; 4) considerable part of the self-employed population which is the precariat (“an essentially new social layer fixing the alienation of considerable social groups, experiencing especially sophisticated forms of operation of their work, knowledge and qualification, not only from labor results, but also from society”); 5) developed shadow economy; 6) highest degree of population differentiation by the level of the monetary income. Nowadays the situation is aggravated by external pressure on the Russian economy – initiated by the US and supported by the EU sectoral sanctions against Russian organizations. Such sanctions limit the access of Russian economic entities not only to financial and investment resources, but also to advanced technologies.
Based on the above, two variants (the extended and main list of private indicators) of the system of socio-economic indicators of the country’s regions are formed; they are respectively presented in the works [8; 36]. Under the study the methodology was tested according to the second variant of the indicators system. We briefly describe its structure.
Thus, of all indicators the 8 indicator group characterizing activities of the key economic sectors, such as industry, trade, construction, agriculture and transport, is identified.
In addition, two significant groups of 6 and 5 indicators comprise indicators characterizing, respectively, the state of science, the innovative development of economy and the life quality of population in the country’s regions.
In turn, the first of the above two groups of indicators includes indicators that assess the innovative activity of organizations and the effectiveness of their investment activities in the country’s regions. The second group includes indicators characterizing the living standard of key social strata of Russia (working population, including the self-employed and pensioners). This group also comprises indicators that reflect the extent of poverty in the country (a proportion of the population with monetary income that does not reach the subsistence minimum) and the development of shadow economy (a share of other monetary incomes). Thus, according to Rosstat8, illegal (not officially recorded) salary of organizations employees comprises the lion’s share of other monetary incomes of population (about 92– 93% of their total value in different years of the analyzed period).
Thus, in our case, the system of 33 indicators combined into several groups is used to objectively assess socio-economic development of the country’s regions.
At the second sub-stage, the values of private indicators revealing socio-economic development of the Russian regions are normalized. In the framework of the study, we use not a variable (by year), but a constant comparison base for the normalization of each socio-economic indicator throughout the analyzed period.
The third sub-stage carries out a quantitative assessment of socio-economic development of the Russian regions. Nowadays the scientific community is still debating the use of differentiated weighting coefficients of private indicators to calculate an index or sub-indices. In order to ensure the objectivity of evaluation and the simplification of auxiliary calculations, the research team considers it appropriate to calculate aggregated indicators in the conditions of equivalence of private socioeconomic indicators.
The calculations are carried out in the space-time section, i.e. for each country’s region for a certain year. The results of such calculations and their interpretation are presented in the work [36].
At the fourth sub-stage the qualitative assessment of socio-economic development of the Russian regions is carried out. Relying on cluster analysis and applying neural network technologies, we group all RF subjects by the achieved level of socio-economic development (index) and values of three sub-indices (key economic sectors; science and innovation; living standard of region’s population) for 2011–2016. The clustering problem is solved by Kohonen’s method of self-organizing maps (SOM) in the software product Deductor Studio Lite 5.1. Automatically all RF subjects are united in 4 clusters. Other conditions for solving the clustering problem are set both by a researcher and automatically. We briefly describe such conditions. During the adjustment of the Kohonen map learning parameters, the researcher accepts the following conditions: the method of initial initialization of the map from the training set and the Gaussian neighborhood function. In this case, the speed and radius (at the beginning and end) of the learning, as well as the number of epochs through which one wants to mix the lines are set automatically.
In Table 1 the results of qualitative assessment of socio-economic development of the Russian regions are presented.
We briefly describe results of the cluster analysis. Thus, due to the reduced number of regions included in the cluster with a below-average development level from 29 in 2011 to 17 in 2016 there was a decrease in the share of relevant RF subjects (of their total number) by 15 points. We should also note a significant increase in the total share of Russian regions belonging to the clusters with very low and low levels of socio-economic development from 51.3 to 66.3%, i.e. by 15 points for the same period of time. In the relatively stable period (2011–2013) there was an annual decrease in the share of Russian regions that are part of the
Table 1. Qualitative assessment of socio-economic development of the Russian Federation for 2011–2016
|
Cluster |
RF subject |
Number of RF subjects in the cluster |
Level of socioeconomic development of RF subjects |
|
|
units |
in % to the total |
|||
|
2011 |
||||
|
First |
Cities of Moscow and Saint Petersburg, republics of Mordovia and Tatarstan, Lipetsk, Moscow, Nizhny Novgorod, Tyumen, Magadan and Sakhalin oblasts |
10 |
12.5 |
Average |
|
Second |
Belgorod, Vladimir, Voronezh, Kaluga, Kursk, Orel, Tula, Leningrad, Novgorod, Orenburg, Penza, Samara, Sverdlovsk, Chelyabinsk, Irkutsk, Kemerovo, Novosibirsk and Amur oblasts, republics of Karachay-Cherkessia, Udmurtia and Chuvashia, Stavropol, Krasnoyarsk, Perm Krai and Primorsky Krai, republics of Bashkortostan, Buryatia, Khakassia, Jewish Autonomous Oblast |
29 |
36.3 |
Below average |
|
Third |
Yaroslavl, Vologda, Murmansk and Tomsk oblasts, republics of Karelia, Komi and Sakha (Yakutia), Kamchatka Krai, Khabarovsk Krai, Chukotka Autonomous Okrug |
10 |
12.5 |
Low |
|
Fourth |
Bryansk, Ivanovo, Kostroma, Ryazan, Smolensk, Tambov, Tver, Arkhangelsk, Kaliningrad, Pskov, Astrakhan, Volgograd, Rostov, Kirov, Saratov, Ulyanovsk, Kurgan and Omsk oblasts, republics of Adygea, Kalmykia, Dagestan, Ingushetia, North Ossetia-Alania, Chechnya, Mari El, Altai, Tuva, Kabardino-Balkaria, Krasnodar Krai, Altai Krai, Zabaikalsky Krai |
31 |
38.8 |
Very low |
|
Total |
х |
80 |
100 |
х |
|
2012 |
||||
|
First |
Belgorod, Moscow, Tyumen, Magadan and Sakhalin oblasts, cities of Moscow and Saint Petersburg |
7 |
8.8 |
Average |
|
Second |
Vladimir, Kaluga, Lipetsk, Tula, Yaroslavl, Nizhny Novgorod, Samara, Sverdlovsk, Novosibirsk and Tomsk oblasts, Stavropol Krai, Primorsky Krai, republics of Mordovia, Tatarstan, Buryatia, Udmurtia and Chuvashia |
17 |
21.3 |
Below average |
|
Third |
Republics of Karelia, Komi and Sakha (Yakutia), Arkhangelsk, Vologda, Leningrad and Murmansk oblasts, Krasnoyarsk Krai, Kamchatka Krai and Khabarovsk Krai, Chukotka Autonomous Oblast |
11 |
13.8 |
Low |
|
Fourth |
Bryansk, Voronezh, Ivanovo, Kostroma, Kursk, Orel, Ryazan, Smolensk, Tambov, Tver, Kaliningrad, Novgorod, Pskov, Astrakhan, Volgograd, Rostov, Kirov, Orenburg, Penza, Saratov, Ulyanovsk, Kurgan, Chelyabinsk, Irkutsk, Kemerovo, Omsk and Amur oblasts, republics of Adygea, Kalmykia, Dagestan, Ingushetia, North Ossetia-Alania, Bashkortostan, Mari El, Altai, Tuva and Khakassia, Krasnodar Krai, Perm Krai, Altai Krai, Zabaikalsky Krai, republics of Kabardino-Balkaria, Karachay-Cherkessia and Chechnya, Jewish Autonomous Oblast |
45 |
56.3 |
Very low |
|
Total |
х |
80 |
100 |
х |
|
2013 |
||||
|
First |
Belgorod, Moscow, Tyumen and Sakhalin oblasts, cities of Moscow and Saint Petersburg |
6 |
7.5 |
Average |
|
Second |
Kaluga, Lipetsk, Yaroslavl, Leningrad, Nizhny Novgorod, Samara, Sverdlovsk, Novosibirsk, Tomsk and Magadan oblasts, republics of Mordovia and Tatarstan, Khabarovsk Krai |
13 |
16.3 |
Below average |
|
Third |
Vladimir, Voronezh, Kursk, Orel, Ryazan, Tambov, Tver, Tula, Arkhangelsk, Vologda, Kaliningrad, Murmansk, Novgorod, Pskov, Orenburg, Penza, Saratov, Chelyabinsk, Irkutsk and Amur oblasts, republics of Karelia, Komi, Bashkortostan, Khakassia, Sakha (Yakutia), Krasnodar Krai, Stavropol Krai, Perm Krai, Krasnoyarsk Krai, Kamchatka Krai, Primorsky Krai, republics of Udmurtia and Chuvashia, Jewish Autonomous Oblast, Chukotka Autonomous Okrug |
35 |
43.8 |
Low |
|
Fourth |
Bryansk, Ivanovo, Kostroma, Smolensk, Astrakhan, Volgograd, Rostov, Kirov, Ulyanovsk, Kurgan, Kemerovo and Omsk oblasts, republics of Adygea, Kalmykia, Dagestan, Ingushetia, North Ossetia-Alania, Mari El, Altai, Buryatia and Tuva, Kabardino-Balkaria, Karachay-Cherkessia and Chechnya, Altai Krai, Zabaikalsky Krai |
26 |
32.5 |
Very low |
|
Total |
х |
80 |
100 |
х |
End of Table 1
At the fifth sub-stage the short-term forecast for socio-economic development of the Russian regions is made. In the conditions of possible auditory shadowing of the regional statistics data, it is advisable to use neural network technologies. However, at this sub-stage, unlike the previous one, we solve two other problems, such as approximation and forecasting, by forming an adequate Bayesian ensemble of dynamic neural models in the special software product Neuro Solution for Excel 6.0.
Table 2 presents background information and basic terms of neural network modeling.
To ensure high accuracy of neural network modeling, “hard” boundary values of all three neural model adequacy indicators are set: the normalized mean-square error of the resulting indicator (NMSE) is less than 5%, the correlation coefficient between actual and theoretical (obtained during neural network modeling) values of the outcome variable ( r ) is more than 0.98 and the frequency criterion of resulting indicator quality ( P* ) is not less than 90%. Moreover, if the first two indicators are determined automatically in the software product, the latter indicator is calculated by the researcher under the condition of a relative error (approximation error) of no more than 5 and 8% for each observation from the testing sample.
Verification of the neural models helps specify their specification. In our case, the actual values of the socio-economic development index of the Russian regions are approximated by a nonlinear function :
A
Y = f ( X „ X 2, X 3 , X 4, X 5), (1)
where X1-X3 – the generalizing (aggregated) indicators characterizing sub-indices values: key economic sectors, science and innovation, living standard of region’s population; X4 – the time factor (calculated as a ratio of the serial number of
Table 2. Background and basic terms of neural network modeling
Table 3 discloses the architecture of the Bayesian ensemble of dynamic neural models (taking into account varied parameters – a number of hidden layers and a number of neurons in them).
On the basis of special features of the software product the number of neurons is varied in one hidden layer (within the limits set by the researcher) and constant in the other (fixed) during neural network modeling.
The activation function in the hidden layers and the output layer (hyperbolic tangent and linear, respectively) remains unchanged.
Table 4 shows verification results of the generated Bayesian ensemble of dynamic neural models.
The value of each indicator of the adequacy of the Bayesian ensemble of neural models from Table 4 is calculated by a simple arithmetic mean.
Verification of the neural network modeling results, i.e. analysis of the main indicators of the adequacy of the Bayesian ensemble of dynamic neural models, reveals the high accuracy of approximation of regional statistics data.
Therefore, an adequate Bayesian ensemble of dynamic neural models can also be used to predict socio-economic development of the Russian regions with a high degree of accuracy. As part of the study, we will make a short-term forecast (for 2017) for the leading regions and the Republic of Bashkortostan ( tab. 5 ).
In the study the short-term forecast of the incoming parameters of neural models (three sub-indices) is formed on the basis of average growth rates for 2011–2016 with regard to the assumption of their invariability in 2017.
Table 3. Architecture of the Bayesian ensemble of dynamic neural models
|
Neural network model |
Hidden layers number |
Discrete variable number of neurons (in increments of 1) |
Optimal number of neurons |
||
|
in the first hidden layer |
in the second hidden layer |
in the first hidden layer |
in the second hidden layer |
||
|
First neural network model (NNM1) |
1 |
1-10 |
- |
9 |
- |
|
Second neural network model (NNM2) |
1 |
1-5 |
- |
5 |
- |
|
Third neural network model (NNM3) |
1 |
7-15 |
- |
7 |
- |
|
Fourth neural network model (NNM4) |
2 |
- |
1-10 |
7 |
9 |
|
Fifth neural network model (NNM 5) |
2 |
1-10 |
- |
9 |
5 |
|
Source: compiled by the authors. |
|||||
Table 4. Verification results of the Bayesian ensemble of dynamic neural models
|
Neural network model |
NMSE |
r |
N* |
P* |
||
|
ε=5% |
ε=8% |
ε=5% |
ε=8% |
|||
|
NNM1 |
0.035 |
0.988 |
75 |
80 |
93.75 |
100 |
|
NNM2 |
0.043 |
0.981 |
73 |
80 |
91.25 |
100 |
|
NNM3 |
0.026 |
0.989 |
77 |
80 |
96.25 |
100 |
|
NNM4 |
0.039 |
0.982 |
75 |
79 |
93.75 |
98.75 |
|
NNM5 |
0.037 |
0.986 |
72 |
79 |
90 |
98.75 |
|
Bayesian ensemble of neural network models |
0.036 |
0.985 |
74 |
80 |
93 |
99.5 |
|
Source: compiled by the authors. |
||||||
Table 5. Results of the short-term (for 2017) forecasting of socio-economic development of Russian leading regions and the Republic of Bashkortostan
|
RF subject |
Forecasted values |
|||
|
Index of socioeconomic development of the region |
Sub-index “key economic sectors of the region” |
Sub-index “science and innovations of the region” |
Sub-index “Living standard of the region’s population” |
|
|
City of Moscow |
0.517 |
0.497 |
0.410 |
0.712 |
|
City of Saint-Petersburg |
0.490 |
0.546 |
0.330 |
0.648 |
|
Republic of bashkortostan |
0.349 |
0.306 |
0.214 |
0.545 |
|
Tyumen Oblast |
0.420 |
0.326 |
0.177 |
0.738 |
|
Sakhalin Oblast |
0.425 |
0.327 |
0.151 |
0.779 |
|
Source: compiled by the authors. |
||||
The forecast value of the socio-economic development index of RF subjects is the arithmetic mean of the outcome variable of the Bayesian ensemble of dynamic neural models.
Comparing the forecast values of the resulting indicator with the actual ones, we should note that, along with unchanged average growth rates of three sub-indices in 2017, the socio-economic development index of the city of Moscow, a leading Russian region, is expected to decrease to the lowest for the last 7 years. As a result of a 1.1% decrease in the sub-index “key economic sectors” even in the conditions of a 3.1% increase in the subindex “living standard of population of the country’s capital”, the forecasted decline in the resulting index amounts to 0.517, i.e. 0.8 and 3.4% compared to 2015–2016. An even more intensive decline in the socio-economic development index in 2017 is expected in leading regions, such as the Tyumen and Sakhalin oblasts, due to a decrease, respectively, in the sub-index “key sectors of region’s economy” by 3.2% and the sub-index “science and innovation of a region” by 11.4%, despite a rise in the value of the third main sub-index. So, for the above reasons, a short term reduction in the resulting indicator by 6.7 and 5.6% for the Tyumen Oblast and 6.9 and 6.5% for the Sakhalin Oblast compared to 2015–2016. The opposite situation is expected in another leading region, the city of Saint Petersburg. As a result of a 1.7% growth in the sub-index “living standard of region’s population” with less than 1% of multidirectional changes in the values of two other sub-indices in 2017, the socio-economic development index is expected to increase to 0.490, i.e. by 6.8 and 1.9% compared to 2015–2016. Also, due to a growth in the sub-indices “key economic sectors” and “living standard of region’s population” by 1.1 and 2.8%, respectively, in the short term, an increase in the resulting indicator in the Republic of Bashkortostan is projected to be 0.349, i.e. by 5 and 2.8% compared to 2015–2016. However, the “gap” in the index value between the Republic of Bashkortostan and leading regions will remain quite significant. This is due to the fact that, despite the relatively favorable socio-economic conditions, this RF subject is not expected to significantly develop science and improve the efficiency of innovation in the short term. Therefore, in modern conditions it is critical for the Republic to accelerate the transition of the regional economy to an innovative development trajectory.
Thus, summarizing the above, we can note that in 2017 some convergence of RF subjects by the level of socio-economic development is expected. However, this can not be clearly recognized as a positive trend, which is largely due to the projected weakening of competitive positions of leading regions in this area in the short term.
At the second stage the amount of performance-based bonuses for Russian civil servants is determined.
At the sixth sub-stage the progressive performance-based remuneration scale is developed. The scale helps solve two important tasks: first, ensure civil servants’ interest in achieving results of their activity, expressed in socio-economic development of the country’s regions, and second, in the effective spending of limited budgetary funds to pay wages to them. Using the analysis of existing collective wage systems [38] and taking into account the opinion of the Nobel Prize laureate R. Coase on the nature of transaction costs (he considers internal laws of functioning in commercial organizations and public institutions to be the same) [39], we propose to use L-type incentives for Russian civil servants, which means increased bonuses for civil servants in the country’s region as a result of the transition of the RF subject to another (with a higher socio-economic development level) cluster. Based on the above, the progressive scale is developed: the index of socio-economic development of the country’s regions – a level of civil servant performance-based bonuses, expressed as a percentage of the official salary. Taking into account retrospective assessment results, clustering and short-term forecasting, it is advisable (taking into account the possibility for Russian leading regions to transfer to a cluster with a higher socioeconomic development level) to single out 5 (of 7 possible) equal-width intervals of the index values, which correspond to a certain level of socio-economic development of the country’s regions. The method of expert assessments (chief and leading researchers of the Institute of Social and Economic Research of the Ufa Federal Research Center of the RAS served as experts) determines upper limits of the level of bonuses for civil servants for each index interval
Figure 2. Graphical presentation of the progressive scale of performance-based bonuses for civil servants
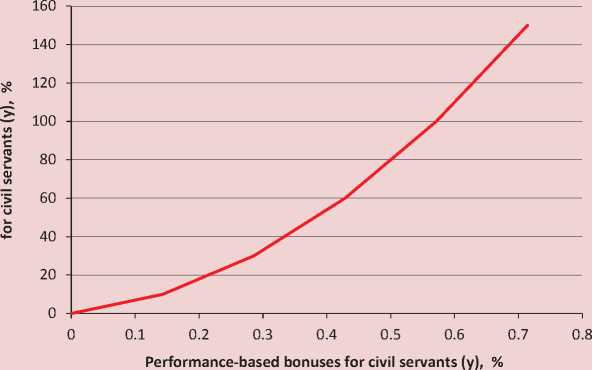
Source: compiled by the authors.
characterizing socio-economic development of the Russian Federation. The application of the game-theory approach reduces the subjectivity in the calculation of values of such boundaries. Graphically the progressive scale is shown in Figure 2 .
In a formalized form it is described by a system of piecewise linear functions:
70%, % G [0; 0,143];
140%- 10, % G [0,143; 0,286]; у = / 210%- 30, %G [0,286;0,429];
280%- 60, %G [0,429; 0,571];
<350% - 100,% G [0,571; 0,714].
The level of performance-based bonuses for civil servants for all RF subjects for 2011–2016 is calculated on the basis of earlier received results of the retrospective assessment of social and economic development of the Russian regions and the developed progressive scale.
In the work we make calculations for leading Russian regions and the Republic of Bashkortostan ( tab. 6 ).
Then the amount of performance-based bonuses for civil servants in the Russian regions is determined in comparable prices of the base year (2011).
Table 6. Level of performance-based bonuses for civil servants in leading Russian regions and the Republic of Bashkortostan in 2011–2016
|
RF subject |
Level of performance-based bonuses for civil servants, % (of the fixed salary) |
|||||
|
2011 |
2012 |
2013 |
2014 |
2015 |
2016 |
|
|
City of Moscow |
88.3 |
91.1 |
87.7 |
87.4 |
86.1 |
90.0 |
|
City of Saint-Petersburg |
72.2 |
73.4 |
73.1 |
71.9 |
68.5 |
74.6 |
|
Republic of Bashkortostan |
37.9 |
40.0 |
41.0 |
40.8 |
39.7 |
41.3 |
|
Tyumen Oblast |
65.9 |
68.4 |
69.2 |
68.9 |
66.0 |
64.4 |
|
Sakhalin Oblast |
67.5 |
71.5 |
72.6 |
74.1 |
67.9 |
67.4 |
|
Source: compiled by the authors. |
||||||
Figure 3. Structure of civil servants’ wages depending on the level of socio-economic development of the country’s regions
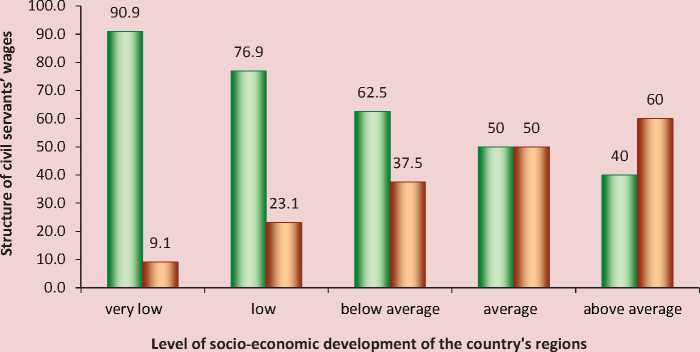
fixed salary bonuses
Source: compiled by the authors.
Finally, the amount of their bonuses is calculated in current prices of the respective year.
Figure 3 presents the structure of civil servants’ salaries in the Russian regions on condition of their performance-based awarding, according to the author’s method.
Such a structure for each level of socioeconomic development of the country’s regions is relevant provided that the upper limit of the corresponding percentage of bonuses (from the salary) of civil servants is achieved. In case of performance-based bonuses of civil servants the share of the constant part (fixed salary) of their wages decreases, when a country’s region transfers to a cluster with a higher socioeconomic development level.
This will make it possible to really get civil servants of the Russian regions “interested” in raising the level of their social and economic development. Also, effective spending of limited budget funds will be ensured under the new wage system.
It should be noted that in Russia the above method can be successfully implemented in practice only in case of curbed corruption. The corruption suppression mechanism on the basis of game-theory models on the example of tax inspection activity is disclosed in the work [40]. If adapted, this approach can be implemented in the practice of most Russian ministries and departments.
Conclusion. The first step of the radical solution to the problem of low efficiency of the public administration system, in our opinion, is to apply the author’s approach within the NPM concept (which has some similarities with the Asian remuneration system) in terms of collective material incentives for executive bodies employees in the country’s regions (performance-based bonuses) and to strengthen control over target expenditure of budgetary funds (through the elaboration and implementation of game-theory models in the practice of various ministries and departments).
The relevant method is developed and applied in several successive stages. The objectivity of retrospective assessment of the level of socio-economic development of the RF subjects is ensured due to their clustering on the basis of neural network technologies. Due to similar technologies, high accuracy of short-term forecasting is also achieved. The results of these sub-stages of the method serve as the basis for application of L-type collective material incentives for civil servants. In turn, the calculation of performance-based bonuses for civil servants is carried out on the basis of the preliminarily (within the key sub-step of the method) developed (by the method of expert estimates) progressive scale (the index of socioeconomic development of the Russian regions – the level of bonuses for civil servants).
The fundamentally new (combined) Russian civil servant remuneration system with L-type collective stimulation will facilitate the coordination of activities of ministries and departments in RF subjects due to “binding” collective incentive payments to the level of socio-economic development of the country’s regions. The practical application of this approach will also make it possible to strengthen control over targeted spending of the Russian budget.
The implementation of the author’s approach in the practice of public administration can act as a scientific basis for the realization of a systematic approach in terms of providing effective performance-based incentives to Russian civil servants. Thus, the proposed method to calculate the collective amount of bonus payments to civil servants in the Russian subjects will help develop the effective mechanism of budgetary funds distribution between regional ministries and departments (taking into account features of organizations functioning), as well as transfer to the correct determination of individual performance-based incentives to Russian civil servants with regard to the specifics of their activities.
The universality of the approach makes it possible to apply the author’s method in almost any federated state. In this case, if necessary, it can be adapted, the composition of socioeconomic indicators can be changed.
References Performance-based pay - a new (mixed) payment scheme for Russian civil servants
- Yuzhakov V.N. Result-based public management: the Russian model. Voprosy gosudarstvennogo i munitsipal'nogo upravleniya=Public Administration Issues, 2016, no. 2, pp. 165-174..
- Gerrish E. The impact of performance management on performance in public organizations: a meta-analysis. Public Administration Review, 2016, vol. 76, pp. 48-66.
- Kerpershoek E., Groenleer M., de Bruijn H. Unintended responses to performance management in Dutch hospital care: bringing together the managerial and professional perspectives. Public Management Review, 2016, vol. 18, pp. 417-436.
- Kalgin A.S., Dvinskikh D.Yu., Parfent'eva D.S. Do performance management systems increase the civil servants' job satisfaction? Voprosy gosudarstvennogo i munitsipal'nogo upravleniya=Public Administration Issues, 2017, no. 3, pp. 129-148..
- Pryazhnikov N.S., Polevaya M.V., Kamneva E.V. The main problems of the existing systems of labor motivation of civil servants and the prospects for overcoming them. Upravlencheskie nauki=Management Science, 2017, no. 4, pp. 72-79..
- Ilyin V.A., Morev M.V. Revisiting the issue concerning the future of russian statehood… Ekonomicheskie i sotsial'nye peremeny: fakty, tendentsii, prognoz=Economic and Social Changes: Facts, Trends, Forecast, 2018, no. 5, pp. 9-29..
- Borshchevskii G.A. Objective аssessment indicies of public administration efficiency. Upravlencheskie nauki=Management Science, 2016, no. 4, pp. 33-43..
- Gubarev R.V., Dzyuba E.I., Tyulenev Yu.V., Faizullin F.S. Performance bonuses for Russian public officers. Finansy=Finance, 2018, no. 5, pp. 51-58..
- Barabashev A.G. Crisis of state governance and its influence on basic administrative paradigms of state and bureaucracy Voprosy gosudarstvennogo i munitsipal'nogo upravleniya=Public Administration Issues, 2016, no. 3, pp. 163-194..
- Osborne S. The New Public Governance? Public Management Review, 2006, vol. 8, no. 3, pp. 377-387.
- Shultz D. The idea of the "state" in contemporary public administration theory. RUDN Journal of Public Administration, 2014, no. 1, pp. 90-102.
- Osborne S., Radnor Z., Strokosch K. Co-production and the co-creation of value in public services: a suitable case for treatment? Public Management Review, 2016, vol. 18, no. 5, pp. 639-653.
- Van Eijk C., Steen T. Why engage in co-production of public services? Mixing theory and empirical evidence. International Review of Administrative Sciences, 2016, vol. 82, no. 1, pp. 28-46.
- Brown G. Bringing the state back into cosmopolitanism: the idea of responsible cosmopolitan states. Political Studies Review, 2011, vol. 9, no. 1, pp. 53-66.
- Pollitt C. Government for the Future. Ministry of Finance. Helsinki. 2013. Available at: https://www.vm.fi/vm/fi/04_julkaisut/08_muut_julkaisut/20131119/govern/government_for_the_future/pdf.
- Hammerschmid G., Van de Walle S., Andrews R., Bezes P. (Eds.). Public Administration Reforms in Europe. The View from the Top. UK; Northampton MA, USA: Edward Elgar Publishing, 2016. 304 p.
- Kupryashin G.L. A kaleidoscope of administrative reforms in europe: experiences and views from top civil service executives. Voprosy gosudarstvennogo i munitsipal'nogo upravleniya=Public Administration Issues, 2018, no. 1, pp. 197-205..
- Gehlbach S. What is a Big Bureaucracy? Reflections on rebuilding Leviathan and Runaway. Czech Sociological Review, 2008, vol. 44, no. 6, pp. 1189-1197.
- De Vries M., Nemec J. Public sector reform: an overview of recent literature and research on NPM and alternative paths. The International Journal of Public Sector Management, 2013, vol. 26. no. 1. pp. 4-16.
- Denhardt J.V., Denhardt R.B. The new public service revisited. Public Administration Review, 2015, vol. 75, no 5, pp. 664-672.
- Zhuravleva T.A. The system of remuneration and motivation of public civil servants: a review of international practice. Gosudarstvennoe upravlenie: elektronnyi vestnik=E-journal. Public Administration, 2017, no. 64, pp. 331-345..
- Vorob'eva E.S., Panina O.V. New Zealand's best practices to improve the performance of public civil servants. Innovatsionnaya ekonomika: informatsiya, analitika, prognozy=Innovative Economy: Information, Analytics, Forecasts, 2014, no. 3, pp. 22-24..
- Zhigun L.A. Modern models of US civil servant remuneration. Upravlencheskie nauki=Management Science, 2014, no. 3, pp. 48-55..
- Krasil'nikov D., Sivintseva O. New public management in China: conservative version of administrative reforms. Mirovaya ekonomika i mezhdunarodnye otnosheniya=World Economy and International Relations, 2016, no. 8, pp. 85-95..
- Van Ryzin G.G. Outcomes, process, and trust of civil servants. Journal of Public Administration Research and Theory, 2011, vol. 21, no. 4, pp. 745-760.
- Borshchevskii G.A. Assessment of trends in civil service: methodological issues. Voprosy gosudarstvennogo i munitsipal'nogo upravleniya=Public Administration Issues, 2017, no. 1, pp. 103-128..
- Tatarkin A.I. New industrialization of the Russian economy: need for development and/or challenges of the time. Ekonomicheskoe vozrozhdenie Rossii=The Economic Revival of Russia. 2015. No. 2. С. 20-31..
- Grinberg R.S. Russian way out of the crisis: originality versus universal trend. Zhurnal novoi ekonomicheskoi assotsiatsii=The Journal of the New Economic Association, 2015, no. 2, pp. 190-196..
- Gagarina G.Yu., Dzyuba E.I., Gubarev R.V., Faizullin F.S. Forecasting of socio-economic development of the Russian regions. Ekonomika regiona=Economics of Region, 2017, no. 4, pp. 1080-1094..
- Aganbegyan A.G. Socio-economic development of Russia: analysis and forecast. Problemy prognozirovaniya=Studies on Russian Economic Development, 2014, no. 4, pp. 3-16..
- Bodrunov S.D. Re-industrialization: socio-economic parameters of reintegrating production, science and education. Sotsiologicheskie issledovaniya=Sociological Studies, 2016, no. 2, pp. 20-28..
- Glazyev S. On alternative policy of sustainable socio-economic development of Russia. Mir peremen=World of Changes, 2013, no. 1, pp. 89-95..
- Ivanter V.V., Komkov N.I. Status and prospects of development Russian innovation sphere the program of the Presidium of Russian Academy of Sciences. Analysis and forecast of long-term scientific trends and technological development: Russia and the World". MIR (Modernizatsiya. Innovatsii. Razvitie)=MIR (Modernization. Innovation. Research), 2016, no. 1, pp. 76-83..
- Tatarkin A.I. Regional orientation of economic policy of the Russian Federation as an institute of spatial arrangement of territories. Ekonomika regiona=Economics of Region, 2016, no. 1, pp. 9-27..
- Toshchenko Zh.N. Precariat -a new social class. Sotsiologicheskie issledovaniya=Sociological Studies, 2015, no. 6, pp. 3-13..
- Faizullin F.S., Dzyuba E.I., Gubarev R.V. Clustering of Russian regions by the level of socio-economic development. In: Innovatsionnye tekhnologii upravleniya sotsial'no-ekonomicheskim razvitiem regionov Rossii: Materialy X Vserossiiskoi nauchno-prakticheskoi konferentsii s mezhdunarodnym uchastiem . Ufa: ISEI UFITs RAN, 2018. Pp. 128-141..
- Bukaev G.I., Bublik N.D., Gorbatkov S.A., Satarov R.F. Modernizatsiya sistemy nalogovogo kontrolya na osnove neirosetevykh informatsionnykh tekhnologii . Мoscow: Nauka, 2001. 344 p.
- Zalozhnev D.A., Novikov D.A. Modeli Sistem Oplaty Truda . Мoscow: PMSOFT, 2009. 192 p.
- Kouz R. Firma, rynok i pravo . Moscow: Novoe izdatel'stvo, 2007. 224 p.
- Vasin A.A., Nikolaev P.V., Urazov A.S. On the optimal organization of the management structure. Doklady Akademii nauk=Academy of Sciences Reports, 2012, no. 3, pp. 262-265.
