Performance based Ranking Model for Cloud SaaS Services

Author: Sahar Abdalla Elmubarak, Adil Yousif, Mohammed Bakri Bashir
Journal: International Journal of Information Technology and Computer Science(IJITCS) @ijitcs
Article in issue: 1 Vol. 9, 2017.
Free access
Cloud computing systems provide virtualized resources that can be provisioned on demand basis. Enormous number of cloud providers are offering diverse number of services. The performance of these services is a critical factor for clients to determine the cloud provider that they will choose. However, determining a provider with efficient and effective services is a challenging task. There is a need for an efficient model that help clients to select the best provider based on the performance attributes and measurements. Cloud service ranking is a standard method used to perform this task. It is the process of arranging and classifying several cloud services within the cloud, then compute the relative ranking values of them based on the quality of service required by clients and the features of the cloud services. The objective of this study is to propose an enhanced performance based ranking model to help users choose the best service they need. The proposed model combines the attributes and measurements from cloud computing field and the well-defined and established software engineering field. SMICloud Toolkit has been used to test the applicability of the proposed model. The experimentation results of the proposed model were promising.
Cloud, Ranking, Performance, SaaS, QoS
Short address: https://sciup.org/15012612
IDR: 15012612
Text of the scientific article Performance based Ranking Model for Cloud SaaS Services
Published Online January 2017 in MECS
Cloud computing has emerged as a paradigm to deliver on demand resources to customers similar to other utilities such as water, electricity, gas etc[1, 2]. There are three main services provided by the cloud computing architecture according to the needs of IT customers. First software as a Service (SaaS) provides access to complete applications as a service such as customer relationship management. The second is Platform as a Service (PaaS) provides a platform for developing other applications on top of it, such as the Google App Engine. Finally, infrastructure as a service (IaaS) provides an environment for deploying, running and managing virtual machines and storage[3, 4]. Technically, IaaS offers incremental scalability of computing resources and on demand storage. Cloud computing aims to deliver a network of virtual services so that users can access them from anywhere in the world on subscription at competitive costs depending on their quality of service (QoS) requirements [5].
Software as a Service or SaaS, deliver the services to users through browsers. From the view point of providers, they can reduce costs of maintenance of software. In the other hand, from users’ view, they can reduce expenses on setting up the server and buying software licenses. Generally, SaaS is often used in the field of human resources management and ERP.
Ranking cloud computing services is the process of arranging and classification services within the cloud, then computes the relative ranking values of several Cloud services based on the Quality of Service (QoS) requirements by the customer and features of the Cloud services.
Several cloud providers are now available and these providers offer different cloud services to their clients. Performance is a crucial aspect of cloud service. Cloud services from different providers have different performance characteristics. From the client point of v iew, it is difficult to determine which provider is best and based on which performance measurements the selection process should be. There is a need for a new performance based ranking model to assist cloud clients to select the suitable provider.
The objective of this research is to propose a new performance based ranking model to rank the quality of services (QoS) offered by software as a service (SaaS) providers depending on cloud computing performance characteristics.
This paper has six sections; section two describes the related works. Section three states the common performance characteristics. Section four illustrates the proposed ranking model. Section five tests the applicability of the proposed model. We concluded in section six.
-
II. R ELATED W ORK
Quality model for CRM cloud solutions is defined of composite quantitative indexes and an agnostic processor has been depicted to represent the structure and the computation process of these indexes. Moreover, a quality model based on the exiting SMI framework has been customized to the context of cloud CRM selection by defining the CRM Index [4].
Performance evaluation and validation focuses on supporting performance evaluation and scalability analysis for cloud-based applications such as SaaS applications due to the distinct features of SaaS in clouds. There are three groups of indicators about system performance evaluation. First, computing resource indicators, this group of indicators relate to computing hardware and software resource allocation and utilization in CPU, disk, memory, networks, and other system resources. Second are workload indicators: these indicators include the number of currently online access users and clients, application service loads such as throughputs, and connectivity traffic loads. Third, performance indicators: this group of indicators includes application processing speed, system reliability, availability and scalability based on the given QoS standards [6] .
Measuring System Performance in Clouds it is common to collect and measure system performance indicators of SaaS in a cloud for performance testing and evaluation based on the given QoS and SLA. A typical performance parameter set includes the processing speed (such as user response time), system utilization, throughput, reliability, and availability. System Performance Meter (SPM) is to be provided by the following formula:
SPM (S ,t) = 0.5* sin(2n/n)*Si=i Pi *p+ + 1
Where p1,….,pn represent different performance indicators for S during performance evaluation at time t in a cloud. This approach provides a comprehensive view about system performance in a dynamic way with a uniform format although different performance parameters may have their own scale units [6] .
Service Measurement Index represents a step in the framework of quality for any kind of service and SMI attributes are designed based on the International Organization for Standardization (ISO) standards by the CSMIC consortium. It consists of a set of business relevant Key Performance Indicators (KPIs) that provide a standardized method for measuring services. The SMI framework provides a holistic view of QoS needed by the customers for selecting a Cloud service provider.
Evaluation criteria for cloud services depend on what key attributes are important for organizations and their needs to keep being competitive. Regardless of the choice of sourcing kind, all organizations have to measure and/or evaluate the services. The main flaw of all actual models is missing or redundant criteria to evaluate outsourced services, which means a poor assessment and future problems in organizations. Several models, as ISO/IEC 9126, SCM-CL, CSEF, SMI Cloud and SMI, list the criteria but do not give them the comparative importance that will help DM when an outsource solution has different offers [7].
Table 1. Performance Factors in Previous Models
|
The model |
Attributes |
|
Service Measurement Index (SMI v2.1 )[7 ] |
(Accuracy, Functionality, Suitability, Interoperability, Service Response Time) |
|
CRM Cloud Solution s[8 ]. |
(Accuracy, Functionality, Suitability, Interoperability, Service Response Time) |
|
Evaluation criteria for cloud service s[9 ] |
(Accuracy, Availability, Efficiency, Innovation, Interoperability, Maintainability, Reliability, Service Response Time) |
|
Cloud computing main and sub feature s [10 ] |
latency, Complexity, Customization, Requirement |
|
AHP hierarchy for SaaS-based Rankin g[11 ] |
Suitability, Service Response Tim |
|
SaaS QoS Dimension s[12 ] |
Response Time, Throughput, Timeliness |
|
Performance Indicator s[6 ] |
speed, response time, latency, Reliability, availability, throughput, and scalability |
|
IEEE Standard for a Software Quality Metrics Methodolog y[13 ] |
speed, efficiency, resource needs, throughput, and response time (Reliability, Usability, Integration, Survivability, Efficiency) |
III. C OMMON P ERFORMANCE C HARACTERISTICS
The term performance refers to methods for improving performance during the design process. The table below lists the most common attributes of performance. These attributes were obtained from eight different performance models as described in Table (2).
-
IV. E NHANCED M ODEL FOR P ERFORMANCE BASED R ANKING
This study proposed an enhanced model for performance based ranking for cloud SaaS services. The aim of the proposed model is to efficiency rank the services offered by cloud service providers. The proposed model is mainly an enhancement to SMI cloud model. The proposed model has modified SMI cloud model and included the attributes that have high effects on the service performance. Furthermore, some of SMI sub attributes are also modified to improve the SMI cloud model. Mainly the modification to SMI cloud model is based on merg ing the attributes from cloud SaaS field and the attributes used in the software engineering well-defined and established models. The Following is a description of the attributes and sub attributes that have been included in the proposed model and the reasons why this attributes are considered in the proposed model.
The proposed model attributes are Accuracy, reliability as described in Table (3) and Figure (1). Suitability, Interoperability, Service Response Time and
Table 2. The Common Attributes of Performance Factor
|
Performance |
Cloud Computing |
Software Engineering |
|||||||||
|
z о < |
£ |
co g |
co П 9 |
to У О |
co 5- 8 to 2 в |
73 § > B' 4 era |
5 KI g s. о о о 5 1/1 |
to |
to to П H |
СЛ < 3 ” I |
о |
|
3 |
Accuracy |
Yes |
Yes |
Yes |
|||||||
|
2 |
Functionality |
Yes |
Yes |
||||||||
|
3 |
Suitability |
Yes |
Yes |
Yes |
|||||||
|
3 |
Interoperability |
Yes |
Yes |
Yes |
|||||||
|
7 |
Response Time |
Yes |
Yes |
Yes |
Yes |
Yes |
Yes |
Yes |
|||
|
2 |
Latency |
Yes |
Yes |
||||||||
|
1 |
Maintainability |
Yes |
|||||||||
|
1 |
Complexity |
Yes |
|||||||||
|
2 |
Customization |
Yes |
Yes |
||||||||
|
1 |
Requirement |
Yes |
|||||||||
|
4 |
Throughput |
Yes |
Yes |
Yes |
Yes |
||||||
|
3 |
Availability |
Yes |
Yes |
Yes |
|||||||
|
4 |
Reliability |
Yes |
Yes |
Yes |
Yes |
||||||
|
1 |
Transparency |
Yes |
|||||||||
|
3 |
Scalability |
Yes |
Yes |
Yes |
|||||||
|
2 |
Security |
Yes |
Yes |
||||||||
|
1 |
Timeliness |
Yes |
|||||||||
|
2 |
Speed |
Yes |
Yes |
||||||||
|
1 |
Usability |
Yes |
|||||||||
|
1 |
Integration |
Yes |
|||||||||
|
1 |
Innovation |
Yes |
|||||||||
|
1 |
Survivability |
Yes |
|||||||||
|
3 |
Efficiency |
Yes |
Yes |
Yes |
|||||||
|
1 |
Resource needs |
Yes |
|||||||||
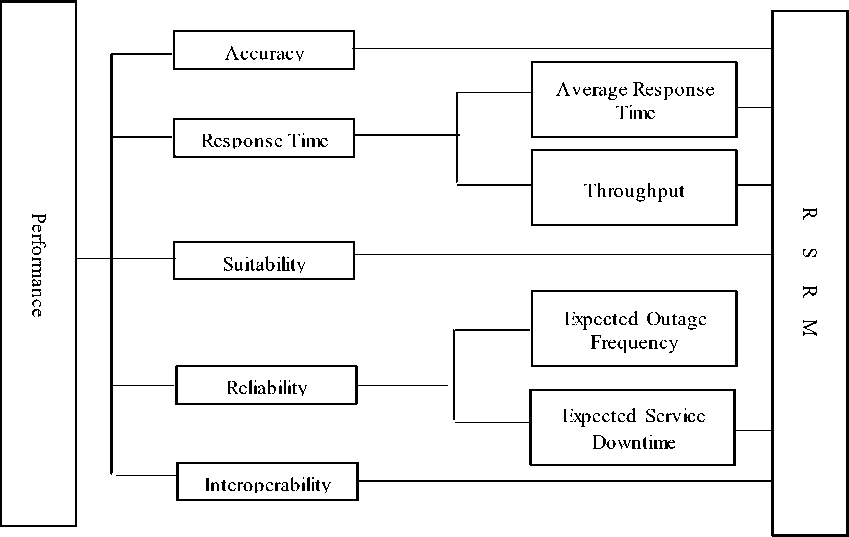
Fig.1. The Proposed Cloud SaaS Ranking Model
Accuracy has been included in the proposed model because an error-free service ensures continuity and quality performance. Suitability has been taken into account as the service that meets customer requirements in all its forms is definitely a high-quality performing service. SRT is crucial to performance as the performance depends mainly on time. Decreasing SRT results in increasing the performance, and vice versa. Average response time is considered in the proposed model as it shows the percentage of success and failure. Throughput is taken into account as requesting more than a service in a period of time may result in delay. This clearly affects performance because it affects the response time.
Interoperability is included in the models services that work with each other and have the ability to exchange information increases the quality of service. This is required to measure performance. By definition reliability and survivability is considered the most comprehensive because they define expected outage frequency and expected service downtime that reverse survivability, the ability to define the program well, even if there was a failure in a part of the program. Expected outage frequency is the time in which the service operates in a high quality performance despite a failure occurs. Expected service downtime identifies the time the service is expected to be unavailable.
Table 3. Attribute that has Been Included in the Proposed Model
|
Performance |
Cloud Computing |
Software |
|||||||
|
NO View |
Attribute |
SMI Cloud |
CRM |
Evaluation Criteria |
AHP hierarchy |
SaaS QoS |
Perf Indicators |
Sample Sub Vectors |
Sub Vector |
|
3 |
Accuracy |
Yes |
Yes |
Yes |
|||||
|
3 |
Suitability |
Yes |
Yes |
Yes |
|||||
|
3 |
Interoperable |
Yes |
Yes |
Yes |
|||||
|
7 |
Service Response |
Yes |
Yes |
Yes |
Yes |
Yes |
Yes |
Yes |
|
|
4 |
Reliability |
Yes |
Yes |
Yes |
Yes |
||||
-
A. The Proposed Model Description
Performance measures the service features and functions expectations and how they really work. The proposed model has five criteria: Accuracy, Service response time, Suitability, Reliability and Interoperability. As shown in table (4) and Figure (1), the idea of the proposed model is based on taking the most crucial attributes that affect the performance from software engineering field and cloud SaaS field. This tries to orchestrate the cloud SaaS model with the well-defined and established software engineering models.
Table 4. Performance Measurements
|
Attribute |
Definition |
|
Accuracy |
Free service from faults |
|
Suitability |
Interact and fit the service with a large number of users |
|
Service Response Time |
Real time between the service request and response service |
|
Average Response Time |
Average real time services |
|
Throughput Response Time |
The number of requests sent in time for a particular service |
|
Interoperability |
The service's ability to exchange information and benefit in the sense you benefited |
|
Reliability |
A total of the qualities that keeps the performance of the service in a certain period of time |
|
Expected Outage Frequency |
Occurrence of a problem that prevents the user from using the service |
|
Expected Service Downtime |
Service affecting other services stopped |
Performance measurement model provides the quality measurement in a simple Performance scale. This scale begins from 0% and ends at 100%. In this scale 0% indicates a very poor quality of performance and 100% shows the best quality of it. In this model, the weight was distributed depending to each attribute repeat frequency as described in Table (3).
Table 5. Attributes Weight
|
Repeat |
Attribute |
Weight |
|
7 |
Service Response Time |
3.5 |
|
4 |
Reliability |
2.0 |
|
3 |
Suitability |
1.5 |
|
3 |
Interoperability |
1.5 |
|
3 |
Accuracy |
1.5 |
-
B. Phases of the Proposed Model
The phase of the proposed ranking model is based on the calculation for ranking cloud SaaS services described in [7] .
Use the numbers of services to establish a quadrate metrics, this matrix will be called Relative Service Ranking Vector (RSRV) to illustrate the degree of similarity between service providers
|
s1 |
s1 |
s1 |
|
|
1 1 |
1 1 |
1 1 |
|
|
s1 |
s2 |
s3 |
|
|
s2 |
s2 |
s2 |
|
|
= |
— |
— |
— |
|
s1 |
s2 |
s3 |
|
|
s3 |
s3 |
s3 |
|
|
———— |
|||
|
s1 |
s2 |
s3 |
Then calculate the summation of the elements for each column Ci separately to get the similarity rate between each service and other services
C1 = ++ si si si
C2 = ++ s2 s2 s2
C3 = ++
S3 S3 s3
Table 6. Demonstration Example
Conduct a new matrix Z, its’ elements are the result of dividing each element from the main matrices (RSVR) by the sum of its own column, to get the differentiating rate between each service and all other services
|
/ c 1 / c 2 / c 3 si s2 s3 |
ABC |
||
|
Z = |
S2 52 52 Si /c1 /c2 /c3 |
= |
D E F |
|
/ c 1 / c 2 / c 3 si s2 s3 |
GHI |
Find the matrix SRSM
3 33
з з ; 1 10.75
SRSM= = 1 10.75
4 4 4 1.33 1.331
3 34
Calculate C1,C2 and C3
The next step is to divide the resulting matrices Z by
C1 = 1+1 + 1.33 = 3.33
the number of elements n, to obtain the rating average
C2 = 1 + 1 + 1.33 = 3.33
|
A B_ C |
C3 = 0.75 + 0.75+ |
1 = 2.5 |
|
|
n n n |
|||
|
Y = Sum each row separa |
- £ L 71 71 71 £ 5. 1 71 71 71 tely to e |
Derive the matrix RSRV stablish the ranking 3. 33 3 . 33 2 .3 |
0.30 0.30 0.30 |
|
vector R1= R2 = |
RSRV = 3.33 3.33 2 .. = 1. 33 1. 33 1 + +£ з. 33 3 . 33 2 .5 71 71 71 0.30 0 .30 0 .30 DEF - - - + +- 9 9 9 0.03 |
0.30 0.30 0.30 0.39 0.39 0.4 0.03 0.03 |
|
|
R3 = |
G H + + |
0.30 0 .30 0 . =0.03 9 9 9 7 о.39 0 .39 0 .4 0.04 |
0.03 0.03 0.04 0.04 |
|
From the above step we |
9 9 9 get the following vector (V) Calculate R1,R2 and R3 R 1 |
||
Vector (V) = R 2
R 3
R1= 0.03 + 0.03 + 0.03 = 0.09
Multiply the vector (V) with the metrics (RSRV). The result is the metrics (RSRM). Repeat the steps for each service. Finally sum all the resulting matrices (RSRMs) in a new one called (RSRV) and multiply it with the rating column taken from the above table .
-
C. Demonstration Example
R2= 0.03 + 0.03 + 0.03= 0.09
R3 = 0.04 + 0.04 + 0.04 = 0.12
1 1 0.570.09
1 1 0.75 X 0.09=0.02 0.020.8
1.33 1.33 10.12
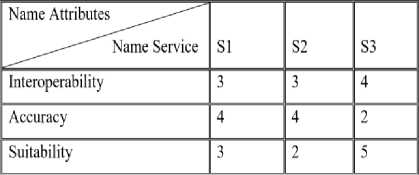
Considering three cloud providers S1, S2 and S3 with values of interoperability, accuracy and suitability as described in Table (5).
Enter in the example data of the features and attributes
Interoperability = 0.02 0.020.8
Accuracy = 0.2 0.20.1
Suitability= 0.2 0.10.4
Find the RSRV ranking matrix
0.02
RSRV = 0.2
0.2
0.02
0.2
0.1
0.810
0.1X 10 = 8.4 7.28.8
0.410
From the above example we found that best service is the third one
-
V. T ESTING THE A PPLICABILITY OF THE P ROPOSED M ODEL
To test the applicability of the proposed model a case study is needed to evaluate the model. The case study employed in this evaluation process has been described in [10].
The values of attribute and measurements as described in Table (6).
Table 7. The Case Study Data
|
S1 |
S2 |
S3 |
|
|
Service Response Time |
1.5 |
2 |
4.5 |
|
Reliability |
2.5 |
2 |
0.5 |
|
Suitability |
2.5 |
2.5 |
2 |
|
Interoperability |
1.5 |
1.5 |
2 |
|
Accuracy |
2 |
2 |
1 |
As described in table (6) the case study has three cloud providers S1, S2 and S3 with different attribute values [9] . This study employed SMICloud toolkit to test the applicability of the proposed model. The final results of the ranking process is described in Table(7) and Figure(2)
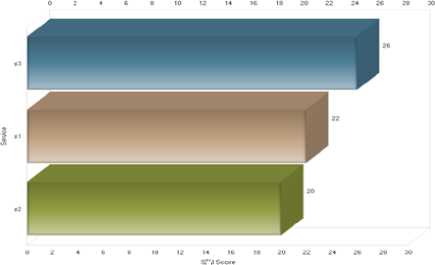
Fig.2. Ranking Result Flowchart
Table 7. Experiment Results
References Performance based Ranking Model for Cloud SaaS Services
- Musa, S.M., A. Yousif, and M.B. Bashi, SLA Violation Detection Mechanism for Cloud Computing.
- Rittinghouse, J.W. and J.F. Ransome, Cloud computing: implementation, management, and security2016: CRC press.
- Da Cunha Rodrigues, G., et al. Monitoring of cloud computing environments: concepts, solutions, trends, and future directions. in Proceedings of the 31st Annual ACM Symposium on Applied Computing. 2016. ACM.
- Yousif, A., M. Farouk, and M.B. Bashir. A Cloud Based Framework for Platform as a Service. in Cloud Computing (ICCC), 2015 International Conference on. 2015. IEEE.
- Lu, G. and W.H. Zeng. Cloud computing survey. in Applied Mechanics and Materials. 2014. Trans Tech Publ.
- Gao, J., et al. SaaS performance and scalability evaluation in clouds. in Service Oriented System Engineering (SOSE), 2011 IEEE 6th International Symposium on. 2011. IEEE.
- Siegel, J. and J. Perdue. Cloud services measures for global use: the Service Measurement Index (SMI). in SRII Global Conference (SRII), 2012 Annual. 2012. IEEE.
- Colomo-Palacios, R. and J.M.Á. Rodríguez. Semantic Representation and Computation of Cloud-Based Customer Relationship Management Solutions. in On the Move to Meaningful Internet Systems: OTM 2014 Workshops. 2014. Springer.
- Costa, P., J.P. Santos, and M.M. da Silva. Evaluation criteria for cloud services. in Cloud Computing (CLOUD), 2013 IEEE Sixth International Conference on. 2013. IEEE.
- Shaat, S.S. and K. Wassif, Enhanced Cloud Service Provisioning for Social Networks. Journal of Computer and Communications, 2015. 3(08): p. 20.
- Afify, Y., et al. A semantic-based software-as-a-service (saas) discovery and selection system. in Computer Engineering & Systems (ICCES), 2013 8th International Conference on. 2013. IEEE.
- Burkon, L., Quality of Service Attributes for Software as a Service. Journal of Systems Integration, 2013. 4(3): p. 38.
- Committee, I.C.S.S.E.T., IEEE Standard for a Software Quality Metrics Methodology1993: Institute of Electrical and Electronics Engineering.
