Performance Improvement of Plant Identification Model based on PSO Segmentation

Author: Heba F. Eid
Journal: International Journal of Intelligent Systems and Applications(IJISA) @ijisa
Article in issue: 2 vol.8, 2016.
Free access
Plant identification has been a challenging task for many researchers. Several researches proposed various techniques for plant identification based on leaves shape. However, image segmentation is an essential and critical part of analyzing the leaves images. This paper, proposed an efficient plant species identification model using the digital images of leaves. The proposed identification model adopts the particle swarm optimization for leaves images segmentation. Then, feature selection process using information gain and discritization process are applied to the segmented image's features. The proposed model was evaluated on the Flavia dataset. Experimental results on different kind of classifiers show an improvement in the identification accuracy up to 98.7%.
Plant identification, Segmentation, Particle Swarm Optimization, Information Gain, Discretization
Short address: https://sciup.org/15010796
IDR: 15010796
Text of the scientific article Performance Improvement of Plant Identification Model based on PSO Segmentation
Published Online February 2016 in MECS
Plants play an important role in preserving earth ecology and balance of the environment. However, identifying plant species is a challenging task considering the large number of existing species. Also, plant identification is difficult and time consuming due to species similarity and variability.
Plants leaves are one of the important organs of the plant. Leaf based plant identification models are preferred; due to leaf easiness to access, carry and process. Several researches have been proposed for plants identification using its leaves [1, 2].
However, a key issue of developing such plant identification models lies in extracting leaves features; which have good ability to classify the different kinds of species. To reach a highest performance of plant identification; image segmentation is an important part of extracting information from leaves images. Thus, the selection of the image segmentation technique is very critical [3].
Swarms intelligence (SI) has been applied in numerous fields including optimization. For which, particle swarm optimization (PSO) has been successfully applied for solving many optimization problems [4].
This paper presents a plant identification model based on the information extracted from leaves images. The proposed model adopts the PSO-segmentation to segment the digital leaf images. Then, two preprocessing phases are performed before classification; features selection and discretization. The effectiveness of the proposed plant identification model is evaluated by conducting several experiments on the flavia data set using three different classifiers.
The rest of this paper is organized as follows: section II gives an overview of image segmentation and particle swarm optimization (PSO). Section III and IV discuss the concept of feature selection and discritization respectively. While, section V describes the proposed framework of the plant identification model. Section VI presents the Flavia dataset. The experimental results and conclusions are presented in Section VII and VIII respectively.
-
II. Image Segmentation
Image segmentation is a processing task that aims to locate different objects and boundaries in the image content [5]. Its goal is to partition an image into multiple segments "sets of pixels" that are more meaningful to analyze [6]. For which, the image is divided into two parts: background and foreground, where the foreground is the interesting objects and the background is the rest of the image. All the pixels in the foreground are similar with respect to a specific characteristic, such as intensity, color, or texture [7].
Image segmentation methods have been classified into numerous approaches: Threshold Based Image
Segmentation [8], Region Based Image Segmentation [9], Edge Based Image Segmentation [10] and cluster Based Image Segmentation [11].
Swarm Intelligence techniques have been used for different number of applications and got good performances [12-15]. Particle Swarm Optimization (PSO) can be applied for the threshold based segmentation, where the PSO technique is used to search the optimal threshold for the segmentation process.
-
A. Particle Swarm Optimization (PSO)
Particle Swarm Optimization (PSO) is an evolutionary method developed by Kennedy and Eberhart in 1995 [16]. PSO simulates the social behavior of bird flocking. The swarm is initialized with a random population of particles; where each particle of the swarm represents a candidate solution in the search space. However, to find the best solution, each particle changes its searching direction according to: The individual best previous (pbest), represented by Pi=(pi1,pi2,...,pid) ;
position and the
global best position of the swarm (gbest) Gi =( gi 1, gi 2,..., gid ) [17].
The position for the particle i at iteration t for d-dimensional can be represented as:
t tt
X = X 1 , X 2
t xid
While, the velocity for the particle i at iteration t is given by vi = v 11, vi2,..", vid (2)
The uncertainty about the value of Y is measured by its entropy; when Y and X are discrete variables that take values y ...y and x ...x
k
H ( Y ) = - 2 P ( Z )log 2 ( P ( Z )) (6)
i = 1
Where P ( y ) is the prior probabilities for all values of Y .
The uncertainty about the value of Y after observing values of X is given by the conditional entropy of Y given X nk
H ( Y \ X ) = - ^ P ( xy ) ^ P ( y , \ x; )log 2 ( P ( Z i \ X j )) (7)
j = 1 i = 1
The particle updates its velocity according to:
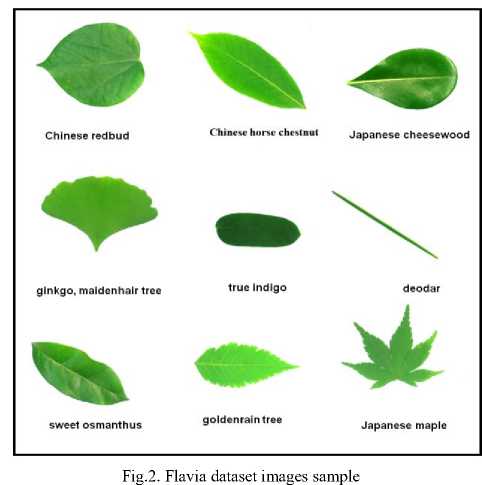
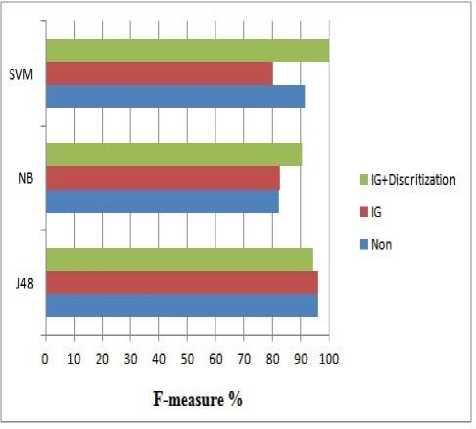
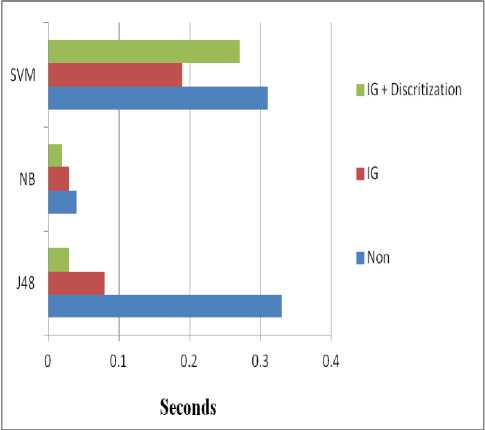
t+1 t t where P(y |x ) is the posterior probabilities of Y given the values of X. Thus, the information gain is: d=1,2,...,D Where, w is the inertia weight and r1 and r2 are random numbers distributed in the range [0, 1]. Positive constant c1 and c2 represent the cognition learning factor and the social learning factor. ptid denotes the best previous position found so far for the ith particle and gtid denotes the global best position so far [18]. Each particle at the swarm moves to its new potential position based on the following equation: x t+1 id t t+1 xid+vid d=1,2,...,D III. Feature Selection Feature selection (FS) can be used as a preprocessing phase before classification. It aims to improve the classification performance through the removal of redundant and irrelevant features. FS methods select a new subset of features from the original ones [19]. Feature selection methods fall into two categories; based on the evaluation criteria [20]: filter approach and wrapper approach. Filter approaches evaluate the new set of features according to the general characteristics of the data. For which, features are ranked based on certain statistical criteria. Frequently used FS methods include information gain (IG) [21]. A. Information Gain The information gain (IG) [22] of an attribute X with respect to the class attribute Y is the reduction in uncertainty about the value of Y, after observing the values of X. IG is given by IG = Y \ X (5) IG (Y \ X) = H (Y) - H (Y \ X) (8) Thereby, attribute X is regarded more correlated to class Y than attribute Z, if IG(Y|X)>IG(Y|Z). IV. Discretization Discretization is converting the continuous feature space into a nominal space [23]. The discretization process goal is to find a set of cut-points which partition the range into a small number of intervals. A cut-point is a real value within the continuous values range; and divides the range into two intervals. Thus, a continuous interval [a, b] is partitioned into [a, c] and (c, b], where c is a cut-point [24]. Discretization is usually performed as a pre-processing phase for classification. Fayyad et al. [25] proposed the Information Entropy Maximization (IEM) discretization method. IEM method is based on the information entropy. For a set of instances S, feature A and a partition boundary T; the class information entropy E(A,T;S) is given by: E(A,T;S) = ^ Ent (S1) + ^ Ent (S2) (9) Where Ent(S) is the class entropy of a subset S for k classes C1,^.,Ck, Ent(S) is given by k Ent(S ) = -^P(с.,S)log(P(C,S)) (10) V. Implementation of the Proposed Plant Leaf Identification Model The framework of the proposed plant leaf identification model is shown in Fig 1. It comprises of the following four fundamental phases: (1) Image PSO segmentation phase. (2) Data reduction by IG feature selection phase. (3) IEM discretization phase. (4) finally, classification phase. At the first phase; the plant leaves digital images are resized and segmented by the PSO segmentation. Then, the Histogram of Oriented Gradients (HOG) [26] is used to extract the segmented image features. HOG features are calculated by counting the occurrences of gradient orientation of edge intensity in localized portions of an image. Secondly, the IG algorithm is applied as a feature selection method to reduce the dimensionality of the features extracted by HOG. Fig.1. The Proposed Plant Leaf Identification Model {TC "1 The Proposed Plant Leaf Identification Model" \f f} At the third phase, the Information Entropy Maximization (IEM) discretization method is applied to the IG selected features. The IEM methos was proposed by Fayyad et al. [25]. IEM method criterions are based on the information entropy, where all the cut points should be set between points with different class labels. Finally, the discritized features are passed to the classifier; to identify the plant species. VI. Flavia Dataset The Flavia dataset helps researchers to judge the performance of their systems. Flavia dataset was collected by Wu et al. [27], it contains 1907 RGB leaf images of 32 species, each species has 40 to 60 sample leaves. Each image in the Flavia dataset has a white background and with no leafstalk. Samples of the flavia dataset images are given in Fig. 2. The latins and common names of the Falvia dataset are given in Table 1. Table 1. Latins and common names of the Falvia dataset label Plant Latin Name Plant Common Name 1 Phyllostachys edulis (Carr.) Houz. pubescent bamboo 2 Aesculus chinensis Chinese horse chestnut 3 Berberis anhweiensis Ahrendt Anhui Barberry 4 Cercis chinensis Chinese redbud 5 Indigofera tinctoria L. true indigo 6 Acer Palmatum Japanese maple 7 Phoebe nanmu (Oliv.) Gamble Nanmu 8 Kalopanax septemlobus (Thunb. ex A.Murr.) Koidz. castor aralia 9 Cinnamomum japonicum Sieb. Chinese cinnamon 10 Koelreuteria paniculata Laxm. goldenrain tree 11 Ilex macrocarpa Oliv. Big-fruited Holly 12 Pittosporum tobira (Thunb.) Ait. f. Japanese cheesewood 13 Chimonanthus praecox L. wintersweet 14 Cinnamomum camphora (L.) J. Presl camphortree 15 Viburnum awabuki K.Koch Japan Arrowwood 16 Osmanthus fragrans Lour. sweet osmanthus 17 Cedrus deodara (Roxb.) G. Don deodar 18 Ginkgo biloba L. ginkgo, maidenhair tree 19 Lagerstroemia indica (L.) Pers. Crape myrtle, Crepe myrtle 20 Nerium oleander L. oleander 21 Podocarpus macrophyllus (Thunb.) Sweet yew plum pine 22 Prunus serrulata Lindl. var. lannesiana auct. Japanese Flowering Cherry 23 Ligustrum lucidum Ait. f. Glossy Privet 24 Tonna sinensis M. Roem. Chinese Toon 25 Prunus persica (L.) Batsch peach 26 Manglietia fordiana Oliv. Ford Woodlotus 27 Acer buergerianum Miq. trident maple 28 Mahonia bealei (Fortune) Carr. Beale's barberry 29 Magnolia grandiflora L. southern magnolia 30 Populus ×canadensis Moench Canadian poplar 31 Liriodendron chinense (Hemsl.) Sarg. Chinese tulip tree 32 Citrus reticulata Blanco tangerine {TC "2 Flavia dataset images sample" \f f} VII. Experimental Results and Analysis The flavia dataset is used for the evaluation of the proposed plant leaf identification model. For which, 10 leaves per species were used for testing purpose and 30 leaves per species were used as training. All experiments were performed using Intel Core i3 processor with 3 GB of RAM. A. Performance Evaluation Measures To evaluate the proposed leaf pant identification model, the performance accuracy of three different classifiers; J48, naive bayes (NB) and support vector machine (SVM) are measured. The classification performances are measured by the Recall, Precision and F-measure [28]. B. Results and Analysis To experiment the proposed plant identification model; first we try to analyze the effect of PSO-segmentation before applying IG feature selection and discritization. For which, each digital image are segmented by PSO-segmentation; and the HOG features vectors are extracted from these segmented images. Then, three different categories of classifiers; J48, naive bayes and SVM classifier are used to measure the classification performance. The accuracy measures of the classifiers are given in Table 2. Table 2. Classification Accuracy of PSO-segmented images {TC "1 Classification Accuracy of PSO-segmented images" \f t} Classifier TP Rate FP Rate Precision Recall J48 0.959% 0.004% 0.96% 0.959% NB 0.821% 0.02% 0.849% 0.821% SVM 0.915% 0.01% 0.923 % 0.915% Case Study 1: Applying IG Feature Selection Table 3 shows the accuracy performance of the three different classifiers, after applying IG feature selection on the HOG feature vectors. Table 3. Classification Accuracy of Applying IG Feature Selection {TC "2 Classification Accuracy of Applying IG Feature Selection" \f t} Classifier TP Rate FP Rate Precision Recall J48 0.962% 0.004% 0.962% 0.962% NB 0.824% 0.02% 0.841% 0.824% SVM 0.802% 0.029% 0.765% 0.802% A performance comparison of the effect of applying the IG feature selection on HOG features is given in table 4. For which, the identification speed is improved and the classification accuracy achieved using J48 is increased to 96.15%. where, TP Recall =--- TP + FN TP Precision =-------- TP + FP · True positives (TP) refers to a correct prediction of the classifier. · False positives (FP) and False negatives (FN) correspond to the classifier incorrect predicted. And the F-measure is given by: 2 * Recall * Precision F - measure =------------------- Recall + Precision Table 4. Comparison of F-measurs and speed for applying IG Feature selection {TC "3 Comparison of F-measurs and speed for applying IG Feature selection " \f t} Classifier Non (64 Features) IG (20 Features) F-measure Time seconds F-measure Time seconds J48 95.87% 0.33 96.15% 0.08 NB 82.14% 0.04 82.42% 0.03 SVM 91.48% 0.31 80.21% 0.19 Case Study 2:Applying IG Feature Selection and Discritization The detection accuracy of the three classifiers, after applying IEM discritization on the IG selected features vectors are shown in Table 5. Table 5. Classification Accuracy of Applying IG FS and Discritization {TC "4 Classification Accuracy of Applying IG FS and Discritization " \f t} Classifier TP Rate FP Rate Precision Recall J48 0.942% 0.008% 0.945% 0.942% NB 0.904 % 0.011% 0.911% 0.904% SVM 0.997% 0.001% 0.997% 0.997% Table 6, gives the comparison impact of applying IEM discritization. It is clear from Table 6 that; identification performance of the Naive bayes and SVM classifier is increased to 90.38% and 98.72% respectivily. While, the identification speeds for the whole three different classifiers are improved. Table 6. Comparison of F-measurs and speed for applying IG and discritization {TC "5 Comparison of F-measurs and speed for applying IG and discritization " \f t} Classifier Non IG and Discritization F-measure Time seconds F-measure Time seconds J48 95.87% 0.33 94.23% 0.03 NB 82.14% 0.04 90.38% 0.02 SVM 91.48% 0.31 98.72% 0.27 Fig.3. F-measures Comparison of the proposed plant identification model Concerning to the proposed plant identification model, Figure 3 shows the F-measures of the three classifiers J48, Naive bayes and SVM; after applying PSO segmentation only without any pre-processing. Then, applying IG Feature selection and combining IG feature selection with IEM discritization. While Figure 4, gives the time speed comparision of the three classifiers. Fig.4. Time speed Comparison of the proposed plant identification model {TC "3 F-measures Comparison of the proposed plant identification model" \f f} VIII. Conclusions This paper develops an efficient and computational model for plant species identification using the digital images of plant leaves. The proposed identification model adopts the particle swarm optimization for segmenting the digital leaves images. To enhance the identification performance accuracy, several case studies are applied. For which, feature selection process using information gain (IG) is applied to the segmented image features. Then, combining IG with discritization process is applied. The proposed model was evaluated on the Flavia dataset. Experiments are conducted on three different kind of classifiers; J48, naïve bayes and SVM. The experimental results show an improvement of the F-measure accuracy up to 90.38% for naïve bayes and 98.7% for SVM.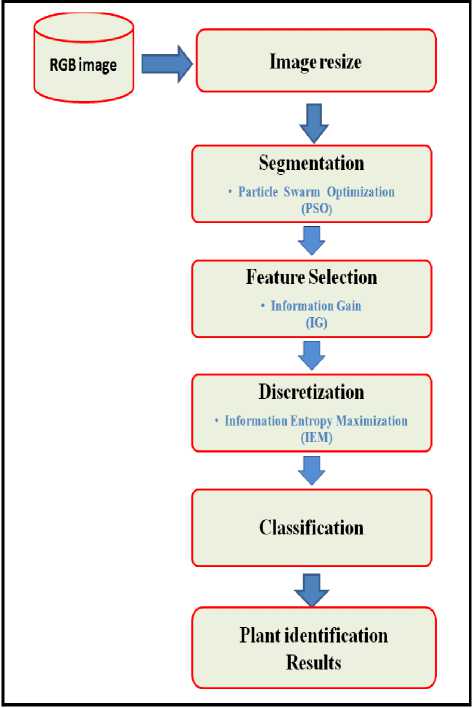
References Performance Improvement of Plant Identification Model based on PSO Segmentation
- A. Kadir, LE. Nugroho, A. Susanto, and PI. Santosa,"Neural Network Application on Foliage Plant Identification", International Journal of Computer Applications, vol. 29, pp.15-22, 2011.
- T. Suk, J. Flusser, and P. Novotny, "Comparison of Leaf Recognition by Moments and Fourier Descriptors", Computer Analysis of Images and Patterns Lecture Notes in Computer Science, vol. 8047 , pp. 221-228 , 2013.
- J. Acharya, S. Gadhiya, and K. Raviya, "Segmentation techniques for image analysis: A review", International Journal of Computer Science and Management Research, vol. 2, pp. 2278-733, 2013.
- Vivek G, and V. Shetty, "Survey on Swarm Intelligence Based Optimization Technique for Image Compression",Int. J. of Innovative Research in Computer and Communication Engineering, vol. 3, pp.1058-1063,2015.
- R.C. Gonzalez, and R.E. Woods, "Digital Image Processing", Prentice-Hall, Englewood Cliffs, NJ, 2002.
- L. Shapiro, and G. C. Stockman, "Computer Vision", New Jersey, Prentice-Hall, 2001.
- C. Hoi, and M. Lyu, "A novel log based relevance feedback technique in content based image retrieval", In Proc. ACM Multimedia, 2004.
- A. kaur, and N. kaur, "Image Segmentation Techniques",International Research Journal of Engineering and Technology, vol.2, pp.944-947 , 2015.
- H. G. Kaganami, and Z. Beij, "Region based detection versus edge detection", IEEE Transactions on Intelligent Information Hiding and Multimedia Signal Processing, pp. 1217-1221, 2009.
- S. Lakshmi, and D. V. Sankaranarayanan, "A study of edge detection techniques for segmentation computing approaches", IJCA Special Issue on Computer Aided Soft Computing Techniques for Imaging and Biomedical Applications (CASCT), 2010.
- Barghout, Lauren, and J. Sheynin. "Real-world scene perception and perceptual organization: Lessons from Computer Vision", Journal of Vision, vol. 13 pp.709-709 ,2013.
- D. Karaboga, and B. Basturk. "On the performance of artificial bee colony (ABC) algorithm", Appl. Soft Comput., Vol. 8, pp. 687–697, 2008.
- I. Brajevic, M. Tuba, and M. Subotic, "Performance of the improved artificial bee colony algorithm on standard engineering constrained problems", International journal of mathematics and computers in simulation, vol.5, pp. 135-143, 2011.
- N. Ibrahim, H. E. M. Attia, Hossam E.A. Talaat, A. H. Alaboudy, “Modified Particle Swarm Optimization Based Proportional-Derivative Power System Stabilizer”, International Journal of Intelligent Systems and Applications, vol. 3, pp.62-76, 2015.
- Hardiansyah, Junaidi, Yohannes MS, “Solving Economic Load Dispatch Problem Using Particle Swarm Optimization Technique”, International Journal of Intelligent Systems and Applications, vol. 12, pp.12-18, 2012.
- R. Eberhart , and J. Kennedy," A new optimizer using particle swarm theory", In Proc. of the Sixth International Symposium on Micro Machine and Human Science, Nagoya, Japan, pp.39-43,1995.
- G. Venter, and J. Sobieszczanski-Sobieski, "Particle Swarm Optimization," AIAA Journal, vol. 41, pp. 1583-1589, 2003.
- Y. Liu, G. Wang, H. Chen, and H. Dong, "An improved particle swarm optimization for feature selection", Journal of Bionic Engineering, vol.8, pp.191-200, 2011.
- L. Yu and H. Liu, "Feature selection for high-dimensional data: a fast correlation-based filter solution," In Proceedings of the twentieth International Conference on Machine Learning, pp. 856-863, 2003.
- H. F. Eid, M. A. Salama, A. Hassanien:
- “A Feature Selection Approach for Network Intrusion Classification: The Bi-Layer Behavioral Based”, International Journal of Computer Vision and Image Processing , vol. 3, pp. 51-59 , 2013.
- M. Ben-Bassat, "Pattern recognition and reduction of dimensionality," Handbook of Statistics II, North-Holland, Amsterdam, vol. 1, 1982.
- T. Mitchell. Machine Learning. McGraw-Hill, 1997.
- M. Mizianty, L. Kurgan, and M. Ogiela, “Discretization as the enabling technique for the Na?ve Bayes and semi-Na?ve Bayes-based classification", The Knowledge Engineering Review, vol. 25, pp. 421–449, 2010.
- S. Kotsiantis, and D. Kanellopoulos, “Discretization Techniques: A recent survey",GESTS International Transactions on Computer Science and Engineering, vol.32, pp. 47-58, 2006.
- U. Fayyad, and K. Irani, "Multi-interval discretization of continuous-valued attributes for classification learning", In Proceedings of the International Joint Conference on Uncertainty in AI. Morgan Kaufmann, San Francisco, CA, USA, pp. 1022–1027, 1993.
- N. Dalal, and B. Triggs, "Histograms of oriented gradients for human detection", Computer Vision and Pattern Recognition, 2005.
- S. Wu, S. Bao, E. Xu, X. Wang, F. Chang, and Q. L. Xiang, "A Leaf Recognition Algorithm for Plant Classification using Probabilistic Neural Network", The 7th IEEE International Symposium on Signal Processing and Information Technology,Cairo, Egypt,2007.
- R. O. Duda, P. E. Hart, and D. G. Stork, "Pattern Classification", JohnWiley & Sons, USA, 2nd edition, 2001.
