Перспективный радар НР-МСТ: потенциал и диагностические возможности

Автор: Потехин А.П., Сетов А.Г., Лебедев В.П., Медведев А.В., Кушнарев Д.С.
Журнал: Солнечно-земная физика @solnechno-zemnaya-fizika
Статья в выпуске: 3 т.2, 2016 года.
Бесплатный доступ
В ближайшие годы в районе Иркутска планируется строительство радара, сочетающего в себе возможности радаров некогерентного рассеяния (НР) и мезосферно-стратосферно-тропосферных радаров (МСТ) [Жеребцов и др., 2011]. Радар НР-МСТ представляет собой фазированную решетку, состоящую из двух разнесенных антенных полотен, с цифровой многоканальной приемной системой, позволяющей проводить детальную пространственно-временную обработку сигнала обратного рассеяния. Показаны характеристики, конфигурация и возможности антенной и приемопередающей систем радара. Оценивается потенциал радара в основных режимах работы, включающих исследование ионосферы методом НР на высотах более ~100 км и изучение атмосферы с помощью сигналов, рассеянных на флуктуациях показателя преломления, вызванных атмосферными турбулентными неоднородностями, на высотах до 100 км. Моделирование показало, что радар позволит проводить регулярные измерения параметров нейтральной атмосферы на высотах до 26 км, а также наблюдать мезосферное летнее эхо на высотах ~85 км в присутствии заряженных ледяных частиц (при увеличении числа Шмидта) и мезосферное зимнее эхо на высотах ~65 км при повышении фоновой электронной концентрации. Оценка возможностей радара при работе в режиме НР в высотных диапазонах 100-600 и 600-2000 км показала, что в дневных условиях при накоплении 10 мин верхняя граница определения электронной концентрации и температуры ионосферной плазмы составляет ~1500 и ~1300 км соответственно при стандартном отклонении не более 10 %. Верхний предел определения скорости дрейфа составляет ~1100 км при стандартном отклонении 45 м/с. Оценка интерферометрических возможностей радара показала, что он обладает высокой чувствительностью к угловым размерам объекта порядка 7.5 угл. мин, а потенциальная точность определения углов цели может достигать 40 угл. сек.
Радар некогерентного рассеяния, мст-радар, фазированная решетка, потенциал атмосферных радаров, ионосфера, атмосфера
Короткий адрес: https://sciup.org/142103609
IDR: 142103609 | УДК: 621.396.6, | DOI: 10.12737/19444
Текст научной статьи Перспективный радар НР-МСТ: потенциал и диагностические возможности
Under the national heliogeophysical complex project, a new radar for extensive atmospheric research is planned to be developed. High radiation power and large aperture of the radar will allow us to study the ionosphere by the incoherent scatter (IS) method and the neutral atmosphere at heights of the mesosphere, stratosphere, and troposphere (MST). The radar is being worked out by Academician A. L. Mints Radiotechnical Institute (RTI) experienced in designing radars. The radar is developed from existing RTI instruments and is modified for atmospheric research purposes. It is necessary to study design features of the IS-MST radar and to assess its scientific potential.
The main purpose of the radar is to examine the structure and dynamics of the neutral atmosphere and ionosphere, as well as their interactions. Observations of the neutral atmosphere involve measuring the full vector of wind velocity, parameters of turbulence and atmospheric layers at tropospheric, stratospheric, and mesospheric heights. Of special interest are mesospheric echoes [Rapp, Lubken, 2004], which appear in summer and winter, being sometimes accompanied by noctilucent clouds [Romejko et al., 2003]. MST measurements also include studies of meteors at heights of the mesosphere and lower thermosphere, scattering by thermal plasma fluctuations, atmospheric gravity waves, and specular atmospheric layers [Hocking, 2011]. The IS method allows us to obtain ionospheric plasma parameters – electron density, ion and electron temperature, ion content, plasma drift velocity – at 100–2000 km and to observe ionospheric irregularities, coherent echoes, and the D layer. Thus, the radar will enable us to examine physical processes and interactions in the neutral atmosphere–ionosphere–plasmasphere system. The radar is also designed for interferometric observations of the fine structure of atmospheric irregularities and localized targets (satellites, space debris, and meteors), and for passive radioastronomical observations of the Sun and space radio sources. The national heliogeophysical complex includes a number of optical instruments, which will be located near the IS-MST radar and will increase its diagnostic capabilities. For example, observations of the lower and middle atmosphere along with lidar measurements make it possible to explore transfer processes [Bertin et al., 2001].
There are only about ten IS radars and twenty large MST radars in the world. Over the past five years, such instruments as the MST radar MAARSY in Norway [Latteck et al., 2012] and the MST/IS radar PANSY in Antarctica [Sato et al., 2014] have been put into operation. The multifunctional radar EISCAT-3D [McCrea et al., 2015] is planned to be developed. In its technical characteristics, the IS-MST radar should be highly competitive with the state-of-the-art systems. At present, we plan to locate the radar near Lake Baikal. This will enable us to study the atmosphere and ionosphere over the East Siberia, the region that has not had a diagnostic tool with such a large field of view before, and to complement the global radar network. In addition, this will facilitate ecological monitoring of the atmosphere near the lake.
The paper describes the antenna configuration and characteristics of the radar’s transceiver system, estimates the height range and the radar potential for working in MST and IS modes and for interferometric and radioastronomical research.
CONFIGURATION AND CHARACTERISTICS OF THE RADAR
The antenna system of the IS-MST radar consists of two phased arrays (panels) located along the magnetic meridian at a distance of 100 m from each other and tilted northward and southward at 20° (Figure 1). Each antenna panel is 40×40 m and includes 1536 cross-dipoles in the triangular lattice. The field of view of each antenna panel is ±45°, and the total field of view of the radar is ±65° from north to south and ±45° from east to west relative to the magnetic meridian. It should be appreciated that beam steering causes the beam to expand and the gain to decrease; therefore, for this radar configuration the potential increases at a 20° tilt relative to the horizon and decreases if the beam is directed vertically. The receiving system processes signals of two polarizations. In the radiation mode, the signal has a linear polarization. This facilitates Faraday rotation measurements of the absolute electron density [Shpynev, 2004].
We have chosen the location of the radar to narrow the radio horizon – the distance to nearest obstacles capable of generating clutter. This is required to decrease the minimum distance at which characteristics of a medium can be measured. Residual clutter will be compensated through special signal processing.
Table 1 lists the main characteristics of th e IS-MST radar. Pulse repetition frequ e ncy PRF , d u ty cycle q , and pulse length τ p depend on chosen operating mo d es: MST is i n the height r a nge 5–100 k m , IS-1 in 10 0 –600 km or IS-2 in 6 0 0–2000 km. We give t h ese height r anges as a n example – the real on e s will be s pecified in accordance with research objectives. For instanc e , measurem e nts made in the lower an d middle at m osphere do not requir e high pulse repetition fr e quency bec a use the Do p pler bandwi d th of MST s ignals is wi t hin 50 Hz; this allow s the radar to operate sim u ltaneously a t several dire c tions and m a ke addition a l coherent a c cumulation of signal t o increase the signal-to-n o ise ratio.
Each a ntenna panel is partitione d into 12 fra g ments comp o sed of 128 c r oss-dipoles a nd connecte d to separate transceive r modules. In the module, p artial beam f orming for signals from 1 2 8 antennas o ccur, thus g i ving rise to four output receive channels, each with two polari z ations and quadratures, av a ilable for fur t her processi n g.
Thus, each antenna array of the r adar will for m one narro w transmitting beam of 2.5 × 2.5° and 12 i ndependent wide recei v ing beams (12 times as w ide). The re c eiving bea m s are formed by phase ce n ters spaced a part across antenna panels. The panels are at 10 0 m from eac h other. This makes it pos s ible to comb i ne signals fr o m separate receive channels in order to increase the signal- t o-noise rati o , to obtain narrow receiv i ng beams, a n d to make interferom e tric observation.
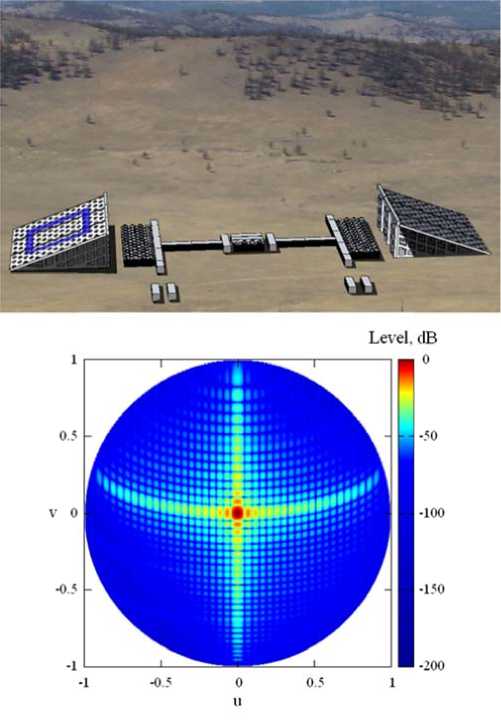
Figur e 1. The IS-MST radar (at t he top) and a r ray pattern. T he array tilt is compensate d by the bea m steering of 20° for vertical measurements
Table 1
Characteristics of the IS-MST radar
|
Characteristic |
Notation |
Value |
|
Frequency range |
f |
154–162.7 MHz |
|
Configuration |
– |
2 square arrays 40×40 m |
|
Antenna |
– |
Cross-dipole |
|
Number of antennas |
N t |
3072 |
|
Peak power |
P t |
2 MW |
|
Effective antenna area (2 arrays) |
A e |
2500 m2 |
|
Mean sidelobe level |
– |
–35 dB |
|
Noise temperature |
T e |
~500 K |
|
Beamwidth |
θ 0.5 |
2.5×2.5° (1 array) |
|
Receiver bandwidth |
Δ B |
625 kHz |
|
Bit length of coded pulse |
τ l |
3.2 µs |
|
Minimum height resolution |
Δ r |
480 m |
|
Pulse repetition frequency (MST/IS-1/IS-2 mode) |
PRF |
1333.3/250/75 Hz |
|
Pulse length (MST/IS-1/IS-2 mode ) |
τ p |
51.2/700/6500 µs |
|
Duty cycle ((MST/IS-1/IS-2 mode) |
q |
6.8/17.5/37.5 % |
|
Product of mean power by effective area |
P m · A e |
3.4·108/8.75·108/18.75·1 08 W · m2 |
|
Field of view |
– |
±45° |
The signal comes from a digital synthesizer, is transferred to an intermediate frequency, and is converted into the analog form. Then, it divides into all transmitters where it is phased in accordance with the desired direction. The phasing in the transmitting system is accomplished by four-bit analog phase shifters with a phase discrete of 22.5°. The selected phase quantization step of the analog phase shifter results in a gain reduction by 0.06 dB and in a sidelobe level increase. Synchronizing signals are also formed by a single local oscillator and divide into all transceiver modules; therefore, the radar is phase-coherent with respect to transmitted and received radio pulses.
The receiving system, as opposed to the transmitting one, is all-digital: signals of each polarization from the antennas are intensified in a low noise amplifier, are filtered and digitized. This ensures a wide dynamic range (less than 83 dB) that facilitates reception of both weak incoherent signals and strong coherent signals from the neutral and ionized atmosphere. The minimum operating height also depends on the chosen dynamic range because strong clutter leads to saturation in the receiving system, thus impeding their filtering. Received digital signals are split into quadratures, are phased and partially summed up, forming 12 channels from each array in two polarizations and two quadratures, making a total of 96 digital channels. In addition, the transceiver system will enable us to specify arbitrary amplitude and phase distribution in the antenna panel for signals from subarrays of 16 cross-dipoles. Therefore, we can obtain antenna patterns (AP) with a low or zero level of side lobes in selected transmitter and receiver directions.
Figure 1 pictures AP for one antenna panel (1536 elements) in the ground plane. The AP is designed using the classical approach considering the whole antenna field as a single phase center. This allows the calculation time to be reduced. In this case, the effect of mutual coupling between antennas, which causes distortion of AP in individual array elements, is ignored. To compensate tilt of the array, elements of the antenna panel is phased so that the main lobe is directed vertically. The AP has a non-symmetric bend form due to the triangle arrangement of elements and transformation of coordinates to the ground plane. In future, we will simulate the AP more accurately, taking in account fields of individual antennas and interactions between them.
Characteristics of modern IS radars are given, for example, in [Medvedev, 2014]. Most of the radars, constructed before 2000s, have parabolic antennas with a gain over 40 dB and 1–5 MW tube transmitters. Some MST radars are outlined in [Hocking, 1997]. In addition to them, we should mention such modern radars as EAR, MAARSY, and PANSY. Unlike IS radars, nearly all MST radars are multibeam phased arrays. This is most likely due to less severe requirements on the power of transmitted signal. The development and cheapening of digital integral devices offer an advantage to phased arrays that enable us to rapidly change beam direction, study several directions at a time, and change the shape of AP at different amplitude and phase distributions. The IS-MST radar with its peak power of 2 MW, aperture of 80×40 m, and digital antenna system can make atmospheric observations on a level with first-class instruments. At present, the Institute of Solar-Terrestrial Physics SB RAS studies the ionosphere, using the Irkutsk IS radar [Zherebtsov et al., 2002; Potekhin et al., 2008]. The main shortcomings of the radar are that it cannot make measurements at heights up to 150–200 km and has a fixed pulse-repetition period (24.4 Hz). The location of the new radar has been chosen to have a narrow radio horizon; hence the radar will not suffer from such shortcomings. The radar is unique also because its two antenna panels are spaced apart by 100 m and are tilted along the magnetic meridian. This position of the antenna arrays makes it possible to perform interferometric observation and to examine irregularities stretched along the magnetic field. Notice that nowadays there are only two radars working at 158 MHz: Kharkov and Irkutsk radars, which are similarly designed.
POTENTIAL OF THE RADAR FOR STUDYING THE LOWER, MIDDLE,AND UPPER ATMOSPHERE
Primary objectives of the radar are to examine dynamic processes in the upper, middle, and lower atmosphere and to study variations in ionospheric plasma parameters and interactions in the atmosphere–ionosphere– plasmasphere system. Accordingly, the radar should cover a wide range of heights. Yet medium parameters vary considerably with height, and the atmosphere should be examined by various methods. The main sources of echoes in this range is the incoherent scattering by thermal fluctuations of ionospheric plasma and the Bragg coherent scattering by turbulent fluctuations in the mesosphere–stratosphere–troposphere region, which is sometimes referred to as coherent scattering in the neutral atmosphere.
Operating modes of the IS-MST radar are shown in Figure 2. Separating the radar into two spaced antenna panels quickens scanning of the atmosphere in different directions for high-power backscattered signals (for example, when sounding the height range 100–600 km in the IS-1 mode). Above 600 km in the ionosphere (the IS-2 mode), two arrays should work simultaneously in one direction to increase the radar potential. The IS-MST radar has a linear polarization of transmitted signal, which allows us to obtain the ionospheric electron density profile, using Faraday rotation [Shpynev, 2004] or absolute measurements of scattered power.
The MST and IS-1 modes will facilitate the study of several directions with temporal resolution sufficient to determine the full velocity vector of the atmosphere, ionospheric drift, and neutral wind, as well as to examine atmospheric irregularities.
In the lower and middle atmosphere, for each transmitted pulse in each height range, equal to height resolution, we obtain a single complex sample for further processing. Signals at these heights have a coherence time of ~0.1 s, therefore the pulse repetition frequency may be low (tens and hundreds of hertz), but the measurement duration should be long enough to provide necessary frequency resolution (tens of seconds). In general, as the height increases, so does the spectral width of backscattered signal; and signals coming from different pulses lose their coherence. Accordingly, rigorous data-processing requires us to more often obtain samples of signals coming from the same height range (to increase the pulse repetition frequency). Besides, with increasing distance to a region of interest, pulses can be transmitted more rarely to avoid range ambiguities. Yet range resolution should be low, i.e. we should use short pulses or complex pulse-coded signals up to ~100 km, where atmospheric processes have smaller scales. These scales, in turn, depend on the rate of change of atmospheric parameters with height (height scale) and on the extent of atmospheric irregularities and wave disturbances in the plane perpendicular to the radar beam. Thus, at heights of the D and E layers, we should exploit special multipulse transmission modes [Farley, 1972] due to the strict requirements on frequency and range resolution. Starting from 100–200 km, the requirements on pulse width get more relaxed, the signal becomes more incoherent, and for each height range we can take the desired number of samples during one pulse. Problems caused by signal processing can be worsened by conditions of the medium itself. At some heights, intensity of atmospheric disturbances becomes insufficient to obtain echoes and to estimate parameters of the medium. This complicates the study of interactions between different atmospheric layers and makes it dependent on variations in the medium.
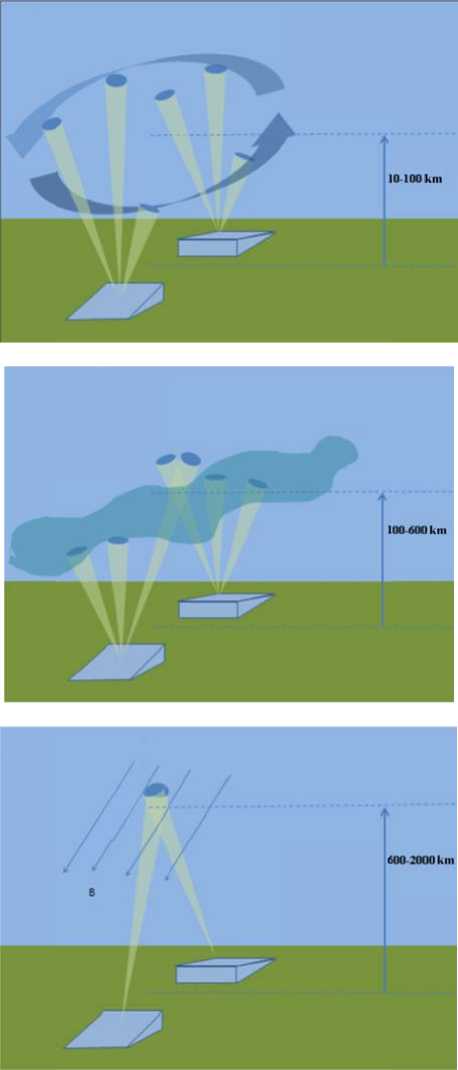
Figure 2. Operating modes of th e IS-MST rad a r. From top t o bottom: M S T, IS-1, and I S-2 modes
Most M ST radars operate at 45 – 55 MHz [Fu k ao et al., 1990; Hocking, 1997; Lattec k et al., 2012 ; Sato at el., 2014]. In the 2–30 km range under s t udy, we mak e regular obs e rvations of t h e troposphe re and lower s tratosphere, whereas a t 60–95 km we observe t h e mesosphe r e, including mesospheric echoes. Ow i ng to the d e cay of low turbulent i r regularities in the mesosp h ere, the scat t ered-signal power decreas e s with incre a sing operating frequency of the radar. This can have an ef fe ct on the f r equency of observation o f mesosphe r ic echoes. N evertheless, mesospheric echoes, though much weaker, were d e tected even by radars wit h the 930 M H z frequency [ Rapp et al., 2008]. Th e frequency range of the IS-MST radar is ~158 MHz, h ence we nee d to estimate th e frequency dependence of the power of signals scattered by t u rbulent irreg u larities.
Potential assessment technique
The height range that the radar allows us to study can be estimated by comparing the backscattered signal power with the radar sensitivity. It is more convenient to use volume reflectivity of the unit volume of medium σm [1/m], which depends only on atmospheric parameters. Then, the radar sensitivity is determined by the minimum volume reflectivity σ min the atmosphere should have to obtain the desired statistical significance of estimated medium parameters. If σ m /σ min >1, then we can make measurements at this height. The parameter σ min is found from the basic radar equation for the case of volume scattering [Bowles et al., 1962]:
P r = P 1 t 2 L 8 σ π τ 3 cR λ 2 2 θ ∫ φ ∫ G 2 ( θ , φ ) sin ( θ ) d θ d φ , (1)
where P t is the peak radiated power, L are losses in the radar system and during signal propagation though the atmosphere, τ is the sounding pulse length, R is the distance to the center of the scattering volume, G (θ, φ) is the antenna gain in the direction (θ, φ). To the square of gain G 2, which accounts for reception and radiation of the same antenna system, corresponds a bidirectional AP 1.8×1.8° wide for one radar segment. In this case, σ determines the fraction of isotropically scattered power per unit scattering volume.
Let us express the assumed power P r through the signal-to-noise ratio S / N :
P r = kT Δ BS / N , (2) where k is the Boltzmann constant, T is the noise temperature of the radar, Δ B is the frequency bandwidth of the receiver. It is assumed that the receiver has only white thermal noise of the radar and has no clutter (they are said to be eliminated after data processing). The noise characteristics being known, the S/N ratio defines the signal level required to attain the statistical significance of measurements, say, to restrict variance of estimated medium parameters within the prescribed limits.
The integral in (1) accounting for the shape of AP can be approximated by the Gaussian curve for the square aperture array [Hagen, Baumgartner, 1996]:
∫∫ G 2 ( θ , φ ) sin ( θ ) d θ d φ = 0.44 ( 4 π) 2 A e θφ λ
.
By substituting (2) and (3) in (6), we obtain
π R 2 kT Δ B SN σ min = 18.2 ,
PtLτcAecos3 θ where cos3 θ takes into account losses caused by beam steering (cos θ due to a decrease in aperture projection and cos2 θ as an estimate of AP of one cross-dipole). At this stage of development of the IS-MST radar, the losses L are unknown. They are normally clarified during radar calibration. In further calculations, we set L=0.25.
In the case of scattering by turbulent irregularities, σm is calculated from the formula given in [Lübken, 2014]. To estimate atmospheric parameters, we utilize the neutral atmosphere model NRLMSIS-00 and the International Reference Ionosphere model IRI-2012. Turbulence intensity determined by the rate of dissipation of the turbulent energy ε is taken to be 10–3 m2s–3 in the troposphere, 10–5 m2s–3 in the stratosphere, and 10–1 m2s–3 in the mesosphere; this corresponds to moderate disturbances [Hocking, 1985; Watkins et al., 1988; Kantha, Hocking, 2011; Gavrilov, 2013]. Neutral atmosphere parameters are assumed to be determined from autocorrelation function delays. The main measurable parameter in the lower and middle atmosphere is the wind velocity; therefore, the signal-to-noise ratio in (4) is such that the standard deviation of estimated velocity is within 1 m/s in the stratosphere and troposphere, and 2 m/s in the mesosphere. The expressions for variance of estimated velocity with respect to phase of the autocorrelation function are taken from [Zrnic, 1979].
Potential for tropospheric–stratospheric research
MST radars regularly measure parameters of signals scattered by turbulent fluctuations of medium [Hocking, 2011]. Turbulent mixing of the neutral component in the stratosphere and troposphere produces the gradient of refractive index. Scattering occurs by refractive index fluctuations with typical scales equal to half the incident wavelength (Bragg's law). The volume reflectivity σ m of refractive index fluctuations caused by turbulent irregularities in the atmosphere depend on the operating frequency of a radar, shape of the spectrum of turbulent fluctuations, and atmospheric parameters [Hocking, 1985]. The turbulence energy spectrum is divided into a buoyancy range, where energy is generated, an inertial range, where the energy slowly decreases, and a viscosity range, where turbulence rapidly decays and the energy is converted into heat. The height of transition between the inertial and viscosity ranges depends on frequency. For example, for VHF radars the transition takes place at heights above 40 km [Hocking, 1985]. In the middle and upper stratosphere with slowly varying atmospheric parameters and low turbulence intensity, the scattered-signal power decreases. This leads to disappearance of echoes at 30–60 km. An important feature of measurements in the lower and middle atmosphere in a vertical direction is the presence of strong coherent reflections from horizontal extended layers. These echoes have a narrow spectrum less than 1 Hz wide and aspect sensitivity. In the following, we assess the potential of the radar for scattering only by turbulent fluctuations.
Figure 3 illustrates the ratio σ m /σ min in the troposphere and stratosphere for three operating frequencies: 50 MHz (the standard frequency of MST radars), 158 MHz (the frequency of the IS-MST radar), and 233 MHz (the frequency of the EISCAT VHF radar). The last frequency has been chosen because the EISCAT VHF radar, which has a relatively low (for IS radars) operating frequency (233 MHz), also performed MST observations [Strelnikova, Rapp, 2010]. Since for the operating mode in the lower atmosphere there are no special requirements on transmission power, Figure 3 also shows the ratio σ m /σ min when only one antenna panel is employed. This allows the temporal resolution to be improved. In the simulation, we have specified the following characteristics: τ p =7 μs, PRF =1000 Hz, the accumulation time of 20 s, the Doppler bandwidth of 5 Hz. During the simulation, only frequency of the radar and effective temperature changed, while aperture held its size. It is apparent that when measuring wind velocity in the troposphere and lower stratosphere, a frequency rise enables us to improve potential of the radar (first of all, its temporal resolution) until scattering occurs by turbulent fluctuations in the inertial range. This is due to the fact that the frequency rise causes Doppler shift to increase and thus to be more pronounced against clutter. After transiting to the viscosity range as height rises (it occurs earlier for smaller wavelengths), scattering intensity abruptly decreases. To raise the threshold of wind velocity measurements, we should significantly improve characteristics of the radar and began to use lower frequencies [Hocking, 1997]. Under specified conditions, the IS-MST radar (158 MHz) will facilitate wind velocity measurements up to ~26 km with a standard deviation within 1 m/s.
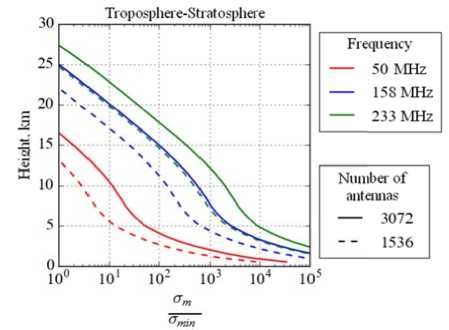
Figure 3. The σ m /σ min ratio in th e stratosphere for different frequencies a n d sizes of th e panel in han d
Potential for mesospheric research
In the mesosphere at the height o f the D laye r , the signal is further ampl i fied due to e n hanced elec t ron density. At the sa m e time, as the height incre a ses, so does t he kinematic viscosity of the atmosphe r e. This caus e s the decay of small-s c ale turbulence in the mes o sphere and t h e transition to the viscos i ty range, an d hence loss o f scattered-signal strength [Hocking, 1985].
Neve r theless, at ~85 km in su m mer and at ~ 70 km in winter, we ca n observe me s osphere su m mer echoes (MSE) and mesosphere winter echoe s (MWE). T h e echoes are registered in a wide range from MF to U HF waves [Tereshch e nko et al., 2002; Rapp e t al., 2008]. D espite their having mostly been dete c ted in the polar region, mesospheric echoes were regularly o b served at mi d dle latitudes t oo. Zeller et a l. in [Zeller e t al., 2006] s h ow that for a midlatitude radar the frequency of o ccurrence of echoes is 7 a n d 0.3 % of t h e total obse r vation time f o r MSE and MWE res p ectively. MST radars also facilitate the study of scattering by met e or trails at 80–100 km, t h us allowing measurem e nts of temperature and ne u tral wind vel o city.
In the viscosity range, turbulenc e decays; ho w ever, there exists a mecha n ism which c a n reduce sca t tered signal attenuation and is supposed to prod u ce MSE [Lü b ken et al., 1 9 98]. In sum m er at ~85 k m , there arise ionized ice particles w hich decrease electron di ff usion. This r esults in enhancement of electron den s ity fluctuations on small spatial sca l es [Rapp, Lubken, 2004]. The degree o f diffusion attenuation is r epresented b y the Schmid t number Sc that can be as large as several thousands of units [ S trelnikov et al., 2009]. MSE at ~82 km a re often acc o mpanied by noctilucen t clouds [von Zahn, Breme r , 1999], whi c h are visible with unaided e ye [Tereshc h enko et al., 2010]. At the height of MWE occurrence (~70 km), the kinemati c viscosity of medium is st i ll sufficientl y low, and ec h o formation does not r e quire ice particles. MWE are thought to appear at hig h electron de n sity and turb u lence of me d ium. This is confirmed b y comprehensive measur e ments of atm o spheric parameters [Lübk e n et al., 200 7 ].
The previously used formula for finding σm [Lübken, 2014] allows us to vary Sc. To simulate MSE, we take a layer with increased Sc as a necessary condition for echo occurrence. Figure 4 depicts the σm/σmin ratio for three frequencies and values of Schmidt number. The standard deviation of the estimate for the mesosphere is taken to be 2 m/s because observable wind velocities in the mesosphere are higher than those in the troposphere and stratosphere. For the simulation, we have chosen the time of day with high ionospheric electron density because it has an effect on the power of echoes [Lübken, 2014]. The Schmidt number increases gradually from 1 at 82 km to a specified value at 85 km. Unlike the troposphere and stratosphere, in the mesosphere decay of small-scale turbulence becomes significant, and radars with lower operating frequencies have an advantage regardless of the estimated parameter. It is apparent that the IS-MST radar will enable us to observe MSE at increased Sc. Above 87 km, the decay becomes significant, and the signal strength falls sharply.
MW E occurrence is not followed by an increas e in Sc , but is normally acc o mpanied by e nhanced electron density. Figure 5 shows the σ m /σ min ratio for M W E and multi p le increase in electron densi t y relative to t h e value from IRI. The IRI model does not produce values below 6 5 km. This is i llustrated by the figure. Theblack vertica l line depicts t h e boundary, where the s ignal is above the threshol d of sensitivit y of the radar (σ m /σ min =1). I t is shown th at a faint echo at 158 MHz may exist if electron density in the D la y er increases b y an order of magnitude. T h e frequency o f 233 MHz d o es not allow us to meas u re the neutral wind velocity in MWE und e r the specified conditions.
Incoh e rent scattering
The IS method is the most informative way of analyzing Earth’s upper atmosphere. It facilitates measurements of ionospheric plasma parameters: electron density, ion and electron temperature, plasma drift velocity, ion content, and frequency of collision with the neutral component in the D layer.
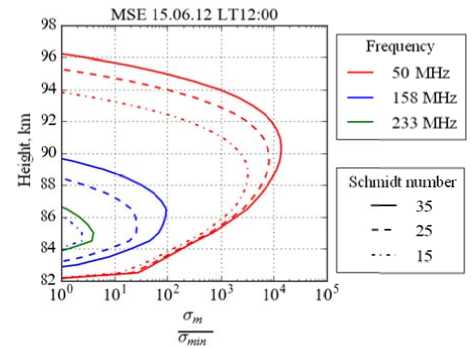
Figure 4. The σm/σmin ratio for M SE at differ e nt frequencie s and Schmid t numbers
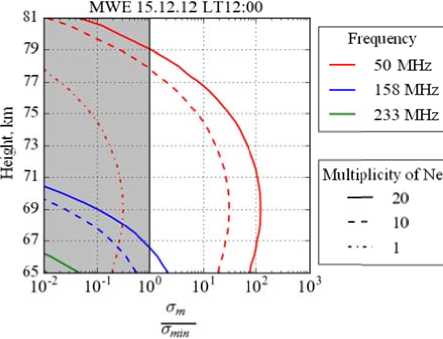
Figure 5. The σm/σmin ratio for MWE at di ff erent freque n cies and ele c tron density levels. The v ertical line indicates the threshold of sensitivity o f the radar
The volume reflectivity for IS measurements is
° IS =
N e ^ e
(1 + a2 )(1+a2 + Te T)
where σ e ≈10–28 m² is the effective cross-section of electron, α=4πD/λ, D is the Debye length, T e is the electron temperature, T i is the ion temperature, N e is the electron density.
We estimate the ionospheric plasma parameters through multiparameter fitting of autocorrelation function or spectrum of a received signal. To analyze variances of the estimated parameters, it is convenient to use the empirical approximation that is given in [Murdin, 1979] for electron density, temperature, and plasma drift velocity. The ionospheric parameters considerably change with height. This has a marked effect on backscattered-signal spectrum and typical scales of current processes (height scale, tidal wave length). Accordingly, the operating mode of the radar should be changed for different heights. The radar has two basic operating modes for ionospheric observations at heights from 100 km: IS-1 and IS-2 (see Figure 2). The former mode is meant for heights 100–600 km and is characterized by the following parameters: the pulse length τp=700 μs, PRF =250 Hz. Besides, the IS-1 mode suggests using only one radar segment. In the IS-2 mode for heights from 600 km, we employ longer pulses τ p =6500 μs, and frequency of their repetition decreases to PRF =75 Hz.
Figure 6 pictures the σ m /σ min ratio for the IS-1 and IS-2 modes for estimated electron density and temperature with a standard deviation within 10 % and plasma drift velocity with a standard deviation of no more than 45 m/s. The accumulation time is assumed to be 10 min. The modeling is made for summer noon when electron density is sufficiently high. It is apparent that the plasma drift velocity, even with a high statistical deviation, cannot be measured at a lower height than electron density and temperature. At the height of operating mode change (600 km), the pulse length increases, but the pulse repetition frequency decreases; therefore, the σ m /σ min ratio rises slightly. Above 600 km, σ m /σ min is low even in the maximum operating mode; hence, if the real potential of the radar turns out to be lower due to neglected losses in transmitter/receiver or processing system, the threshold of determining plasma parameters may lower to 800–1000 km. Nevertheless, under disturbed conditions the accumulation time may become shorter, and thus temporal resolution may be improved. This allows a detailed study of ionospheric processes.
To comparatively assess the potential, Figure 7 shows the σm/σmin ratio, found by the same method for the Irkutsk Incoherent Scatter Radar (IISR), which has been used for ionospheric research for over ten years [Zherebtsov et al., 2002; Medvedev, 2014]. The IISR has a frequency scanning principle and a smaller effective antenna area than the IS-MST radar has. It receives backscattered signals of only one polarization and transmits pulses no longer than 900 μs with a pulse repetition frequency of 24.4 Hz. These limitations hamper the comprehensive study of the ionosphere at heights above 600 km. Moreover, clutter restricts the lower range of the heights of interest, thus making it impossible to observe the ionosphere and atmosphere at heights up to 100 km. The boundary of velocity measurements is seen to be situated much lower than that shown in Figure 6. This is due to the low pulse repetition frequency of IISR and consequently due to the short sample length for the same accumulation time (10 min).
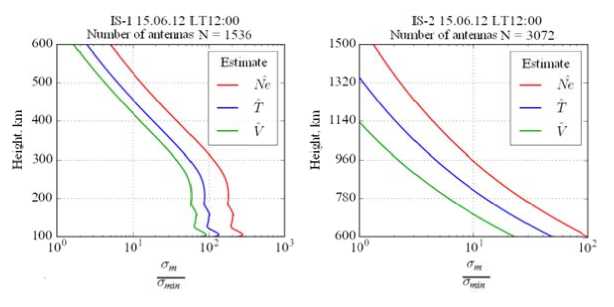
Figure 6. The σm/σmin ratio for e stimated ele c tron density, temperature, and plasma d r ift velocity. T he number of antenna s in the IS-1 and IS-2 mo d es determin e s the functio n ing of the r a dar using on e (1536 ante n nas) or two (3072 ante n nas) segments respectivel y .
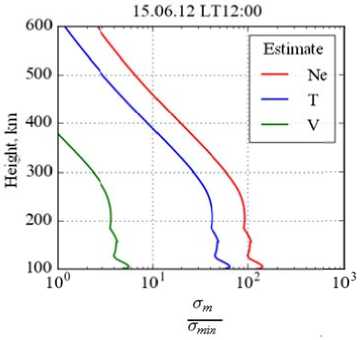
Figure 7. The σ m /σ min ratio for t h e IISR
When comparing Figures 6 and 7, we shoul d take into account that th e plot in Fig u re 6 (the IS-1 mode, the upper panel) is constructed for one array of th e IS-MST radar whereas t wo arrays e n able us to a nalyze two directions a t a time with the same po w er consumpt i on. Howeve r , we should n ote that by c o ntrast to the I ISR, digital processing of signals in each antenn a of the IS- M ST radar increases power consumption. This is mo s t noticeable when the radar works in the passive operating mod e .
ESTIMATED SENSITIVITY OF THE RADAR IN STUDYING COHERENCEPROPERTIES OF SCATTERED SIGNALS
At present, interferometric metho d s offer the gr e atest promise for studying t h e lower, mid d le, and upper atmosphere. They have b een extensively developed b oth theoretic a lly and experimentally. Image radars whi c h enable reco n struction of the fine str u cture of irregularities in a s c attering volu m e from radar measurement s are being wo r ked out. Suc h a method is employed to study, for example, tur b ulence and n eutral wind v elocity in t h e lower atm o sphere. Rad a r images of irregularities provide further insight int o physical me c hanisms responsible for thei r formation.
The m ain target of research in this method , associated w ith paramet e rs of a med i um, is the s t andardized correlatio n coefficient (CC) of sign a ls u 1( t ) and u 2( t ), receive d by two and m ore spaced antennas:
П =
Nowadays, the interferometric method is the most advanced in the study of such objects as spacecraft, space debris, meteors, meteor trails, backscattered signals from ionospheric irregularities, turbulent structures stretched along the magnetic field, artificial heating region, turbulent irregularities in the mesosphere and lower atmosphere, internal gravity waves. Of great practical interest is the study of cosmic radio emission, particularly the distribution of radio emission over the solar disk and its dynamics.
Specificity of the antenna system of the IS-MST radar allows us to consider it as a two-position interferometer with the base D =140 m; its transmitting and receiving antennas are identical and have a half-power beamwidth of 2.5°. The main lobe of AP can be approximated by the Gaussian curve with an accuracy of 5 %:
f 9 2 1
F beam (0) = exp
2 o ?
у beam у where σbeam is the effective beamwidth.
Sensitivity of the IS-MST radar in observation of ionospheric irregularities and radioastronomical objects can be assessed as follows. Let us consider an observed object of Gaussian form:
f (0)=

= A exp
( 0-0 0)2 2 ^ 6
where ^ n ( ( o)| у is the electron density disturbance (obeam=0.711), W (9) is the average power flux (obe am =1.422), oe is the characteristic angular size of the object, θ 0 is the object’s center of mass. Although we study different objects (electron density disturbances and distributed radio source), the resulting equation for CC takes the form
П = exp
2 k a ° beam i22eam + N, k ef
( A к 2n2 n2 ka ubeamuQ
ч 2(°2eam + 2°6 )y
CC amplitude
where ka =2πD/λ=463.28 (el. degree/(1 degree of elevation angle ), λ=1.9 m is the wavelength.
Figure 8 illustrates the dependence of CC amplitude and effective slope of CC phase-angle response k ef on the angular size of the object σ θ . This figure indicates that as angular sizes of the object increase, the slope of phaseangle response becomes steeper, i.e., the interferometer becomes less sensitive to change of the angular position of the observed object.
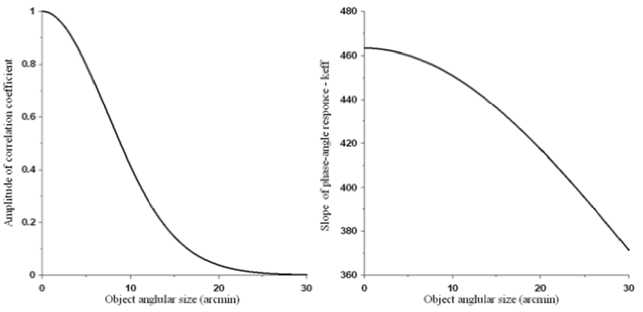
Figure 8. The CC amplitude (on the left) and t he slope of phase-angle response as a f u nction of an g ular size of the observ e d object σ θ
The maximum derivative of the C C amplitud e corresponds to an object w ith an angul a r size of 7.3 arcmin, i.e., in this regi o n CC is most sensitive to changes of a n gular sizes of the object. T his enables u s to use CC t o determine transverse sizes of the observed obje c t. The high s e nsitivity of t h e IS-MST r a dar to angul a r sizes of object of about 7.5 arcmin offers great promise for studying the fine structur e of irregula r ities in the l o wer, middle, and upper atmospher e , as well as the fine struct u re of solar ra d io emission.
Potential capabilities of the IS- M ST radar in s canning spacecraft and sp a ce debris We c a n express the cross-sectio n of spacecraf t through the basic radar eq u ation:
5 (4 n ) 3 R 4 kT K B
N P G 2 X 2
Since the greatest danger arises f rom small-si z ed space debris, let us ass e ss sensitivit y of the IS-M S T radar for objects in the Rayleigh region, i.e., at k 0 a <0.75 ( k 0 i s the wave number, a is th e radius of m e tal sphere). In the region of Rayleig h scattering, for the metal sphere the r a tio between its diameter d and cross- s ection has t h e following dependence:
I n d | °° 9 kl

Table 2 lists calculated sizes of d ebris for S / N = 10.
Table 2
Calcula t ed particle sizes at S / N =1 0
|
R , k m |
100 |
4 00 |
1000 |
1500 |
2000 |
|
d , c m |
0.7 |
1 7 .5 |
32.2 |
42.3 |
51.2 |
Figur e 9 shows the sensitivity of the IS-MST r a dar in scanning spacecraft and space de b ris for differ e nt signal-to-noise ratios. ISTP SB RAS has maste r ed technique s and algorith m s for the IISR, which ens u re stable ope r ation of the radar at S / N <1.
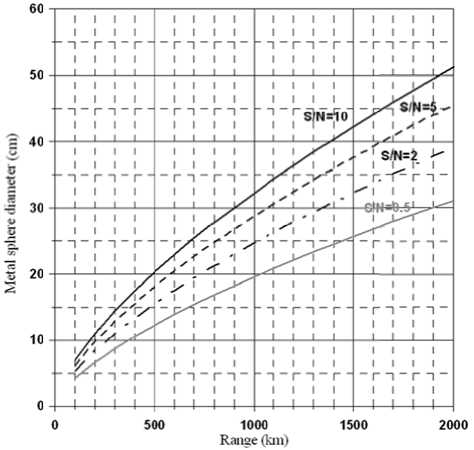
Figur e 9. Sensitivity of the IS-MS T radar in sca n ning spacecr a ft and space d e bris for diffe r ent signal-to- n oise ratios
At present, we have achieved th e following p o sitioning accuracy: the st a ndard deviat i on in range i s ~100–300 m, the sta n dard error in determining target angles is ~2–5 arc m in. The tech n iques worke d out for the I ISR can be applied to the IS-MST radar, with potential accura c y in determining angles re a ching 40 arc s ec.
The w ide field of view of the IS-MST radar e q ual to 90° will allow us to observe spac e craft and spa c e debris for more than 100 s. This suffices to determine orbital p arameters wit h accuracy necessary to pr ed ict the next c ircuit of the object. Thus, IS-MST radar data suffice to define orbi t al parameters of small-size d space debris.
CONCLUSION
The IS-MST radar is designe d for comple x diagnostic s of the atm o sphere fro m the troposphere to the plasmasphere; therefore, the range o f heights u n der study should be as b road as pos s ible. Atmos p here-radiosounding methods offer the possibil i ty to contin u ously exami n e turbulence in the tropo s phere, strat o sphere, and mesosphere, to observe meteor echo in the meso s phere and l o wer thermos p here, and t o study the i o nosphere at heights from 60 km. Almost all ty p es of radar echo allow u s to obtain a 3D veloci t y vector to explore the atmospher i c dynamics and processes o f transfer be t ween atmospheric layers.
Most m odern radars used to stu d y Earth’s at m osphere have phased ante n na arrays. Th i s type of ant e nna system as opposed to parabolic dishes enabl e s us to chan g e beam direction without a ny mechani c al motion of the antenna system. The fast progress in digital s y stems facilit a tes the accumulation of si g nals from se p arate structu r al elements of antenna panel for further processi n g, in particul a r for interferometric obse r vation. The p rospective IS-MST radar also repre s ents a phased antenna sy s tem with 2 4 receive channels, each w ith complex amplitude b a ckscattered signals of t wo polarizations. The ch o sen position o f its antenna arrays provides a wide f ie ld of view f or the radar northward and southward along the magnetic m e ridian. The new instrum e nt has char a cteristics co m parable to characteris t ics of state-of-the-art IS a n d MST radar s .
Spacing of antenna arrays gives an interferometric base of 140 m, thus enabling us to examine the fine structure of atmospheric irregularities. We have shown that the antenna system offers the possibility to use the correlation coefficient to determine orbital parameters of spacecraft and space debris.
We have estimated the height range of the IS-MST radar, which represents the total potential of the radar for atmospheric research. We have demonstrated its capabilities for regular measurements of turbulent irregularities in the troposphere and stratosphere. We have found that in the lower and middle atmosphere the efficiency of measurements of wind velocity is higher for radars with higher frequency if scattering occurs in an inertial range of spectrum of turbulent refractive-index fluctuations. The lower boundary of the height range in the troposphere will depend on signal processing system, specifically on filtering of local clutter. We have shown that the radar enables us to observe echoes in the summer mesosphere, which are scattered by turbulent fluctuations in the presence of charged ice particles, which corresponds to an increase in the Schmidt number. It also facilitates observation of rarer winter mesospheric echoes [Zeller et al., 2006] under enhanced electron density. In the mesosphere, MST radars with a frequency of 50 MHz [Hocking, 1997] have an advantage over the IS-MST radar because turbulent fluctuations with typical scales equal to half the wavelength begin to decay with increasing height. The IS-MST radar enables us to measure plasma parameters – electron density, temperature, and plasma drift velocity – through multiparameter fitting in the IS-1 and IS-2 modes (height ranges 100–600 and 600–1500 km respectively) with sufficient statistical accuracy. Comparative modeling of potential of the IISR has revealed that the new instrument has great diagnostic capabilities of studying the ionosphere at heights from 400 km, and allows us to explore the atmosphere below 100 km.
The work was funded by the RF President’s Grant for Support of Leading Scientific Schools No. NSh-6894.2016.5.
Список литературы Перспективный радар НР-МСТ: потенциал и диагностические возможности
- Жеребцов Г.А., Заворин А.В., Медведев А.В. и др. Иркутский радар некогерентного рассеяния//Радиотехника и электроника. 2002. Т. 47, № 11. С. 1339-1345.
- Жеребцов Г.А., Потехин А.П., Куркин В.И. и др. Радиофизические и оптические инструменты Национального гелиогеофизического комплекса РАН//Распространение радиоволн: XXIII Всеросс. науч. конф. Йошкар-Ола, 23-26 мая 2011 г.: сб. докл. в 3-х тт. Йошкар-Ола: МарГТУ, 2011. Т. 1. С. 47-54.
- Медведев А.В. Развитие методов и аппаратных средств радиофизических исследований верхней атмосферы Земли на Иркутском радаре некогерентного рассеяния: дис. … д.ф.-м.н. Иркутск, 2014. 225 с.
- Потехин А.П., Медведев А.В., Заворин А.В. и др. Цифровые системы регистрации и управления Иркутского радара некогерентного рассеяния//Солнечно-земная физика. 2008. Вып. 11. С. 77-86.
- Терещенко В.А., Терещенко В.Д., Черняков С.М. Зимние полярные стратосферные облака 2010 года в высоких широтах//Вестник МГТУ. 2010. Т. 13, № 4/2. С. 1052-1059.
- Терещенко В.Д., Терещенко В.А., Ковалевич Т.В. Сезонные изменения полярного мезосферного эха средних радиоволн//Труды 20-й Всероссийской конференции по распространению радиоволн. Нижний Новгород, 2-4 июля 2002 г. Нижний Новгород: НИРФИ, 2002. С. 135-136.
- Bertin F., Campistron B., Caccia J.L., Wilson R. Mixing processes in a tropopause folding observed by a network of ST radar and lidar//Ann. Geophys. 2001. V. 19. P. 953-963.
- Bowles K.L., Ochs G.R., Green J.L. On the absolute intensity of incoherent scatter echoes from the ionosphere//J. Res. National Bureau of Standards-D. Radio Propagation. 1962. V. 66D, N 4. P. 395-407.
- Farley D.T. Multiple-pulse incoherent-scatter correlation function measurements//Radio Sci. 1972. V. 7, N 6. P. 661-666 DOI: 10.1029/RS007i006p00661
- Fukao S., Sato T., Tsuda T., et al. MU radar: New capabilities and system calibrations//Radio Sci. 1990. V. 25, N 4. P. 477-485 DOI: 10.1029/RS025i004p00477
- Gavrilov N.M. Estimates of turbulent diffusivities and energy dissipation rates from satellite measurements of spectra of stratospheric refractivity perturbations//Atm. Chem. Phys. 2013. V. 13. P. 12107-12116 DOI: 10.5194/acp-13-12107-2013
- Hagen J.B., Baumgartner H.A. Backscatter gain of aperture antennas//Radio Sci. 1996. V. 31, N 4. P. 693-699 DOI: 10.1029/96RS01095
- Hocking W.K. Measurement of turbulent energy dissipation rates in the middle atmosphere by radar techniques: A review//Radio Sci. 1985. V. 20, N 6. P. 1403-1422. DOI: 10.1029/RS020i006p01403.
- Hocking W.K. Recent advances in radar instrumentation and techniques for studies of the mesosphere, stratosphere and troposphere//Radio Sci. 1997. V. 32, N 6. P. 2241-2270 DOI: 10.1029/97RS02781
- Hocking W.K. A review of mesosphere-stratosphere-troposphere (MST) radar developments and studies, circa 1997-2008//J. Atm. and Solar-Terr. Phys. 2011. V. 73. P. 848-882 DOI: 10.1016/j.jastp.2010.12.009
- Kantha L., Hocking W. K. Dissipation rates of turbulence kinetic energy in the free atmosphere: MST radar and radiosondes//J. Atm. and Solar-Terr. Phys. 2011. V. 73. P. 1043-1051 DOI: 10.1016/j.jastp.2010.11.024
- Latteck R., Singer W., Rapp M., et al. MAARSY: The new MST radar on Andøya -System description and first results//Radio Sci. 2012. V. 47. RS1006. DOI: 10.1029/2011RS004775.
- Lübken F.-J. Turbulent scattering for radars: A summary//J. Atm. and Solar-Terr. Phys. 2014. V. 107. P. 1-7 DOI: 10.1016/j.jastp.2013.10.015
- Lübken F.-J., Rapp M., Blix T., Thrane E. Microphysical and turbulent measurements of the Schmidt number in the vicinity of polar mesosphere summer echoes//Geophys. Res. Lett. 1998. V. 25, N 6. P. 893-896.
- Lübken F.-J., Singer W., Latteck R., Strelnikova I. Radar measurements of turbulence, electron densities, and absolute reflectivities during polar mesosphere winter echoes (PMWE)//Adv. Space Res. 2007. V. 40. P. 758-764. DOI: 10.1016/j.asr.2007.01.015.
- McCrea I., Aikio A., Alfonsi L., et al. The science case for the EISCAT_3D radar//Progress in Earth and Planetary Science. 2015. V. 2 DOI: 10.1186/s40645-015-0051-8
- Murdin J. Errors in incoherent scatter radar measurements//EISCAT Technical Note. 1979. N 79/16. 40 р.
- Rapp M., Lübken F.-J. Polar mesosphere summer echoes (PMSE): Review of observations and current understanding//Atmos. Chem. Phys. 2004. V. 4. P. 2601-2633. DOI: 10.5194/acp-4-2601-2004.
- Rapp M., Strelnikova I., Latteck R., et al. Polar mesosphere summer echoes (PMSE) studied at Bragg wavelength of 2.8 m, 67 cm, and 16 cm//J. Atm. and Solar-Terr. Phys. 2008. V. 70. P. 947-961 DOI: 10.1016/j.jastp.2007.11.005
- Romejko V.A., Dalin P.A., Pertsev N.N. Forty years of noctilucent cloud observations near Moscow: Database and simple statistics//J. Geophys. Res. 2003. V. 108, N D8. P. PMR 10-1-10-6 DOI: 10.1029/2002JD002364
- Sato K., Tsutsumi M., Sato T., et al. Program of the Antarctic Syowa MST/IS radar (PANSY)//J. Atm. and Solar-Terr. Phys. 2014. V. 118. P. 2-15 DOI: 10.1016/j.jastp.2013.08.022
- Shpynev B.G. Incoherent scatter Faraday rotation mea-surements on a radar with single linear polarization//Radio Sci. 2004. V. 39. RS3001 DOI: 10.1029/2001RS002523
- Strelnikov B., Rapp M., Strelnikova I., et al. Small-scale structures in neutrals and charged aerosol particles as observed during the ECOMA/MASS rocket campaign//Ann. Geophys. 2009. V. 27. P. 1449-1456 DOI: 10.5194/angeo-27-1449-2009
- Strelnikova I., Rapp M. Studies of polar mesosphere summer echoes with the EISCAT VHF and UHF radars: Information contained in the spectral shape//Adv. Space Res. 2010. V. 45. P. 247-259 DOI: 10.1016/j.asr.2009.09.007
- Von Zahn U., Bremer J. Simultaneous and common-volume observations of noctilucent clouds and polar mesosphere summer echoes//Geophys. Res. Lett. 1999. V. 26, N 11. P. 1521-1524.
- Watkins B.J., Philbrick C.R., Balsley B.B. Turbulence energy dissipation rates and inner scale sizes from rocket and radar data//J. Geophys. Res. 1988. V. 93, N D6. P. 7009-7014.
- Zeller O., Zecha M., Bremer J., et al. Mean characteristics of mesosphere winter echoes at mid-and high latitudes//J. Atm. and Solar-Terr. Phys. 2006. V. 68. P. 1087-1104 DOI: 10.1016/j.jastp.2006.02.015
- Zrnic D. Estimation of spectral moments for weather echoes//IEEE Trans. Geoscience Electronics. 1979. V. GE-17, N 4. P. 113-128 DOI: 10.1109/TGE.1979.294638
